78
available online at www.ssbfnet.com
The Sources of Efficiency in the Nigerian Banking Industry: A Two- Stage
Approach
Frances N Obafemi
a, Olumide S Ayodele
b, Friday S Ebong
c a,b,cDepartment of Economics, University of Calabar, Calabar, Nigeria.
Abstract
The paper employed a two-stage Data Envelopment Analysis (DEA) approach to examine the sources of technical efficiency in the Nigerian banking sub-sector. Using a cross section of commercial and merchant banks, the study showed that the Nigerian banking industry was not efficient both in the pre-and-post-liberalization era. The study further revealed that market share was the strongest determinant of technical efficiency in the Nigerian banking Industry. Thus, appropriate macroeconomic policy, institutional development and structural reforms must accompany financial liberalization to create the stable environment required for it to succeed. Hence, the present bank consolidation and reforms by the Central Bank of Nigeria, which started with Soludo and continued with Sanusi, are considered necessary, especially in the areas of e banking and reorganizing the management of banks.
Keywords: Banking Efficiency; Data Envelopment Analysis; Financial Liberalization JEL Classification: G21
© 2013 Published by SSBFNET 1. Introduction
In their treatise, McKinnon (1973) and Shaw (1973 demonstrated the role that banks play in the process of economic growth and development of an economy .They showed that the financial sector could be a catalyst for economic growth and development if it is efficiently managed. This role relates mainly to mobilization of savings and efficient financial intermediation.
The Nigerian banking sub-sector had witnessed various types of distortions. Before 1987, the banking industry was faced with a policy-imposed distortion. This distortion was manifested in the interest rate policy and barriers to entry into the industry. Thus, the Nigerian banking system was repressed, as interest rate was directly administered by the Central Bank of Nigeria (CBN). Deposit and lending rates were set for the financial intermediaries leading to low interest rates and excessive liquidity outside the banking system.
However, high inflation rate persisted making the real rates of return on savings negative and thereby discouraging savings. This suggested efficiency loss in the intermediation process as it constrained the expansion and development
79
of financial intermediation by discouraging savers with low deposit rate and investors with high loan rates (Ngugi, 2003).
In 1987, Nigeria, like many developing countries, embraced financial liberalization thereby introducing the Structural Adjustment Programme (SAP). One of the rationales for liberalizing the financial system was to improve the efficiency of the sector by making the environment competitive. Obute (1987), amongst others, saw the liberalization of the financial sector of Nigeria as a way of overcoming the problems brought about by the distortions in the financial system.
For the banking industry, it is believed that the efficiency of the banking industry, pre-and-post-liberalization, should be different with the latter showing higher efficiency. Studies on the efficiency of the banking sector have been inconclusive, as regards its pre-and-post-liberalization efficiency status since they gave mixed results. Furthermore, the source of banking efficiency (inefficiency) differs among countries; and is still a subject of controversy.
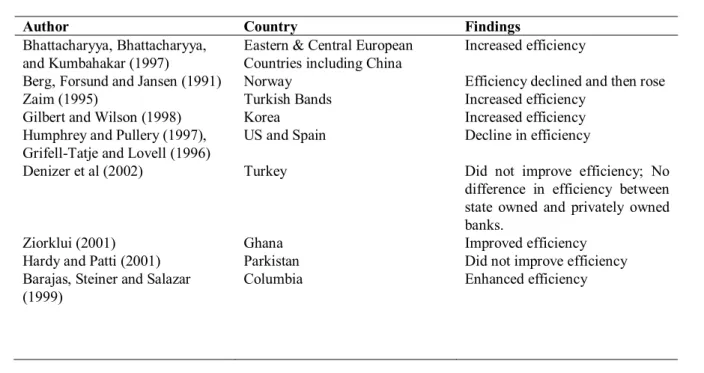
Studies have shown that the sources of efficiency are firm specific. However, some common factors affect the efficiency of all firms. Financial reforms have been one factor that dominates the efficiency literature as an important determinant of banking efficiency. Fecher and Pestieau (1993) observe that in the wave of recent policies of deregulation and privatization, a number of studies reveal that efficiency is positively related to the degree of openness and competitiveness. According to them, the studies often show that for better efficiency, competition matters more than private ownership. This, however, is not the finding of some other studies. The table below shows selected studies done on effect of financial liberalization on the efficiency of the banking industry, and other determinants of banking efficiency.
Table I: Selected Studies on the Effect of Financial Liberalization on the Banking Industry and other Determinants of Banking Efficiency
Author Country Findings
Bhattacharyya, Bhattacharyya, and Kumbahakar (1997)
Eastern & Central European Countries including China
Increased efficiency
Berg, Forsund and Jansen (1991) Norway Efficiency declined and then rose Zaim (1995) Turkish Bands Increased efficiency
Gilbert and Wilson (1998) Korea Increased efficiency Humphrey and Pullery (1997),
Grifell-Tatje and Lovell (1996)
US and Spain Decline in efficiency
Denizer et al (2002) Turkey Did not improve efficiency; No difference in efficiency between state owned and privately owned banks.
Ziorklui (2001) Ghana Improved efficiency
Hardy and Patti (2001) Parkistan Did not improve efficiency Barajas, Steiner and Salazar
(1999)
80 Table Continued
Ikhide and Alawode (2001) Nigeria Bank’s health deteriorated Asogwa (2005) Nigeria Did not change the level of
competition
Oyaromade (2005) Nigeria Had positive impact on financial savings mobilization
Adeoye and Adewuyi (2005) Nigeria No growth in savings, no improvement in the level of financial dependence
Koeva (2003) Indian Commercial Banks Increased competition, decline in bank spreads, reduction in cost of intermediary
Barajas, Steiner and Salazer (2000)
Colombian Banks Increased competition, lower intermediation cost
Galindo A. et al (2001) 12 developing countries Improved efficiency Demirguc-Kuit and Detragiache
(1998)
Panel of 53 developed and developing countries
Banking crises more likely to occur in a liberalized system
Nyong (2005) Nigeria No improvement in efficiency
Fuentes and Verges(2003) Chile Banks with higher concentration of ownership showed higher levels of cost and profit efficiency. Foreign owned banks showed higher levels of cost and profit efficiency. In efficiency decreases when the economy is expanding and the larger the banks.
Vernikov(2004) Russia Foreign owned and controlled banks strengthened the bank importing high standards of efficiency and management amongst other things.
Bauer, Berger and Humphrey(1993)
USA Larger Banks are more efficient than smaller ones.
Fercher and Pestieau(1993) OECD Competition and regulation favour both efficiency level and efficiency change.
One observation made about most of these studies is that some of them (e.g Denizer et al, 2002) rely on a narrow set of data – short time series of an industry before and after deregulation or privatization which may not be sufficient for any meaningful conclusion. Another observation is the use of performance indicators instead of calculated efficiency scores. Efficiency indicators are observable factors that seem to determine the level of efficiency. At best, they (performance indicators) are approximations and introduce bias in the work (Eeckaut, Tulkens, and Jamar 1993). The conclusions from these studies may not be useful for banks in the LDCs. This is because of the peculiar nature of the money and capital markets in LDCs.
Finally, most of the studies did not inquire into the sources of efficiency in the banking system, which is important for policy. Noting that most of the studies on the efficiency of the banking sector were on industrialized countries, this
81
study is an attempt to fill these gaps by investigating the sources of efficiency of the Nigerian Banking sub-sector in the pre-and post-liberalization eras using DEA approach. It will generate actual efficiency scores for those periods for better analysis. This is because for the banking sector, studies have shown that the problems of inefficiency are more important than scale and scope issues (Berger, Humbphrey, 1991; Berger, Hunter and Timme, 1993). The paper hypothesizes that due to the inherent distortions in the market economy, financial liberalization has not improved the efficiency of the banking industry in Nigeria as envisaged.
Traditionally, efficiency in the banking sector included reducing transaction and search costs in the process of financial intermediation, reducing interest rate spreads, etc. All these are efficiency indicators. However, in terms of measurement, (getting actual values of efficiency), efficiency of a production unit is taken as a comparison between observed and optimal values of its output and input. In doing this, four measures of efficiency are recognized. These are technical, cost, scale and allocative. This study will focus on technical efficiency which measures how close a firm is to the production possibility frontier for given quantities of inputs.
The choice of variables for this study was determined by availability of data and the methodology employed (cross section).The study employed a two- stage procedure. In the first stage, a DEA model was constructed and used to generate efficiency scores. In the second stage, the efficiency scores from the first model are regressed against a set of explanatory variables.
The technical efficiency of banks is measured for four different periods. These are 1984/1985, 1994/1995, 1999/2000 and 2003/2004. The period 1984/1985 was chosen to examine the technical efficiency of banks pre-liberalization. The efficiency of banks during SAP i.e. Post-liberalization was measured in 1994/1995, while 1999/2000 and 2003/2004 demonstrated banking efficiency during democratization. This is intended to give a broader understanding of the efficiency of banks bearing in mind different policies and styles of government in Nigeria over-time. It will also shed light on the evolution of the degree of technical inefficiency over-time.The periods, which were before the Sanusi and Soludo consolidation exercise, were deliberately chosen to further show the importance of the exercises to the survival of the Nigerian banking industry.
A cross section of both commercial and merchant banks was used for each period. In obtaining the data, we used the Annual Reports of the banks in the Nigeria Banking, Finance and Commerce Books compiled by Research and Data Services Limited (Redasel), Lagos Nigeria for the periods of the study.
2. The Efficiency of the Nigerian Banking Sub-sector
2.1. Bank Production Theories
The theory of production is the basis for Data Envelopment Analysis (DEA). This shows the relationship between factor inputs and outputs. The production function according to Nyong (2005) constitutes a frontier for the production possibility focus. The calculation of efficiency can be made relative to this frontier if it is known.
82
In the literature, banks are seen as business entities or firms that combine capital, labour and other financial inputs to produce financial outputs (Wheelock and Wilson, 1999). In analysing the efficiency of banks, the issue of variable selection poses some problems, which arises from the ability to identify the appropriate outputs, which banks produce, and their inputs. For instance, the variable may convey a different meaning, although they carry the same name, or the same meaning may be reported under different names.
Humphrey (1991) identified three measures of banking output. These are:
the number of transactions processed in deposit and loan accounts. This is a flow measure;
the real or constant naira value of funds in the deposit and loan accounts, which is a stock measure; and the number of deposit and loan accounts services by banks. This is also a stock measure.
He argued that the preferred measure is the flow measure because output is a flow. However, in some instance, stock measures are used. This is the situation where the flow measure is unavailable or because the stock measure might be proportional (on average) to a flow measure.
Humphrey (1991) also maintained that measuring bank inputs presents less controversy. Labour (number of workers or total hours worked), and the real or constant naira value of physical capital (usually the book value of premises, furniture, and equipment deflated by some price index) are recognized by him to clearly represent inputs needed to produce bank outputs. He treated the real or constant naira value of loanable funds – core deposits and purchased funds – as an input. Six different views on what constitutes banks’ input and output are recognized. These are the Production Approach (Sherman and Gold, 1985), Intermediation Approach (Humphrey, 1985), Asset Approach (Humphrey,1991; Nyong,2005),User-Cost Approach (Humphrey,1991; Grigori,2002), Value Added Approach (Berger and Humphrey, 1991,1992) and the Modern Approach (Ziorklui, 2001).
2.2 The Model and Estimation
Following Nyong (2005), we adopt the Grigorian (2002) approach – a variant of the modern approach of bank production in choosing inputs and outputs. Thus, we assume that the labour (personnel management, X1), fixed assets
(computer hardware and premises) and also captured extensive branch network, X2 and interest expenses (leverage
funds) X3 are inputs. The outputs are revenues (emphasizes profit maximization, Y1), loans and advances (service
provision Y2) and liquid assets including securities investments (liquidity services, Y3). The model is adapted from
Ali and Seiford (1993) and Nyong (2005).
The DEA begins with a relatively simple fractional programming formulation. Assume that there are n decision-making units (DMUs) to be evaluated. Each DMU consumes different amount of i different inputs and produces r different outputs (i.e., DMUj consumes Xji amount of inputs to produce Yjr amounts of outputs). It is assumed that
these inputs, Xji and outputs Yjr are non-negative and each DMU has at least one positive input and output value.
Mathematically, we say that the DMUj consumes amount Xji > 0 of input i, j = 1, 2, 3. . . k; and produces amount Yjr >
83
Based on this, DEA seeks to determine which of the DMU determines an envelope surface or efficient frontier. DEA provides a comprehensive analysis of relative efficiency for multiple inputs, multiple output situations by evaluating each DMU and measuring its performance relative to envelopments composed of other DMUs. Units that lie on the surface are considered efficient while those that lie below the surface are termed inefficient and the analysis provides a measure of their relative efficiency.
The VRS model was utilized. This is because it gives technical efficiency of DMUs under investigation without scale effect. In this model, all the points (Xj, Yj) lie on or beneath the hyper plane and the hyper plane passes through at
least one of the points (Obsersteiner, 1999; Ali and Seiford, 1993, 1994).
In the VRS model, U1 = virtual multiplier associated with output 1 for DMUj, U2 = virtual multiplier associated with
output 2 for DMUj, U3 = virtual multiplier associated with output 3 for DMUj, w = virtual multiplier associated with
VRS.
The objective function indicates the distance of the DMU from the hyper plane. Maximization of the objective function selects a hyper plane, which minimizes this distance. Hence, an optimal value of zero indicates that the DMU lies on the hyper plane and hence is efficient. Non-zero objective function values indicate that the particular DMU lie below the supporting hyper plane.
The DEA analysis requires solving linear programming problems; one for each DMU. While ‘xij’ and ‘yrj’ are the
observed values for the DMUs and are constants, u, v, w are the variables. The latter gives the feasible solution. In compact form, the VRS is:
VRSm (Xj, Yj) s m Max = ∑yr l ur - ∑ xj l vi + w (ur, vi,, w) r=1 i=1 s m = ∑ yrj ur - ∑ xij vi + w ≤ 0 for j = i, . . ., n. r =1 i=1
The efficiency scores computed reflects the extent to which each bank converts its inputs to outputs. It reveals the extent to which each DMU could further increase its outputs proportionally without consuming additional resources. Efficiency is measured as the vertical (output orientation) or horizontal (input orientation) distance of DMUs to the efficiency frontier. If a DMU is on the production possibility set, it is defined as efficient. DEA also identifies for inefficient DMUs, the sources and level of inefficiency for each of the bank (Charnes, Cooper, Lewin and Seiford, 1994). This is because it is a strictly deterministic technique. It ignores the error term and treats the total deviation from the production frontier as inefficiency. The degree of inefficiency shows the potential output loss due to not utilizing available resources to the fullest extent.
84
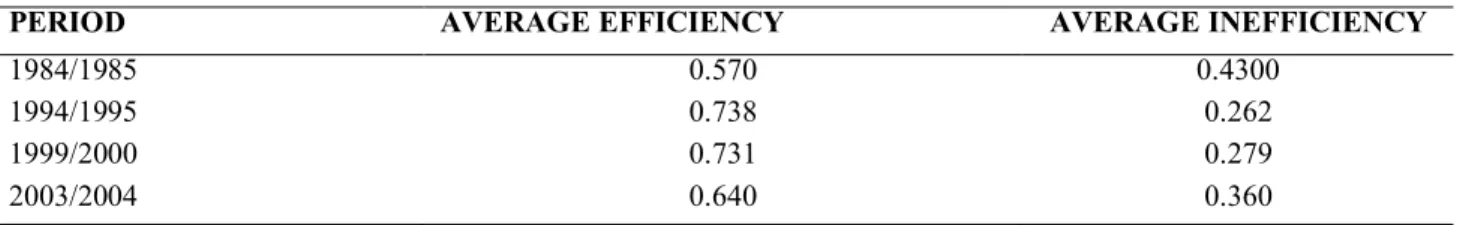
The average efficiencies of the Nigerian banking sub-sector for the four periods of study using DEA professional version 2.1 are shown in the table below.
Table II. Average efficiency scores of the Nigerian banking industry for the various periods used
PERIOD AVERAGE EFFICIENCY AVERAGE INEFFICIENCY
1984/1985 0.570 0.4300
1994/1995 0.738 0.262
1999/2000 0.731 0.279
2003/2004 0.640 0.360
Source: Researchers’ Calculation
This is also shown graphically in Figure 1 below:
Fig. I. Average efficiency of Nigerian banking industry.
The result shows that on the average, Nigerian banks were inefficient. This is because the average efficiencies for the industry for the four periods were all below one, implying that they all fell below the efficiency frontier. The results further revealed that the highest level of average efficiency was in 1995 (post-liberalization) with average efficiency of 73.8 per cent, while the lowest level was in 1985 (pre-liberalization) with an average efficiency of 57 per cent. These results suggest that liberalization improved the overall efficiency of the Nigerian banking industry.
Clearly, all the average efficiency scores of the banking industry for the three periods after liberalization were higher than the pre-liberalization average efficiency score. Though the level of inefficiency of the banking industry decreased in the liberalization period, the results indicate that within the liberalization era, the average efficiency of the banking industry was on a downward trend.
AVERAGE EFFECIENCY 0 0.1 0.2 0.3 0.4 0.5 0.6 0.7 0.8 1985 1995 2000 2003
85
Thus, from an average of 73.8 per cent in 1995, it came down to 64 per cent in 2003. This suggests that the high efficiency gain at the initial period of liberalization was not sustained. It should also be pointed out that in 2000, when there was a slight drop was immediately after the democratization process in 1999.
From the foregoing analysis, one can say that the banking industry in Nigeria had been inefficient on the average, both during the pre- and post- liberalization era. However, the average deviation from the efficiency frontier showed a tremendous decline in the post- liberalization era.
3. Determinants of Efficiency
There is no organized body of theory that gives the determinants or sources of efficiency (inefficiency). However, many explanations have been given in the literature as to the factors that determine efficiency. These variables influence the efficiency with which inputs generate outputs in a production process.
The variables that theoretical literature recognized as possible determinants of banking efficiency(inefficiency) include quasi–fixed variables, site-specific characteristics, socio-economic and demographic characteristics, the weather,etc over which the decision maker has no control during the time period under consideration(Lovell (1993) . Others are presence or absence of competition, the degree of market concentration and openness to foreign competition (Fe Cher and Pestieau (1993). Denizer (2000) mentioned the ownership of banks: whether private or public; the stability of the macroeconomic environment, liberalization, and political interference.
Also noted are technology, innovation activities, international exposures, quality of the work force and ownership structure (Funke and Rahn, 2000). Characteristics of the banking system such as vulnerability to sudden capital overflows (measured by the ratio of M2 to foreign exchange reserves), liquidity (measured by the ratio of bank cash
and reserves to bank assets), exposure to the private sector (measured by the ratio of loans to the private sector to total loans) and logged credit growth were mentioned by Dermirguc-Kunt and Detragiache (1998); while behaviour and performance of banks were noted by Nyong(2005) and the quality of management and capital adequacy are also seen as factors capable of affecting the efficiency of banks (Lovell, 1993). Badunenko, Fritsch and Stephen (2005) observed that size, research and development (R and D) are the determinants.
Using the efficiency scores from the previous section as dependent variable, we use the following as explanatory variables:
Ownership (WS): It took the value of one for government (public) owned banks and zero for private owned banks. Market share (MKS): This was used to measure the size of banks. The ratio of individual loans of banks to total loans was used as a proxy.
Quality of management (QM): The ratio of profit to loans was used as a proxy.
Capital adequacy (CA): The proxy was the ratio of share capital to deposit (Onoh, 2002). Capital-labour ratio (KL): The proxy was the ratio of fixed assets to labour.
86
Liquidity ratio (LQD): According to CBN, liquidity ratio is the ratio of total specific liquid assets to total current liabilities. This was adopted here.
Thus, the model is:
EFB = f (WS, MKS, QM, CA, KL, LQD (1)
Mathematically, it becomes:
EFBi = a0 + a1 WSi + a2 MKSi + a3 QMi + a4CAi + a5KLi + a6LQDi (2)
a0 > 0; a1 0; a2 > 0; a3 > 0; a4 > 0; a5 0; a6 > 0.
Where: EFBi = Technical Efficiency of Banks i
Panel data method was utilized to get the coefficient of the unknowns. In order to do this, we transformed equation 2 thus:
EFBit = b0 + b1 WSit + b2 MKSit + b3 QMit + b4CAit + KLit + LQDit +Eit (3)
where: i = subscript for firm t = time subscript
For the determinants (sources) of efficiency (inefficiency), the second stage regression results for the four periods are as shown in the tables below.
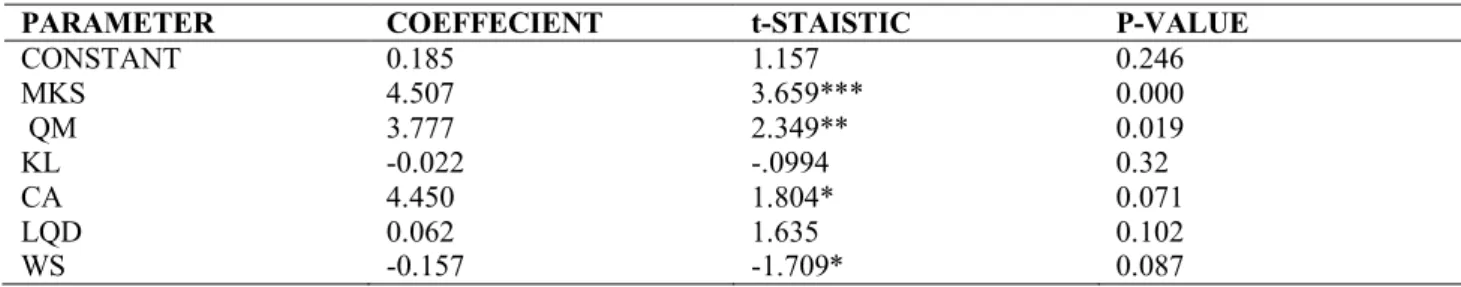
The result showed that in 1985 the determinants of technical efficiency in the Nigerian banking industry were market share, quality of management, capital adequacy and ownership. Each of them was significant at various levels of significance.
Table III. 1985 Regression Result
PARAMETER COEFFECIENT t-STAISTIC P-VALUE
CONSTANT 0.185 1.157 0.246 MKS 4.507 3.659*** 0.000 QM 3.777 2.349** 0.019 KL -0.022 -.0994 0.32 CA 4.450 1.804* 0.071 LQD 0.062 1.635 0.102 WS -0.157 -1.709* 0.087
Table IV. The 1995 Regression Result
PARAMETER COEFFECIENT t-STAISTIC P-VALUE
CONSTANT 0.603 9.975 0.000 MKS 14.359 3.370*** 0.001 QM 0.384 1.175 0.240 KL -0.0006 -3.291*** 0.001 CA 0.119 0.476 0.634 LQD 0.021 0.838 0.402 WS -0.332 -1.556 0.120
Note: *** indicates significance at the 1% significance level, ** indicates significance at the 5% significance level,
87
The 1995 result showed that MKS is still statistically significant and positively related to efficiency. Capital-labour ratio (KL), which was not statistically significant in 1985, was significant in 1995 though with a negative sign. Quality of Management (QM), capital adequacy (CA), liquidity (LQD) and ownership (WS) were all statistically insignificant in 1995.
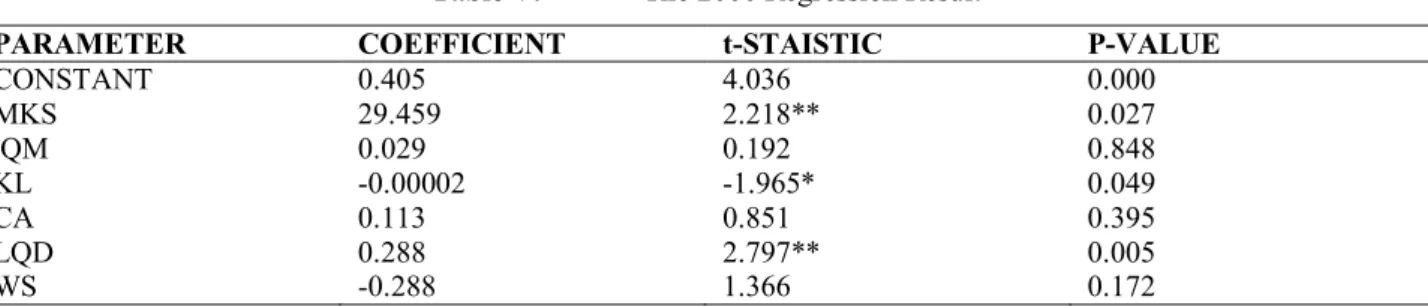
Table V. The 2000 Regression Result
PARAMETER COEFFICIENT t-STAISTIC P-VALUE
CONSTANT 0.405 4.036 0.000 MKS 29.459 2.218** 0.027 QM 0.029 0.192 0.848 KL -0.00002 -1.965* 0.049 CA 0.113 0.851 0.395 LQD 0.288 2.797** 0.005 WS -0.288 1.366 0.172
The 2000 result still showed that market share (MKS) is a positive and significant determinant of efficiency of Nigerian banks at 5% level of significance. This implies that larger banks affect efficiency positively. The continued significance of MKS even in the face of the banking crisis experienced in 1990s and the democratization process that had just begun in 1999 is very instructive. It may be attributed to the fact that due to the liquidation of some banks, the surviving ones devised various aggressive marketing strategies to control a large share of the market.
Liquidity ratio was also positive and statistically significant at 5% level of significance. Capital-labour ratio was still negative but significant at 10% level of significance. This is rather surprising being that the reform in the financial system had been fourteen years old. It still implies significant labour intensive technique, which lowers efficiency of banks. Furthermore, the poor state of the infrastructural facilities in Nigeria may had made the cost of running the equipments outweigh its benefit such that it reduced efficiency.
Quality of management, capital adequacy and ownership were all positively related to banking efficiency but non-significant. The positive impact of WS was very instructive. It showed that private ownership of banks increased efficiency. This is consistent with the result by Obafemi (2012) where all the efficient banks were privately owned. Its non-significance may be attributed to the fact that most of the privatized banks may not have the strong management to turn things round. It could also be explained by the low technological advancement of these private banks, which makes them not significantly affect efficiency.
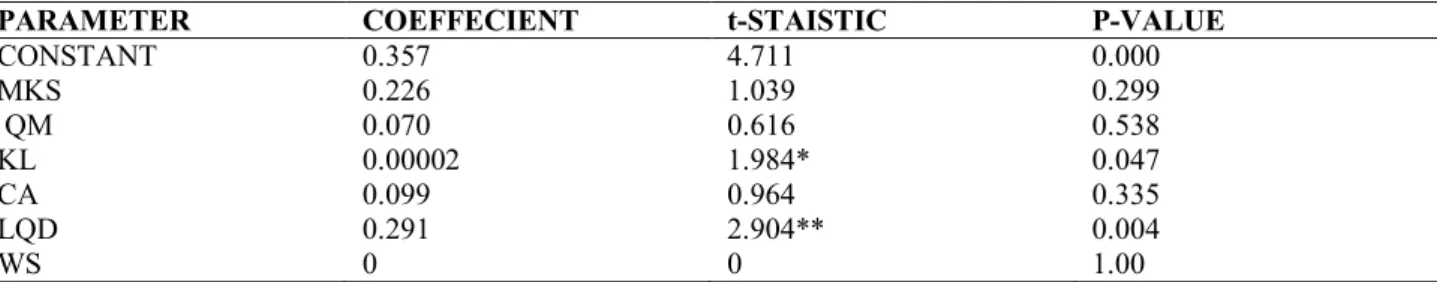
The coefficient of market share (MKS) is positive but insignificant in 2003. The non-significance of MKS in 2003 is surprising bearing in mind the fact that it had been significant in the previous three periods. This implies that MKS was no longer an important determinant of efficiency in 2003. This may be due to the fact that banks share were getting smaller due to the competition because of the entry of many banks into the banking industry.
88
Table VI. 2003 Regression Results
PARAMETER COEFFECIENT t-STAISTIC P-VALUE
CONSTANT 0.357 4.711 0.000 MKS 0.226 1.039 0.299 QM 0.070 0.616 0.538 KL 0.00002 1.984* 0.047 CA 0.099 0.964 0.335 LQD 0.291 2.904** 0.004 WS 0 0 1.00
The result further showed that capital labour ratio (KL) and liquidity ratio (LQD) are positive and significant at 1% and 5% levels of significance respectively. This means that they significantly contributed to efficiency in 2003. The positive sign of KL shows that banks were becoming more capital intensive in 2003. This may be as a result of the fact that banks had to invest more on information technology to be able to cope with the stiff competition in the industry. The result further showed that QM and CA though positive, were insignificant implying that capital adequacy and quality of management did not contribute significantly to efficiency in 2003.
Furthermore, the result showed that ownership of banks WS is positively related to efficiency in 2003. This is unlike the previous three periods when WS had a negative impact on efficiency. This can be due to the fact that by almost all the banks were privately owned while the publicly owned banks had been privatized. All these may have led to the major restructuring that took place in the Nigerian Banking Industry in .
From the analysis above, it can be seen that one of the strongest determinants of banking efficiency is market share. Thus, as long as there is high market share, the efficiency of banks will increase while a reduction in market share happened at a period when efficiency of banks reduced. We can deduce that any policy that will significantly increase market share in such a way that we have large banks will significantly increase the efficiency of banks in Nigeria. The result indicates that public ownership of banks had a negative impact on banking efficiency while private ownership affects efficiency of banks positively. This implies that policies that promote privatization of banks will increase efficiency of banks.
4. Conclusions
The study is a retrospective one. The essence is to examine whether the financial liberalization, which came as a panacea to the problems of distortion in the banking industry actually increased the efficiency of the banking industry in Nigeria. It also inquired into the sources of banking efficiency before the Soludo and Sanusi banking reforms in Nigeria. The study revealed that the banking industry in Nigeria was not efficient both in the pre-and in post-liberalization era. In the pre-post-liberalization era, the reason for the inefficiency was due to the distortions in the financial system. It further revealed that market size was a strong determinant of efficiency; and advocates the encouragement of large size banks in Nigeria. Quality of management was seen as not having any significant impact on the efficiency of the banking sub-sector in Nigeria. This speaks of poor quality of management in the banking industry before these
89
reforms. Thus, the study agrees with the Sanusi reforms that touched significantly on the management of banks in Nigeria.
It is the submission of this study, therefore that the present consolidation and reforms by the Central Bank of Nigeria under Sanusi are necessary and should continue. Making bank executives to answer for their misdeeds, and fixing the duration of their tenure is a step in the right direction. It would go a long way in addressing some of the issues. Furthermore, though e banking is presently practiced in Nigeria, in trying to address the problem of asymmetric information, there are still some imperfections in the system especially in the area of infrastructure like power, which hinders the efficiency of the banking system.
References
Adeoye, B. W. and A. O. Adewuyi (2005). Benefits and Costs of Financial Reforms: Nigeria’s Experiences. Paper Presented at the 46th Annual Conference of the Nigerian Economic Society (NES), August, Lagos.
Ali, A.I. and L. M. Seiford (1993).The Mathematical Programming Approach to Efficiency Analysis in The Measurement of Productive Efficiency, Fried Harold, C.A.K.Lovell, and S.S. Schmidt (eds), Oxford University Press, London.
Anyanwu, J.C. (1997), The Structure of the Nigerian Economy, 1960-1997, Joanle Educational Publishers Ltd, Nigeria.
Asogwa, R. C. (2005) .Assessing the Benefits and Costs of Financial Sector Reforms in Nigeria: An Event Study Analysis. Paper Presented at the 46th Annual Conference of the Nigerian Economic Society (NES), August, Lagos. Barajas, A., R. Steiner and N. Salazar (1999). Foreign Investment in Colombia’s Financial Sector, IMF Working Paper 99/150.
Barajas, A., R. Steiner and N. Salazar (2000).The Impact of Liberalization and foreign Investment on Colombia’s Financial Sector. Journal of Development Economics, Vol. 63, No. 1.
Bauer, P.W., A.N. Berger and D.B. Humphrey (1993).Efficiency and Productivity growth in U. S. Banking in The Measurement of Productive Efficiency, Fried, H.O., C.A. knox Lovell and S.S. Schmidt Seed, Oxford University Press, New York; pp. 386 – 413. Non-Parametric Approach to Efficiency Measurement, Journal of Productivity
Berg, S. A., F. Forsund, and E. Jansen (1991).Technical Efficiency of Norwegian Banks: An Analysis, Vol. 2, pp. 127-142.
Bergen dahl, G. 1998).DEA and Benchmarks – An Application to Nordic Banks. Annals of Operation Research, Vol. 82, pp. 233-249.
Berger, A. N. and D. B. Humphrey, (1991).The Dominance of Inefficiencies Over Scale and Product Mix Economies in Banking. Journal of Monetary Economies, Vol. 28, pp. 113-148.
Berger, A. N., G. A. Hanweck and D. B. Humphrey (1987).Competitive Viability in Banking. Journal of Monetary Economics, 20.
Berger, A. N., W. C. Hunter, and D. B. Humphrey (1993).Bank Efficiency Derived from Profit Function. Journal of Banking and Finance, Vol. 17, pp. 313-343.
Bhattacharyya, A., A. Bhattacharyya and S. C. Kumbhakar (1997).Changes in Economic Regime and Productive Growth: A Study of Indian Public Sector Banks. Journal of Comparative Economics, Vol. 25, No.2, No.2, 196-201.
90
Clerk J. A. (1988).Economies of Scale and Scope At Depository Financial Institutions: A review of the Literature.
Economic Review Federal Reserve Bank of Kansas City, Sept./Oct.
Demirguc – Kuit, A. and E. Detragiache, (1998).Financial Liberalization and Financial Fragility. IMF Working Paper, WP98/83.
Denizer, C. A, M. Dinc and M. Tarimcilar (2000).Measuring Banking Efficiency in the Pre-and Post-Liberalization Environment Evidences from the Turkish Banking System. Policy Research Working Paper, World Bank.
Eeckaut, P.V., H. Tulkens, and M. Jamar (1993).Cost Efficiency in Belgian Municipalities in The Measurement of Productive Efficiency, Fried, H.O., C.A. knox Lovell and S.S. Schmidt Seed, Oxford University Press, New York; pp. 300 – 334.
Fecher, F. and P. Pestieau (1993).Efficiency and Competition in O.E.C.D. Financial Services in The Measurement of Productive Efficiency, Fried, H.O., C.A. knox Lovell and S.S. Schmidt Seed, Oxford University Press, New York; pp. 374 – 385.
Fuentes, R and M. Vergare (2003).Explaining Bank Efficiency; Bank Size or Ownership Structure. Central Bank of Chile, May.
Gilbert, R. A. and P. W. Wilson (1998).Effects of Deregulation on the Productivity of Korean Banks. Journal of Economics and Business, 50: 133-166.
Grigorian, D. (2002).Determinants of Commercial Bank Performance in Transition: An Application of Nordic Banks.Annals of operation Research, Vol. 82, pp. 233-249.
Hardy, D.C. and E.B. Patti (2001).Banking Efficiency in Pakistan. IMF Working Paper, WP/01/138.
Hirshberger, E. K., T. Osmonbekov, and N. Donthu (2001).Benchmarking Marketing Performanc. Working Paper, January 21st, Georgia State University.
Humphrey, D. B. and L. B. Pulley (1997).Banks Response to Deregulation: Profits Technology and Efficiency.
Journal of Money, Credit and Banking, vol. 29, no. 4.
Iganiga, B.O. (2000), The Structure of the Nigerian Financial System, Amfitop Books, Lagos.
Ikhide, S.I. (1990).On the Deregulation of Interest Rates in Nigeria – myths and Realities. Nigerian Financial Review,
vol. 3, no. 1. March.
Ikhide, S.I. and A. A. Alawode (1994).Financial Sector Reforms, Macroeconomic Instability and the order of Economic Integration: Evidence from Nigeria. AERC Bi-annual Workshop, Nairobi, May.
Koeva, P. (2003).The Performance of Indian Banks During Financial Liberalization. IMF Working Paper WP/03/150. Lovell, C.A.K. (1993).Production frontiers and productive Efficiency. Measurement of Productive Efficiency, Fried Harold, C.A.K. Lovell, and S.S. Schmidt (eds), Oxford University Press, London.
Mckinnon, R. (1973). Money and Capital in Economic Development.Washington DC, Brooklyn’s Institution. Mester, L. J. (1987).A multiproduction Cost study of Savings and Loans.Journal of Finance, 42, June.
Nyong, M.O. (2005). Management Science: An Operations Research - Emphasis in Economics and Business.Clear Lines Publications, Calabar.
Obafemi, F. N.(2012).The Technical Efficiency of Nigerian Banks. Asian Economic and Financial Review, Vol.2, No. 2. Pp. 407-420.
Obute, C. O. (1987).Financial Distortions in the Nigerian Economy.Paper presented at the 1987 Annual Conference of the Nigerian Economic Society, (NES), May, Calabar.
Onwioduokit, E. A. and P. A. Adamu (2005). Financial Liberalization in Nigeria: An Assessment of Relative Impact on the Economy. NES Annual Conference, Lagos.
91
Oyaromade, R. (2005). Financial Sector Reform and Financial Savings in Nigeria. NES Annual Conference, Lagos. Shaw, E. (1973). Financial Deepening in Economic Development. New York, Oxford University Press.
Sherman, H.D. and F. Gold (1985).Branch Bank Operating Efficiency: Evaluation with Data Envelopment Analysis.
Journal of Banking and Finance, vol. 9, no. 20, June: 297 – 315.
Wheelock, D. and P. Wilson (1999).Technical Progress, Inefficiency and Productivity Change in U.S. Banking, 1984 – 1993. Journal of Money, Credit and Banking (May).
Zaim, O. (1995).The Effect of Financial Liberalization on the Efficiency of Turkish Commercial Banks. Applied Financial Economics, 5, 275 - 64.
Ziorklui, S.Q. (2001).The Impact of Financial Sector Reform on Bank Efficiency and Financial Deepening for Savings Mobilization in Ghana. African Economic Policy Discussion Paper, no. 81.