econ
stor
www.econstor.eu
Der Open-Access-Publikationsserver der ZBW – Leibniz-Informationszentrum WirtschaftThe Open Access Publication Server of the ZBW – Leibniz Information Centre for Economics
Nutzungsbedingungen:
Die ZBW räumt Ihnen als Nutzerin/Nutzer das unentgeltliche, räumlich unbeschränkte und zeitlich auf die Dauer des Schutzrechts beschränkte einfache Recht ein, das ausgewählte Werk im Rahmen der unter
→ http://www.econstor.eu/dspace/Nutzungsbedingungen nachzulesenden vollständigen Nutzungsbedingungen zu vervielfältigen, mit denen die Nutzerin/der Nutzer sich durch die erste Nutzung einverstanden erklärt.
Terms of use:
The ZBW grants you, the user, the non-exclusive right to use the selected work free of charge, territorially unrestricted and within the time limit of the term of the property rights according to the terms specified at
→ http://www.econstor.eu/dspace/Nutzungsbedingungen By the first use of the selected work the user agrees and declares to comply with these terms of use.
zbw
Leibniz-Informationszentrum Wirtschaft Frey, Stefan; Sandås, PatrikWorking Paper
The impact of iceberg orders in limit
order books
CFR working paper, No. 09-06
Provided in cooperation with:
Universität zu Köln
Suggested citation: Frey, Stefan; Sandås, Patrik (2009) : The impact of iceberg orders in limit order books, CFR working paper, No. 09-06, http://hdl.handle.net/10419/41392
CFR-Working Paper NO. 09-06
The Impact of
Iceberg Orders
in Limit Order Books
The Impact of Iceberg Orders in Limit Order Books
∗
Stefan Frey
†Patrik Sand˚
as
‡Current Draft: May 17, 2009
First Draft: September 2007
∗We thank Mark Van Achter, Bruno Biais, Burton Hollifield, Uday Rajan, Gideon Saar, Christer
Wennerberg, and Gunther Wuyts and seminar participants at the 2009 AFA meetings, the 4th Annual Central Bank Workshop on the Microstructure of Financial Markets, Center for Financial Research, CFTC, Nasdaq OMX, NBER Market Microstructure Meetings, the Center for Financial Studies’ Conference on the Industrial Organization of Securities Markets, the Oxford-Man Institute, University of Bonn, and the Society for Financial Econometrics’s Inaugural Conference for many helpful suggestions, the German Stock Exchange for providing access to the Xetra order book data and Uwe Schweickert for his help with the order book reconstruction. Frey gratefully acknowledges financial support from the Deutsche Forschungsgemeinschaft, and Sand˚as gratefully acknowledges financial support from the McIntire School of Commerce and the Institute for Financial Research (SIFR).
†University of T¨ubingen and Center for Financial Research,
stefan.frey@uni-tuebingen.de ‡University of Virginia, McIntire School of Commerce,
Abstract
We examine the impact of iceberg orders on the price and order flow dynamics in limit order books. Iceberg orders allow traders to simultaneously hide a large portion of their order size and signal their interest in trading to the market. We show that when the market learns about iceberg orders they tend to strongly attract market orders consistent with iceberg orders facilitating the search for latent liquidity. The greater the fraction of an iceberg order that is executed the smaller its price impact consistent with liquidity rather than informed trading. The presence of iceberg orders is associated with increased trading consistent with a positive liquidity externality, but the reduced order book transparency associated with iceberg orders also creates an adverse selection cost for limit orders that may partly offset any gains.
Keywords: Hidden Liquidity; Iceberg Orders; Limit Order Markets; Transparency;
A trader seeking to execute a large trade faces the problem that signalling his trading intentions to the market can both help and hurt the effective execution of his trade. A signal may help attract counterparties to reduce the time it takes to complete the trade and the trading cost. On the other hand, it may also attract opportunistic traders who make the completion less likely or more costly. Traders’ solutions may include following dynamic order submission strategies or trading off the exchange because such strategies limit the amount of information that is revealed about their trading intentions. Many exchanges have offered their own solution by adopting a particular order type known as an iceberg order. We study the use of iceberg orders and their impact on price and order flow dynamics in limit order books. We find evidence that supports the view that iceberg orders allow traders to advertise their trading intentions and attract counterparties while limiting the expected price impact of their trades. Our evidence is consistent with iceberg orders attracting market orders that may otherwise have stayed on the sidelines. On the other hand, we also show that some of these gains come at the expense of limit orders who suffer an adverse selection cost due to the reduced order book transparency.
A trader submitting an iceberg order specifies a price, a total order size, and a peak(size) which is smaller than the total size. Initially only the peak is displayed in the order book and the rest of the order remains hidden. When the first peak has been fully executed, another peak is automatically displayed in the order book, and the hidden part is reduced by the corresponding number of shares.
Our understanding of the rationale for submitting iceberg orders and the desirability of market designs that allow such orders is still incomplete. The iceberg orders have a direct effect on order books, but, perhaps more interesting, is the indirect effect that they are likely to have on the strategic behavior of other market participants. To what extent can market participants detect the presence and predict the amount of hidden volume? If they can then what is the rationale for submitting iceberg orders? Are iceberg submitters motivated
primarily by liquidity or information? What is the impact of iceberg orders on liquidity suppliers who use limit orders? We address these questions using a sample from the German Stock Exchange’s Xetra platform that includes detailed information on iceberg orders.
In order to address these questions we need some way to approximate the information that market participants have about the existence and size of potential iceberg orders. The immediate automatic display of a new peak after the currently displayed peak is executed creates a distinct pattern in the order book updates that is observable to any market par-ticipant who monitors the order book closely. A market parpar-ticipant who detects an iceberg order cannot determine the iceberg order’s size although its peak size may provide a signal. But as peaks are executed and new ones are displayed the participant can form more precise forecasts of the order’s original size. Rather than disclose the information about the order size right away the iceberg order sequentially reveals more information as peaks are executed. Building on these observations, we develop an algorithm for detecting iceberg orders that uses publicly available information on the order book and price dynamics. Conditional on a signal of detection, we use the observed peak size and the number of executed peaks to dynamically predict the hidden volume. We combine the detection algorithm’s signals of icebergs with our actual iceberg observations to isolate the iceberg order’s impact on the behavior of market participants from other factors that may influence the propensity to submit iceberg orders. Our sample exhibits a lot of variation in the peak sizes, the number of submitted peaks, and the number of executed peaks which implies that our methodology generates independent variation in the executed iceberg volume and the predicted hidden volume.
We are interested in the price impact of iceberg orders because they tend to be much larger than regular limit orders and hence they are likely to move prices for either liquidity or information reasons. Yet, several studies conclude that iceberg order have little price impact. We show that iceberg orders have a price impact that is increasing in their order size. But the
observed price impact of an iceberg order of a given size depends critically on the fraction of the iceberg order that is eventually executed. Together this evidence supports the liquidity-based explanation. If the primary driver was information we would, on average, expect to observe a price movement in the direction of the iceberg orders regardless of how much of it was executed. Instead the observed pattern supports the view that it is the initially unknown latent liquidity demand, which eventually is discovered, that together with the iceberg order determine the price impact.
We examine how iceberg orders influence the order flow to better understand the potential dual objectives of hiding and signalling. We show that the detection status of an iceberg order, the predicted hidden volume, and the amount of iceberg volume already executed influence the likelihood and size of market orders. We find that detected iceberg orders are more likely to attract market orders that undetected iceberg orders; that the market order size is increasing in the iceberg order’s size; and that the probability of additional market orders hitting the iceberg order is increasing in the iceberg volume that has already been executed.
Given that the iceberg orders appear to allow some traders to more effectively execute their transactions it is natural to ask if the benefit to this group of traders comes at the expense of some other traders. If we focus strictly on the trade executions then trading is a zero-sum game with the profits to liquidity suppliers corresponding to the transaction costs paid by the liquidity demanders. We measure the profits earned by liquidity suppliers using either iceberg or limit orders to assess the net effect for order books with iceberg orders. Our results show that iceberg orders are more profitable when they are either undetected or when the market underestimates their true size. This is consistent with the strategic advantage of iceberg orders coming from the submitter’s ability to control the amount of information reveled. In aggregate, limit orders earn a profit in order books with no iceberg orders but suffer a loss in order books with iceberg orders. The losses partly stem from the fact that
an iceberg order has a price impact which will, on average, cause limit orders on the wrong side to suffer losses. In addition, there is a ‘crowding out’ effect in that iceberg orders are large and effectively drive down the execution probability for limit orders on the ‘right side’ of the order book but behind the iceberg order.
A number of empirical studies including Boni and Leach (2004), Degryse (1999), Flem-ing and Mizrach (2008), Labys (2001), Pardo and Pascual (2007), and Tuttle (2006) docu-ment widespread use of iceberg orders or closely related order types such as reserve orders. Other studies including Aitken, Berkman, and Mak (2001), Harris (1996), Bessembinder, Panayides, and Venkataraman (2009) study the decision to submit iceberg orders. Theoreti-cal treatments of iceberg orders include Buti and Rindi (2008), Esser and M¨onch (2007) and Moinas (2007). The studies most closely related to ours are De Winne and D‘Hondt (2007) and Bessembinder, Panayides, and Venkataraman (2009). Our approach to the iceberg order detection builds on their work and extends it by incorporating both the peak size and the number of executed peaks. Bessembinder, Panayides, and Venkataraman (2009) apply the implementation shortfall methodology to assess the costs and benefits of submitting iceberg orders. We focus instead on the impact of the iceberg orders on the behavior of other market participants and their payoffs. Our methodology allow us to extend the analysis of De Winne and D‘Hondt (2007) who do not use the peak size, the number of executed peaks, nor control for variables the may influence the propensity to submit iceberg orders.
Our evidence on the information content of the iceberg orders for future mid-quotes adds to the growing literature that investigates the information content of the limit order book. Cao, Hansch, and Wang (2009) find that future prices to some extent can be predicted based onvisible information in the order book and an experimental study by Bloomfield, O’Hara, and Saar (2005) shows that informed traders may often use limit orders providing a rational for an informative limit order book. Our evidence shows that other order book information including the hidden volume from iceberg orders and the history of order book updates also
helps predict both future prices and quantities.
In the next section we develop our testable hypotheses. In Section 2 we present our sample and our methodology. In Section 3 we present our main empirical results for the price impact, the market order flow, and the order book profits. Section 4 provides some further interpretation of our results. Section 5 concludes. In the Appendix we provide more details on the computation of profits to liquidity suppliers, the detection algorithm, and estimation procedures.
1
Testable Hypotheses
In this section we develop and present our hypotheses for the iceberg orders impact on prices, the market order flow, and the order book profits of liquidity suppliers. An iceberg order specifies a price, a total size, and a peak size. The peak size is the maximum displayed volume. When a trader submits an iceberg order, the first peak size is displayed in the order book. At that time, the hidden volume of the order is equal to the order’s total size minus its peak size. When the first peak size has been fully executed, another peak (size) is automatically displayed in the order book, and the hidden volume is reduced by the corresponding number of shares. The trading system automatically displays new peaks after additional executions until the final peak is displayed or the submitter cancels the iceberg order.
Initially an iceberg order is indistinguishable from a limit order with the same price and size. But over time the execution of displayed peaks and the display of new peaks allow market participants to learn about its existence and predict its size. In addition, any systematic relationship between the peak size, the number of peaks, and the iceberg order’s total size imply that market participants can improve their forecasts of the iceberg order’s size over time.
Iceberg orders are often justified and promoted as an order type that facilitates the execution of large orders with minimal price impact, a property that should appeal to large liquidity traders. On the other hand, the more successful iceberg orders are in reducing the price impact for large orders the more they should appeal to informed traders. The existing evidence on the price impact of iceberg orders is mixed. A challenge in addressing the price impact question is that the iceberg order’s price is fixed for each peak causing the short-term impact to be zero regardless of the order’s ultimate impact. We focus on the price impact measured over a horizon that is longer than the duration of the iceberg order to overcome this challenge. The fixed iceberg order price also means that the full impact of public information, which is revealed while the iceberg order is outstanding, may only be reflected in prices with a delay.
The ability to hide a large portion of the order size may make iceberg orders appealing to informed traders. We would therefore expect iceberg orders to have a price impact and we would expect the price impact to be increasing in the iceberg order’s size. Iceberg orders may also have a price impact if they are primarily submitted by large liquidity traders. The difference is that if the iceberg orders are primarily submitted by liquidity traders then we would expect the net price impact to depend on the latent demand for liquidity. Consider a buy iceberg order of a given size. If the order is primarily submitted by liquidity traders, we would expect the price impact to depend on the latent liquidity demand; lots of interest in selling may imply that the net impact of the buy iceberg order is small, little interest in selling produces a greater price impact. In contrast, if positive information is the reason for submitting the buy iceberg order, we would expect a higher future mid-quote regardless of the market order flow. To distinguish between these scenarios we consider the following two hypotheses:
Hypothesis 1: Price Impact The future mid-quote is increasing in the expected and actual size of a buy iceberg order and decreasing in the expected and actual size of a sell
iceberg order.
Hypothesis 2: Price Impact-Liquidity. For a given expected or actual size of an iceberg order, the future mid-quote is decreasing in the executed volume of a buy iceberg order and increasing in the executed volume of a sell iceberg order.
The expected fraction of the iceberg order that executes depends on the interaction be-tween the iceberg order and the market order flow. A challenge in sorting out the interaction is that the iceberg order submissions may be opportunistically timed. For example, a trader may submit a buy iceberg order when the probability of a sell market order is high or the expected size of sell market orders is large or some combination of the two.1 On the other
hand, since the iceberg order can be detected by liquidity demanders and its peak size may act as a signal about its size, it is also possible that the iceberg order itself induces a change in the market order flow. For example, some liquidity demanders may wait until they detect an iceberg order on the other side of the market because they rather trade when there is greater depth on the other side of the market. The timing argument leads to the following hypothesis:
Hypothesis 3: Timing. An iceberg order on the bid side is associated with a greater likelihood of sell market orders and larger sell market orders, holding other things equal, with the corresponding prediction for iceberg orders on the ask side and buy market orders.
By timing the iceberg order submission the submitter increases the likelihood of filling the order. It also possible that potential counterparties react to signal of an iceberg order and perhaps react more strongly depending on the size of the iceberg order. The fact that iceberg orders are detectable makes signalling possible, and as long as there is some latent liquidity demand, there are potential counterparties who may react to the signal. The fact that the iceberg submitter could have stayed out of the order book and either submitted a
1The results on the order aggressiveness in De Winne and D‘Hondt (2007) illustrate this point. They find that a signal of an iceberg order increases the order aggressiveness, but the results are also consistent with the reverse explanation that the iceberg order was submitted in anticipation of greater order aggressiveness.
series of smaller limit orders or waited for suitable limit order to appear in the order book implies that she chose to follow a strategy that potentially reveals more information than some alternative strategies. Regardless of the intent we may have an effect that can be thought of as a signaling or advertising effect of the iceberg order. This leads us to our fourth hypothesis:
Hypothesis 4: Advertising Effect. A detected iceberg order on the bid side increases the likelihood of a sell market order and increases the expected size of sell market orders. Analogous predictions apply to the ask side of the order book and buy market orders.
Despite the fact that market participants may detect and react to iceberg orders, they clearly have less information and hence are subject to potential adverse selection. Liquidity demanders are exposed to the risk of trading with an iceberg order that turns out to be larger than expected. Conversely, liquidity demanders fare better if they trade with an iceberg order that turned out to be smaller than expected. So here the active side of the trade is exposed to an adverse selection risk that is similar to the one faced by the passive side in the Glosten (1994) model.
Liquidity suppliers who submit limit orders may suffer losses for the following reason. Any limit order behind the iceberg order in the order queue is very unlikely to be executed whereas limit orders on the other side are relatively more likely to be executed. If the iceberg order tends to move the prices, this means that limit orders are more likely to receive more unfavorable executions and less likely to received favorable executions. Like the risk for liquidity demanders this risk is more severe when the iceberg order is a surprise or when it is turns out to be larger than anticipated.
Hypothesis 5: Adverse Selection. Iceberg orders create an adverse selection risk for both liquidity demanders and suppliers. The risk is more severe when the iceberg order has not been detected or when it is larger than expected based on available information.
2
Our Sample and Methodology
2.1
Our Sample
Our sample is from Deutsche B¨orse’s electronic trading platform Xetra. It covers all thirty stocks in the DAX-30 German blue chip index for the period January 2nd to March 31st, 2004. On Xetra, traders can, in addition to market and limit orders, submit iceberg orders. The order records identify iceberg orders so that we are able to reconstruct snapshots of both the displayed and hidden order books. We restrict our sample to continuous trading only. We present more details on the sample reconstruction in Appendix A4.
In the order book, an order is given priority according to price, display condition, and time. A sell order at a lower price has priority relative to any sell orders at higher prices, regardless of the order’s time of submission or display condition. At the same price level, a displayed order has priority relative to any hidden orders regardless of the order’s time of submission. Among displayed orders, an order submitted earlier has priority relative to any orders submitted later. When an iceberg order’s displayed part is fully executed and the next peak converts from hidden to displayed status the newly displayed peak also receives a new time stamp which determines its time priority.
2.1.1 Iceberg Submissions
For the purpose of brevity we sort the stocks into three categories—large, medium, and small—based on trading activity and report all results for these three categories only. The large and medium categories have eight and seven stocks, respectively, with the remain-ing fifteen stocks beremain-ing assigned to the small category. Table A1 in the appendix reports descriptive statistics for all thirty sample stocks.
Table I reports cross-sectional descriptive statistics for iceberg and limits orders with cross-sectional standard deviations in parentheses. Panel A shows that the iceberg orders’
share of all non-marketable orders submitted ranges from 7 to 11% with an overall average of 9%. Iceberg orders represent a greater fraction of shares executed with the corresponding
percentages ranging from 15 to 20% with an overall average of 16%. Panel B reports the Table I approx-imately here. median distance between the order price and the best quote for iceberg orders and limit
orders. The differences between iceberg and limit orders in the order price dimension appear to be small and unsystematic.
Panel C reports averages of the iceberg order’s total size, peak size, the number of submitted peaks, and the number of executed peaks of iceberg orders whose first peak size was executed. The last row of the panel reports the average size of limit orders. Iceberg orders are on average 12 to 20 times larger than limit orders demonstrating that iceberg orders tend to be an order of magnitude larger than limit orders. Even the peak size is between 2.2 and 2.9 times larger, which further underscores the difference between iceberg orders and limit orders in order size.
The number of peaks is negatively correlated with the peak size since the product of their averages exceeds the average total size. We explore the relationship between peak size and the number of peaks in more detail below. The average number of executed peaks shows that conditional on the first peak being executed, on average, four new peaks will be displayed and approximately 80% of the executed shares originate from initially hidden volume for these orders.
Panel D reports statistics on the clustering of the total size, peak size, and the number of peaks. We report the percentage of all observations that are accounted for by the three most frequently observed values to illustrate the degree of clustering. The clustering is strongest for the peak size with 59% of all observed peak size values accounted for by the three most frequently observed values for a typical stock. The number of peaks is somewhat less clustered with a corresponding average frequency of 34%.
2.1.2 Iceberg Executions
Table II reports statistics on several dimensions of the iceberg execution. The first specifi-cation in Panel A is a regression of the realized profit for iceberg orders, with at least one executed peak, on the total order size, the executed volume, and the peak size. We normalize all variables so that the intercept captures the average realized spread for a typical iceberg
order. The realized profit is measured as the signed difference between the iceberg order’s Table II approx-imately here. price and the mid-quote 30 minutes after the iceberg’s last peak was executed. On average,
the per share realized profit is positive, and significantly different from zero, starting at 1.7 basis points for the large and increasing to 3.7 basis points for the small stock group.
The second specification includes both the total order size and the executed volume and this combination reveals an interesting regularity. Holding the executed volume constant, a larger iceberg order has a higher realized spread suggesting that the hidden size matters for the future mid-quote even though it may never be directly observed by market participants. The effect of the iceberg’s peak size is more mixed with many stocks having a negative coefficient albeit not always significantly different from zero. The importance of the order size is evidence that the ability to hide the order size creates a strategic advantage. Conversely, it explains why other market participants may expend resources trying to detect iceberg orders and predict their total size.
Prior to the execution of its first peak the iceberg order resembles a limit order. To take into account the possible difference between the first and subsequent peaks we estimate models for both the probability of execution for the first peak and the execution percentage conditional on the first peak being executed. Panel B and C report the marginal effects for the two execution statistics. The negative marginal effect of the peak size for the execution probability is consistent with a larger peak size encouraging undercutting and hence reducing the probability of execution. On the other hand, Panel C shows that, conditional on one peak being executed, a larger peak size increases the percentage executed. Once a peak has
been executed, the iceberg order is likely to have been detected and at that stage a larger peak size facilitates a greater execution percentage because each added peak represents a larger fraction of the total order and minimize the opportunities for limit orders to gain priority by matching the price of the iceberg order. Both of these effects are consistent with the assumptions made regarding the peak size in Esser and M¨onch (2007).
The distance to the best quote has, as expected, a large negative effect on the probability of execution, but conditional on an executed peak the initial distance to the best quote is no longer useful for predicting the percentage executed. The order size has a positive marginal effect for the probability of execution which is interesting since it is hidden. One interpretation is that traders submitting larger iceberg orders are more patient and therefore more likely to received at least one execution. The same variable has a negative marginal effect on the percentage executed, which is expected as, everything else equal, it is more difficult to fill a larger order.
2.2
Methodology
Our methodology consists of an algorithm for detecting iceberg orders and a model for pre-dicting the hidden volume. The goal is to approximate the market participants’ information set with respect to iceberg orders and hidden volume and to relate innovations in their in-formation set to subsequent price and order flow dynamics. We presents each part of our methodology in more detail below.
The detection algorithm solves a problem that is similar to the one solved by researchers with limit order book datasets that lack the complete information on iceberg orders. For example, Biais, Hillion, and Spatt (1995) apply a method to determine that one trade out of eight is partially executed against an iceberg order using only information available to anyone observing the order book. De Winne and D‘Hondt (2007) develop an algorithm similar to the one we use and apply to a dataset that includes iceberg order information.
Bessembinder, Panayides, and Venkataraman (2009) show for a related dataset how other publicly observed variables can be used to generate informative predictions about iceberg orders even before any executions have occurred. We extend this line of inquiry by exploiting both information from both detected and undetected iceberg orders in our analysis. There is no priori work that we are aware of that generates dynamic predictions for hidden volume.
2.2.1 Detecting Iceberg Orders
A detection algorithm is a set of rules for generating predictions of whether or not a given order book contains iceberg orders based on publicly available data. The basic idea is that if an order book contains an iceberg at the best quote then a trade that exhausts all the displayed depth at the best quote prompts an immediate addition of new depth equal to the iceberg order’s peak size. Following such an event the algorithm sets the indicator for an iceberg to one and based on the amount of added depth the algorithm will anticipate future depth changes for as long as the iceberg order remains in the order book. The algorithm remembers the indicator values for multiple prices so if the current best quote, which has a detected iceberg, is undercut but later becomes the best quote again the algorithm assumes that the iceberg order is still there until an anticipated update to the order book depth fails to occur. We provide a detailed example that illustrates how our algorithm works in Appendix A3.
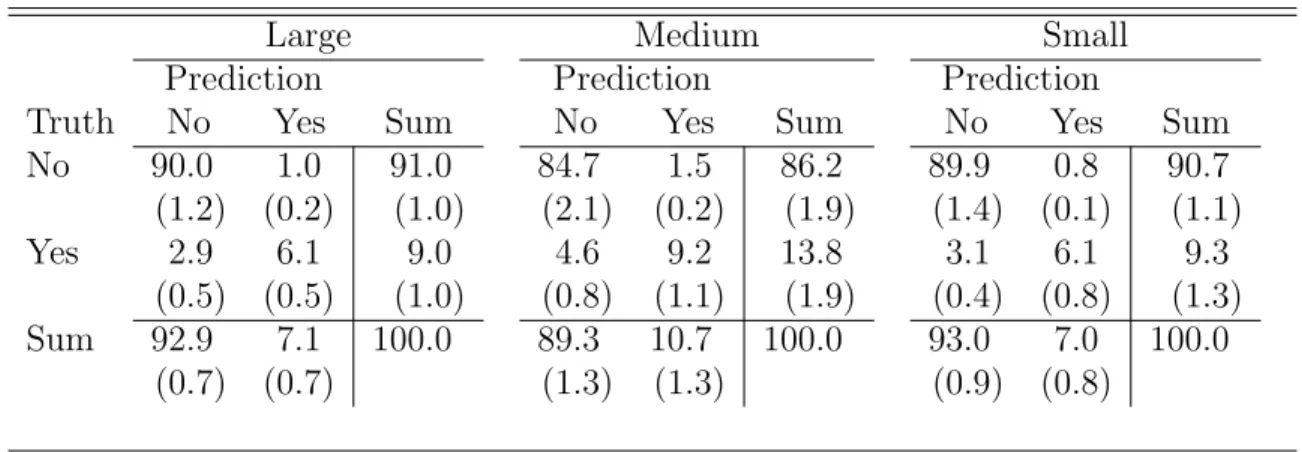
Table III reports the average frequencies of the iceberg signals generated by the
algo-rithm compared to the true iceberg states. Similar to our applications later, it only reports Table III approx-imately here. results for the best quote only. The frequencies reported in the table are the cross-sectional
averages with cross-sectional standard errors reported in parentheses. The diagonal entries are the percentages of correct predictions; for 85 to 90% of the observations the algorithm correctly detects no iceberg order, and for 6 to 9% of the observations the algorithm correctly detects an iceberg. The top right entry in each panel is the percentage of observations for
which the algorithm falsely detects an iceberg. These instances are relatively rare with the average frequency being around 1%. The bottom left entry in each panel is the percentage of observations for which the algorithm fails to detect an iceberg order. Between 3 and 5% of the observations fall in this category. The algorithm’s relative weakness is the instances of iceberg orders that it fails to detect. These percentages suggest that iceberg orders may succeed in remaining hidden, albeit only for a limited amount of time.
The frequencies reported in Table III are for the ask side only. The results for the bid side are very similar. Furthermore, the correlation between icebergs on the bid and the ask side is low so the frequency of an iceberg signal for at least one side of the book is approximately twice the percentages in the bottom right of each panel.
It is difficult to determine how closely the predictions from our algorithm approximates the market participants’ information about iceberg orders. Conversations with market par-ticipants suggest that it is reasonable to assume that active parpar-ticipants are able to discern this type of information from observing the order book dynamics or by using their own al-gorithms. It may also be the case that some market participants can generate even more accurate predictions using other signals.
2.2.2 Predicting Hidden Volume
Figure 1 shows a mosaic plot of the peak size and the total size for one representative stock (ticker: DPW). The widths of the boxes is proportional to the frequencies of the different peak size categories. Similarly the height of the resulting boxes is proportional to the frequencies
of different total sizes given a peak size category. The shading of the boxes and the plus and Figure 1 approx-imately here. minus signs indicate the strength of the deviation from the null hypothesis of independence.
The plot shows that the peak size and the total size are positively correlated although the total size is non-linear in the peak size and exhibits some discontinuities. For example, for both the 1K and 2K peak size category, the total size that is unusually frequent is 10K. On
the other hand, if we compare the smallest and the largest category of peak sizes, 1K versus 10K, we see that the total size categories do not overlap much with most of the distribution shifted to either 20K or 50K for the largest peak sizes. We observe some cross-sectional variation but all stocks exhibit both a general positive correlation between peak size and total size with some deviations that may reflect clustering on certain round numbers or a deliberate choice by the iceberg order submitters.
Market participants do not observe all the information in Figure 1, but they can identify the peak size and track the number of peaks executed for detected iceberg orders. We assume that market participants form rational expectations about the hidden volume based
on this information. Table IV reports regression results for predicting the hidden volume Table IV approx-imately here. at the best quote, conditional on an iceberg signal, using the peak size and the number of
executed peaks. We report average parameter estimates and standard errors for a linear and a piecewise-linear specification. In both specifications the hidden volume and the peak size are normalized by the average peak size for each stock.
Regardless of the specification the predicted hidden volume is positive correlated with the peak size of the detected iceberg, and each executed peak reduces the predicted hidden
volume by an amount that is smaller than the average peak size. Figure 2 approx-imately here. Figure 2 shows the observed average hidden volume as a function of the number of
executed peaks for one of the sample stocks, DPW, and the four most commonly observed peak size categories. The average fitted values for the piecewise linear specification is plotted with a solid line in the graph. The hidden size has been normalized by the average peak size for each stock. The relationship between hidden volume and the number of executed peaks is, in general, negative, as expected, with a slope that is less than one; for each executed peak the expected hidden volume declines by less than one peak. We observe distinct jumps for all three stocks between four and five and between nine and ten executed peaks.
3
Empirical Results
We start by presenting our results for the impact of iceberg orders on future prices and the market order flow. We then present our results for the iceberg orders’ impact on order book profits.
3.1
The Impact on Prices
Table V approx-imately here. Table V reports results for regressions with the mid-quote change as the dependent variable
and iceberg and hidden volume among the independent variables. We measure the mid-quote change over a thirty trade horizon that starts from the current trade. The first six rows of the table (above the dashed line) report parameter estimates with standard errors that capture a standard price impact of market orders which includes an intercept, a fixed parameter on the sign of the trade, and a trade-size dependent parameter. The parameter estimates for the fixed parameter are between two and three basis points and the parameter estimates for the trade-size dependent parameter are between one-half and one basis points. In specification A we add two iceberg related variables to determine to what extent iceberg orders have any impact. The first is a signed indicator for a detected iceberg order; the indicator is positive for a buy iceberg and negative for a sell iceberg order. A positive coefficient on the indicator implies that the mid-quote tends to shift in the direction of the iceberg order. The second iceberg variable interacts the signed market order size with an unsigned indicator for a detected iceberg. The coefficient on this variable captures any differential price impact of market order size with iceberg orders in the book.
The parameter estimates on the signed iceberg indicator are positive and significantly different from zero for all three categories implying that, holding other things equal, the mid-quote tends to increase over the next 30 trades, if there is an iceberg at the bid side at timet
indicator interacted with the signed market order size is negative for all categories and ranges from -0.2 to -0.3 basis points implying that the per unit price impact is approximately 30% smaller when there is an iceberg order in the order book; both the future mid-quote and the per unit price impact is different for order books with detected iceberg orders. Overall, the evidence suggests that the price impact is both statistically and economically different when iceberg orders have been detected.
In specification B we add the executed iceberg volume and predicted hidden volume. The executed iceberg volume is defined as the sum of all shares executed that originated from the iceberg order in the current iceberg sequence. The predicted hidden volume is obtained from the fitted values of the piecewise-linear specification in section 2.2.2. Both the executed iceberg volume and the predicted hidden volume are signed and normalized by the average market order size.
The positive parameters on the predicted hidden volume imply that, holding other things equal, greater expected hidden volume on the bid side is associated with a higher future price. The mean predicted hidden volume across the categories is between 7 and 10 units and produce a price impact that range from one to three basis points. A one standard deviation shock to the predicted hidden volume—which is between 3 and 5 units—translates into a change of between 0.5 to 1.5 basis points.
The estimated parameters on the executed iceberg volume are negative and range from -0.07 to -0.16 basis points. Across the three categories the mean value of the executed volume is between 7 and 9 units which translates into an average adjustment of between 0.5 to -1.4 basis points. A one standard deviation shock to the executed iceberg volume—which is between 7 and 10 units—increase the magnitude of the adjustment to between -1.3 and -3 basis points. The evidence of the price impact being increasing in the order size is consistent with Hypothesis 1. The fact that the net price impact decreases, holding other things equal, in the executed iceberg volume supports the liquidity-based explanation of Hypothesis 2.
Specification C adds the ‘surprise’ in the hidden volume defined as the difference between the actual hidden volume and the predicted hidden volume. If market participants under-estimate the amount of hidden volume, we expect the difference to eventually be reflected in prices either by market participants learning the truth as more peaks are displayed or indirectly through future order flow. In either case we would expect a greater than expected hidden volume on the bid side to predict a higher mid-quote and vice versa according to Hypothesis 1. The estimated parameter on the actual minus predicted hidden volume is be-tween 0.15 and 0.36 basis points per unit and provides additional support for the hypothesis. A shock equal to one standard deviation of the surprise hidden volume, which has a mean of zero, is approximately equal to 8 units and that shock translates into an expected mid-quote adjustment of one to three basis points.
Specification D replaces the predicted hidden volume with the actual hidden volume to determine the importance of measurement errors from the prediction exercise. As expected the increased precision raises the estimated parameters on the actual hidden volume com-pared to those of the predicted hidden volume and reduces the parameters on the signed iceberg indicator. The estimated parameters on executed volume are nearly unchanged.
Overall, the results show that iceberg orders have an impact on prices, but the magnitude of the impact depends critically on the realization of the net liquidity demand. If a large fraction of the iceberg order is executed, it implies a smaller net liquidity demand shock—the demand from the iceberg was largely met by latent demand on the other side—resulting in a smaller price change. On the other hand, if there are few executions relative to the size of the iceberg order then we have a large net liquidity demand shock which generates a larger price changes which is increasing in the iceberg order’s size. The fact that the impact of an iceberg order, holding its size constant, depends on the order flow realization suggests that the impact is more about the discovery of the net balance of liquidity demand than about trading on private information. If the primary reason for submitting the iceberg order was
private information we would, on average, expect a price change that increases in its size but that is independent of the order flow realization.
3.2
The Impact on Market Order Flow
Table VI approx-imately here. Table VI reports results for the market order size regressed on four indicators for detected
and not detected iceberg orders, visible volume, executed iceberg volume, and predicted hidden volume. For all variables we distinguish between the effect on the side of the order book that is hit by the market order and the side that is not hit.
The estimated coefficients for the iceberg indicators are all positive and significantly dif-ferent from zero implying that market order size and iceberg orders are positively correlated. The estimated parameters for market orders hitting detected icebergs are approximately 0.4 for specification A implying that the average market order size increases by approximately 40% when an iceberg has been detected iceberg. But, the magnitude of the parameter esti-mates for the corresponding not detected iceberg indicators are also positive and often of the same order of magnitude in line with the timing explanation of Hypothesis 3. The positive and significant albeit smaller coefficients for not hit indicators lend further support to this interpretation.
Specification B adds the visible order book volume which we normalize to have a mean of zero and a unit standard deviation. The estimated parameters on the visible volume on the hit side are between 0.3 and 0.4 implying that a one standard deviation increase in the visible volume increases the average market order size by approximately 30 to 40%. The effect is weaker for the not hit side of the order book with parameters between -0.02 and 0.05. In this specification the parameter estimates for the hit iceberg indicators are all smaller in magnitude and the change is greater for the not detected iceberg orders. Despite this effect the hit side effects for the indicators remain around 0.25 suggesting that the greater market order sizes are not simply a by-product of greater visible order book volume.
Specification C adds the executed iceberg and the predicted hidden volume. The param-eter estimates on the executed volume on the hit side are positive and significantly different from zero with values approximately equal to 0.05. The corresponding parameters for the not hit side are negative. The positive hit side parameters are indicative of a feedback ef-fect by which a greater volume executed against the iceberg order attracts larger market orders. The predicted hidden volume also has positive parameter estimates with larger and significant estimates for the hit side and positive but smaller estimates for the other side. The positive and greater hit side parameter estimates are consistent with larger predicted hidden volume attracting larger market orders. Overall, the results for specification C are
consistent with an advertising effect of iceberg orders (Hypothesis 4). Table VII approx-imately here. Table VII reports results for a logit model of the probability of a buy market order
condi-tional on iceberg indicators, visible volume, executed iceberg and predicted hidden volume. The reported figures are average marginal effects with standard errors in parentheses. In specification A we include indicators for detected and undetected icebergs on the bid and ask sides of the order book. The estimated marginal effects are between -0.17 and -0.19 for the bid side and 0.17 to 0.19 for the ask side implying that with an iceberg on the ask side of the order book we observe a shift in the probability of buy market order from 0.5 to approximately 0.7 with a corresponding effect for the other side. The marginal effects for the undetected iceberg indicators have the same sign but are less than one-third as large as the corresponding marginal effects for the detected iceberg orders. The larger marginal effect of the detected iceberg suggests that liquidity demanders are drawn to the iceberg order consistent with a advertising effect of Hypothesis 4.
In specification B we add the visible volume for the ask and bid sides of the order book. The visible ask volume has a negative marginal effect of approximately -0.04 which counteracts the positive marginal effect of a detected iceberg on the ask side. Furthermore, the average visible volume is slightly positive when an iceberg is detected implying that a
visible ask volume that is one standard deviation above the mean value for detected iceberg states on the ask side reduces the probability of a buy market order from 0.71 to 0.55. This negative effect is consistent with existing evidence of market versus limit order submissions (see, e.g., Biais, Hillion, and Spatt (1995). It also means that the iceberg submitter who affects the visible volume by his choice of peak size faces a trade-off.
In specification C we drop the undetected iceberg order and add the executed iceberg and predicted hidden volume. We normalize the executed and predicted volumes to have a mean of zero and standard deviation of one, conditional on a value of one for the iceberg detection indicator. The marginal effect of executed ask volume is positive implying that, holding other things equal, the probability of a buy market order increases as the volume executed against the iceberg volume. Like the corresponding results above for the market order size this is in line with a feedback effect. Together, this is evidence of the iceberg order itself having an impact on the market order flow that is distinct from any timing effect.
The trading game is a zero-sum game with the profits or losses of liquidity suppliers with iceberg or limit orders jointly determining the transaction costs for liquidity demanders. To determine what the joint effects are of the above results on the price impact and the market order flow we examine the order book profits next.
3.3
The Impact on Order Book Profits
Table VIII approx-imately here. Table VIII reports the average estimates of the expected order book profits. The expected
order book profits are determined by the conditional probability of an order being executed multiplied by the signed difference between the order price and the expected mid-quote conditional on execution. We prefer to focus on the expected rather than the realized order book profits because we are interested in how the profits are split between different types of orders or traders something that is difficult to disentangle from the ex post figures. In order to compute the order book profits we use the price impact function that we estimated above
(Table V), the market order size distribution (Table VI), and the probability of a buy market order (Table VII). We assume further that the market order size distribution is exponential with a conditional mean order size determined by as reported in Table VI. Appendix A2 provides more details on our procedure for computing the profits.
The overall average order book profits is between 0.5 and 1 basis points. When the books are split based on whether or not there is an iceberg order we observe greater profits without iceberg orders and smaller and sometimes negative profits with iceberg orders. Lower order book profits imply gains for liquidity demanders, which combined with the fact that we observe larger market orders, suggest that liquidity demanders overall fare better when
there are iceberg orders in the order book. Table IX approx-imately here. Table IX reports the breakdown of the order book profit estimates for order books with
iceberg orders. Panel A reports the estimates for books with detected iceberg orders split by the order type, iceberg order versus all limit orders, and for limit orders on the side of the iceberg order versus the opposite side. Theex anteprofits for iceberg order do not vary much across the detected and not detected cases. In contrast, the ex post profits are substantially greater for the not detected cases ranging from 0.5 to 1 basis points for the ex post case versus approximately zero for the detected cases.
The limit order profits are negative across the books with detected and undetected iceberg orders. But, if we split the limit orders whether they are on the same or opposite side of the iceberg order, we observe that limit orders that are on the side of the iceberg order generate positive profit both for detected and undetected iceberg orders. The greater expected profits for unanticipated iceberg orders, the negative profits for limit orders on the opposite side as
well as overall (ex post) provide evidence consistent with adverse selection (Hypothesis 5). Table X approx-imately here. Table X reports estimation results for regressions that relate the ex postexpected profits
accruing to different orders—iceberg orders, limit orders, and market orders—to information about the iceberg orders and the remaining hidden volume. We are interested in how the
order book profits are split between the iceberg submitters, the liquidity providers who use limit orders, and the liquidity demanders. Neither the executed iceberg volume nor the surprise hidden volume are exogenously given so these regressions are simply used to illustrate how the profits accruing to different types of orders vary across different types of outcomes without implying any causal relationship.
The right-hand side variables have been normalized to have a mean of zero and standard deviation of one so that the intercept captures the mean profits. For books with detected iceberg orders the profit for iceberg orders is approximately zero, so the negative profit for limit orders implies a gain (profit) for the market orders. In contrast, for order books with undetected iceberg orders the iceberg orders, on average, capture a profit of 0.5 to 1.1 basis points, and since market orders also capture a small profit, the limit orders suffer a loss of 0.5 to 1.7 basis points.
The profits for iceberg orders are increasing in both the predicted hidden volume and the surprise hidden volume. The effect of the surprise hidden volume is between 1.1 and 2.6 basis points for a one standard deviation shock to the surprise hidden volume providing evidence that iceberg order that are surprisingly large earn higher profits and, of course, vice versa for smaller than expected iceberg orders.
The limit order submitters earn lower or even negative profits from order books with iceberg orders. In contrast they earned positive profits in books without iceberg orders. In particular, limit orders are exposed to losses driven by two factors. First, limit orders on the opposite side of iceberg orders suffer losses because iceberg orders have price impact; the losses are more severe when iceberg orders are undetected. Second, limit orders on the same side of the book as the iceberg orders would earn profits but execution is only likely if they match the iceberg order’s price otherwise they are too far back in the queue.
The overall results for market order submitters are mixed. The main exception is the small stock group for which the average estimated profits are positive and significant
re-gardless of whether the iceberg has been detected or not. In general, the profits accruing to market orders increase in the iceberg order size and in the amount of executed iceberg volume.
4
Interpretation
We interpret the evidence above as supporting the idea that iceberg orders have a price impact that depends on the net demand for liquidity. In submitting an iceberg order a trader balances the benefit of displaying more of her order size—the advertising effect—against the benefit of hiding more of it. Because it is the iceberg order’s most salient feature the latter effect has naturally received the most attention. For example, the theoretical models to date start from the assumption that iceberg orders will be used so as to hide as effectively as possible. The fact that the observed iceberg order peak sizes deviate significantly from the typical limit order sizes and our main results all suggest that the advertising or signaling aspects of the iceberg order may be equally important.
The rationale for using iceberg orders is that ex ante the large traders by definition has limited information about the latent demand. Submitting an iceberg order is effectively a way for the trader to search for latent liquidity. If latent demand is discovered, the trader ends up trading a larger fraction of the order at a price that may compare favorably to alternative strategies. If no or only limited latent demand is discovered, the trader ends up executing only a fraction of the order and needs to resubmit or follow an alternative strategy to complete the trade. But, the greater transaction costs in the latter case are simply a reflection of market conditions and in some sense the trader is no worse off having searched for the latent demand using the iceberg order.
The welfare properties of market designs with iceberg orders is obviously an important question. Although we cannot address that question directly our results shed some light
on the issues involved. The evidence of feedback effects with more executed iceberg volume attracting larger market orders and increasing the probability of market orders hitting the iceberg order are indicative of a potential positive externality of iceberg orders. On the other hand, other liquidity providers who submit limit orders do not fare well in order books with iceberg orders. They make up for that with higher profits in order books without iceberg orders but that means that it is hard to determine the net effect.
Our results have some implications for the way we think about the dynamic aspects of the iceberg strategy. In particular, the fixed price for each of the iceberg order’s peaks is intriguing in the light of the above results. Both our price impact and market order flow results show that there are distinct time patterns and these patterns remain in the order book profit results. One can think of the iceberg order submitter as a seller who sequentially auctions off multiple peaks at a fixed price. One part of the auction literature documents and studies a phenomenon that is known as the declining price anomaly in multi-unit sequential auctions (see, for example, Bernhardt and Scoones (1993)). The anomaly is that prices for identical items sold in later auctions tend to be lower than those sold in earlier auctions. In the case of iceberg orders the puzzle is that the prices are fixed for each ‘round’ or peak but because new information is revealed with the execution of each peak it would appear that the value is changing. The question then is under what assumptions is an iceberg order with a fixed price per peak the optimal type of iceberg order? For example, why not have an iceberg order that moves the price to buy down marginally after each executed peak? Or an iceberg order whose peak size increases dynamically after detection? And, if the fixed price is optimal, then what is the optimal strategy for liquidity demanders?
5
Conclusions
We examine the impact of iceberg orders on the price and order flow dynamics in limit order books. One of our main findings is that we find strong support for an advertising or signalling effect of iceberg orders. Part of the effect is an artifact of the iceberg order type—the fact that it is detectable—but part of it is under the control of the iceberg order submitter through her choice of peak size. An important outstanding question is how the optimal peak size is determined for a given total order size.
In principle, the order updates generated by an iceberg order can also be replicated using a dynamic order submission strategy. What determines the choice between these two seemingly equivalent strategies? Does the fact that the iceberg order is in the limit order book increase its effectiveness in terms of signalling?
Even if we abstract from the signalling, the iceberg order itself is a pre-packaged dynamic order submission strategy. Likewise, a market order submitter who trades against a detected iceberg order solves a special dynamic order submission problem since the iceberg order temporarily makes the order book perfectly resilient after each executed peak. Under what assumptions can we rationalize these types of strategies in existing dynamic models of optimal trading such as Bertsimas and Lo (1998), Huberman and Stanzl (2005), Obizhaeva and Wang (2006)?
Addressing these questions as well as determining the welfare properties of market design with iceberg orders are all important topics for future research.
References
Aitken, M. J., H. Berkman, and D. Mak, 2001, “The Use of Undisclosed Limit Orders on the Australian Stock Exchange,”Journal of Banking & Finance, 25(8), 1589–1603. Bernhardt, D., and D. Scoones, 1993, “A Note on Sequential Auctions,”American Economic
Review, 84, 653–657.
Bertsimas, D., and A. W. Lo, 1998, “Optimal Control of Execution Costs,” Journal of Financial Markets, 1, 1–50.
Bessembinder, H., M. Panayides, and K. Venkataraman, 2009, “Hidden Liquidity: An Anal-ysis of Order Exposure Strategies in Electronic Stock Markets,” forthcoming, Journal of Financial Economics.
Biais, B., P. Hillion, and C. Spatt, 1995, “An Empirical Anlaysis of the Limit Order Book and the Order Flow in the Paris Bourse,”Journal of Finance, 50, 1655–1689.
Bloomfield, R., M. O’Hara, and G. Saar, 2005, “The “make or take” decision in an electronic market: Evidence on the evolution of liquidity,”Journal of Financial Economics, 75, 165– 199.
Boni, L., and C. Leach, 2004, “Expanadable Limit Order Markets,” Journal of Financial Markets, 7, 145–185.
Buti, S., and B. Rindi, 2008, “Hidden Orders and Optimal Order Submission Strategies in a Dynamic Limit Order Market,” working paper, University of Toronto.
Cao, C., O. Hansch, and X. Wang, 2009, “The Information Content of an Open Limit-Order Book,” Journal of Futures Markets, 29, 16–41.
De Winne, R., and C. D‘Hondt, 2007, “Hide-and-Seek in the Market: Placing and Detecting Hidden Orders,” Review of Finance, 11, 663–692.
Degryse, H., 1999, “The Total Cost of Trading Belgian Shares: Brussels versus London,”
Journal of Banking and Finance, 23, 1331–1355.
Esser, A., and B. M¨onch, 2007, “The Navigation of an Iceberg: The Optimal Use of Hidden Orders,” Finance Research Letters, 4, 68–81.
Fleming, M. J., and B. Mizrach, 2008, “The Microstructure of a U.S. Treasury ECN: The BrokerTec Platform,” working paper, Federal Reserve Bank of New York.
Frey, S., and J. Grammig, 2006, “Liquidity Supply and Adverse Selection in a Pure Limit Order Book Market,”Empirical Economics, 30, 1007–1033.
Glosten, L. R., 1994, “Is the Electronic Limit Order Book Inevitable?,” Journal of Finance, 49, 1127–1161.
Harris, L., 1996, “Does a Large Minimum Price Variation Encourage Order Exposure?,” working paper, University of Sourthern California.
Huberman, G., and W. Stanzl, 2005, “Optimal Liquidity Trading,” Review of Finance, 9, 165–200.
Labys, W. P., 2001, “Essays on microstructure and the use of information in limit order markets,” Ph.D. thesis, Dept. of Economics, University of Pennsylvania.
Moinas, S., 2007, “Hidden Limit Orders and Liquidity in Limit Order Markets,” working paper, University of Toulouse I.
Obizhaeva, A., and J. Wang, 2006, “Optimal Trading Strategy and Supply/Demand Dy-namics,” working paper, University of Maryland.
Pardo, A., and R. Pascual, 2007, “On the Hidden Side of Liquidity,” working paper,
http://ssrn.com/abstract=459000.
Sand˚as, P., 2001, “Adverse Selection and Competitive Market Making: Empirical evidence from a limit order market,” Review of Financial Studies, 14, 705–734.
Tuttle, L., 2006, “Hidden Orders, Trading Costs and Information,” working paper, University of Kansas.
Figure 1: A mosaic plot of the peak size (horizontal axis) against the total size (vertical axis) for
DPW. We use the following cut-offs for peak size categories: 1-1,500 shares ⇒ 1K; 1,501-2,500 ⇒
2K; 2,501-3,500⇒3K; 3,501-7,500⇒5K; 7,501+⇒10K; and total size categories: 1-7,500 shares
⇒ 5K; 7,501-12,500 ⇒ 10K; 12,501-17,500 ⇒ 15K; 17,501-35,000 ⇒ 20K; 35,001+ ⇒ 50K. The plot is constructed by dividing the unit interval into five segments whose lengths are proportional to the frequency of observed peak sizes that fall within each category. This determines the width of each ‘box’. The height of each box is determined similarly by the frequencies of total sizes for a given peak size category. The shading reflects the deviation from the relationship expected under independence and is based on the standardized (Pearson) residuals; dark shading (large “+”),>4;
light shading (small “+”), 2 : 4; solid box 0 : 2; dashed box−2 : 0; dashed box (small “-”)−4 :−2. Residuals in excess of 4 in absolute value correspond to a p-value of 0.0001 and residuals between 2 and 4 in absolute value to a p-value of 0.05 for a chi-square test with the null hypothesis of independence of peak and total size.
Remaining hidden volume 0 1 2 3 4 5 6 7
Peak=1k Peak=2k Peak=3k Peak=5k
Figure 2: The graph shows the relationship between the number of executed peaks and the
remain-ing hidden volume fordetected iceberg orders. Each set of bars in the graph represent the average hidden volume at the best quote as a function of the number of executed peaks (up to 15 peaks) for different peak size categories for DPW. The counter for the number of executed peaks keeps track of the iceberg order history so that, if an iceberg after detection is undercut, but later reappears at the best quote the counter will remember the past executed peaks and only reset the counter when the iceberg leaves the book. The dots connected by the solid line represent the average fitted values for a regression that predicts the hidden volume based on the peak size and the number of executed peaks, see Section 2.2.2 and Table IV. The cut-offs used for the peak size are as follows: 1-1,500 shares ⇒ 1K; 1,501-2,500⇒ 2K; 2,501-3,500⇒ 3K; 3,501+ ⇒ 5K. The remaining hidden volume is scaled by the average peak size for all icebergs.
Table I:Iceberg Orders: Summary Statistics
Large Medium Small All
Panel A: Iceberg Orders’ Share of Non-Marketable Orders [%]
Percent of shares submitted 6.9 (1.1) 11.2 (4.9) 9.8 (3.2) 9.3 (3.6)
Percent of shares executed 14.8 (3.1) 19.4 (3.8) 14.8 (5.2) 15.9 (4.7)
Panel B: Median Distance between Order Price and Best Quote [basis points]
Iceberg Orders 3.1 (1.5) 4.2 (2.2) 3.6 (1.9) 3.6 (1.9)
Limit Orders 3.9 (1.1) 4.8 (1.9) 3.5 (2.1) 3.9 (1.9)
Panel C: Average Size of Iceberg and Limit Orders Iceberg Orders
Total Size [1000 shares] 17.3 (12.3) 19.2 (8.7) 14.0 (4.4) 16.1 (8.2)
Peak Size [1000 shares] 3.1 (3.2) 3.2 (1.9) 2.0 (0.9) 2.6 (2.0)
Submitted # of Peaks 7.3 (1.2) 7.1 (0.7) 7.9 (0.9) 7.6 (1.0)
Executed # of Peaks 5.6 (0.6) 5.6 (0.3) 5.3 (0.5) 5.5 (0.5)
Limit Orders [1000 shares] 1.4 (1.7) 1.3 (0.8) 0.7 (0.4) 1.0 (1.0)
Panel D: Clustering of Iceberg Peak Size, Total Size and Number of Peaks
Total Size [%] 47.6 (10.1) 41.5 (2.4) 46.1 (6.1) 45.4 (7.0)
Peak Size [%] 58.2 (14.7) 49.8 (6.6) 63.9 (15.0) 59.1 (14.3)
Number of Peaks [%] 35.9 (8.6) 31.8 (6.2) 34.9 (6.6) 34.4 (7.0)
Table I reports summary statistics for iceberg orders and limit orders. Panel A reports the percent-age of submitted and executed (non-marketable) orders that are iceberg orders. Panel B reports the cross-sectional average of the median distance between the order price and the best quote on the same side of the order book for iceberg orders and limit orders. Panel C reports the average iceberg order total size (1000 shares), the average peak size (1000 shares), the average number of peaks submitted, and the average number of peaks executed for iceberg orders with at least one executed peak. The last row of Panel C reports the average limit order size (1000 shares). Panel D reports the percentage of all observations that are accounted for by the three most common values of the total size, peak size, and the number of peaks. The sum of the frequencies for the top three values are computed for each stock and then averaged within each category or across the three categories. Cross-sectional standard deviations are reported in parentheses.
Table II: Iceberg Orders: Realized Profit and Executions
Panel A: Realized Profit [basis points]
Dependent Variable: Realized Profit Using the Mid-Quote Thirty Minutes After the Execution of the Last Peak
OLS Large Medium Small
Intercept 1.66 1.66 1.66 2.78 2.78 2.78 3.74 3.74 3.74 (0.72) (0.72) (0.72) (0.82) (0.82) (0.82) (1.50) (1.50) (1.50) Order Size 0.60 5.59 5.98 1.19 7.47 7.85 1.06 7.16 7.89 (0.72) (1.04) (1.10) (0.82) (1.23) (1.30) (1.50) (1.86) (2.01) Executed Volume -6.85 -6.67 -8.47 -8.28 -9.82 -9.53 (1.04) (1.05) (1.23) (1.25) (1.86) (1.89) Peak Size -0.95 -0.92 -1.89 (0.87) (1.01) (1.77)
Panel B: First Peak Execution Probability (Marginal Effects)
Logit Dependent Variable: Execution Indicator for 1st Peak
Order Size 3.55 3.68 2.70 (0.80) (0.75) (1.35) Peak Size -1.50 -2.91 -2.61 (0.76) (0.75) (1.27) Distance to -14.73 -14.38 -12.91 Best Quote (0.73) (0.69) (1.28)
Panel C: Conditional Execution Percentage (Marginal Effects)
Ordered Logit Dependent Variable: Execution Percentage
Order Size -6.27 -7.23 -8.33 (0.65) (0.64) (1.49) Peak Size 5.93 6.20 7.19 (0.75) (0.74) (0.11) Distance to 0.81 1.12 0.03 Best Quote (0.54) (0.54) (1.60)
Table II reports regression results for the realized profit and executions of iceberg orders. Panel A reports estimates for a regression of the realized profit for icebergs withat least one executed peak on an intercept, the order size, the executed volume, and the peak size. For a buy iceberg order the realized profit is measured as the difference between the mid-quote 30 minutes after the order’s last execution and the order price. The units are basis points. The regressions are estimated stock-by-stock and we report the average parameters estimates with average standard errors in parentheses. All variables are normalized to have a mean of zero and standard deviation of one. Panel B reports the marginal effects (in percent) for a logit model for the probability of the first peak being executed as a function of the order size, the peak size, and the distance between the order price and the best quote on the same side. Panel C reports the corresponding (combined) marginal effects for an ordered logit model of the total execution percentage conditional on execution of the 1st peak. The distance from the best quote is defined as the difference between the best (same side) quote and the iceberg order’s price, in basis points, at the time of the order submission.
Table III: Detecting Iceberg Orders
Large Medium Small
Prediction Prediction Prediction
Truth No Yes Sum No Yes Sum No Yes Sum No 90.0 1.0 91.0 84.7 1.5 86.2 89.9 0.8 90.7 (1.2) (0.2) (1.0) (2.1) (0.2) (1.9) (1.4) (0.1) (1.1) Yes 2.9 6.1 9.0 4.6 9.2 13.8 3.1 6.1 9.3 (0.5) (0.5) (1.0) (0.8) (1.1) (1.9) (0.4) (0.8) (1.3) Sum 92.9 7.1 100.0 89.3 10.7 100.0 93.0 7.0 100.0 (0.7) (0.7) (1.3) (1.3) (0.9) (0.8)
Table III reports, for the best ask quote in the book, the cross-sectional averages for the pre-dictions (yes/no) generated by the iceberg detection algorithm across the percentages of the true iceberg status (yes/no). The columns of each 2×2 matrix correspond to the algorithm’s predictions and the rows correspond to the truth. Entries on the diagonal correspond to correct predictions. The cross-sectional standard errors of the means are reported in paren-theses below each mean. The results for the bid side are similar with the largest difference being of the order of less than one-half percentage points.
Table IV: Predicting Hidden Volume
Dependent Variable: Hidden Volume at Best Quote
Large Medium Small Intercept 2.29 2.55 2.34 2.60 2.66 2.92 (0.08) (0.09) (0.08) (0.09) (0.20) (0.21) I5peak−9 -1.47 -1.30 -1.72 (0.11) (0.12) (0.25) I10+peak -0.98 -1.36 -1.19 (0.23) (0.21) (0.51) Peak Size 2.28 2.22 2.26 2.22 2.72 2.67 (0.06) (0.06) (0.06) (0.06) (0.16) (0.16) Peakt−1 -0.21 -0.18 -0.25 (0.01) (0.01) (0.02) I1peak−4 ×(Peakt−1) -0.48 -0.45 -0.55 (0.04) (0.04) (0.08) I5peak−9 ×(Peakt−5) -0.37 -0.33 -0.43 (0.04) (0.05) (0.10) I10+peak×(Peakt−10) -0.11 -0.03 -0.16 (0.06) (0.05) (0.14) R2 0.19 0.21 0.16 0.17 0.17 0.19
Table IV reports average parameter estimates for regressions of the hidden volume at the best quote on the number of peaks executed and the peak size of the iceberg order. The number of peaks is denoted by Peakt and is defined as the number of peaks that have been fully
executed at the current price since the iceberg was detected; the number of peaks restarts when a new iceberg is detected. The second specification allows for (i) shifts in the intercept viaI5peak−9 andI10+peak, and (ii) the slope via the indicatorsI1peak−4 —I10+peak interacted with the peak counter (P eakt). Both the hidden volume and the peak size are normalized by the average
peak size for each stock. We estimate the regressions stock-by-stock for all observations with a detected iceberg and report the average parameter estimates for the large, medium, and small categories with average standard errors in parentheses.
Table V: Impact on Prices
Dependent Variable: Large Medium Small
∆Mid-quote over next 30 Trades A B C D A B C D A B C D Intercept -0.15 -0.15 -0.15 -0.15 -0.28 -0.28 -0.29 -0.29 -0.20 -0.21 -0.21 -0.21
(0.03) (0.03) (0.03) (0.03) (0.05) (0.05) (0.05) (0.05) (0.07) (0.07) (0.07) (0.07) Signed Trade 1.80 1.80 1.79 1.79 2.54 2.53 2.52 2.51 3.19 3.17 3.15 3.14
(0.02) (0.02) (0.02) (0.02) (0.03) (0.03) (0.03) (0.03) (0.04) (0.04) (0.04) (0.04) Signed Trade Size 0.42 0.42 0.44 0.44 0.57 0.58 0.60 0.61 0.89 0.90 0.93 0.93
(0.01) (0.01) (0.01) (0.01) (0.02) (0.02) (0.02) (0.02) (0.02) (0.02) (0.02) (0.02) Signed Iceberg Indicator 0.71 0.42 0.43 0.14 0.78 -0.12 -0.28 -0.57 1.45 0.21 0.22 -0.28
(0.06) (0.12) (0.12) (0.08) (0.10) (0.25) (0.25) (0.13) (0.15) (0.32) (0.34) (0.21) Iceb. Ind. × Signed Trade Size -0.16 -0.17 -0.16 -0.16 -0.16 -0.16 -0.15 -0.15 -0.29 -0.30 -0.29 -0.29
(0.01) (0.01) (0.01) (0.01) (0.02) (0.02) (0.02) (0.02) (0.04) (0.04) (0.04) (0.04) Executed Iceberg Volume -0.07 -0.07 -0.08 -0.08 -0.08 -0.08 -0.14 -0.15 -0.16
(0.01) (0.01) (0.01) (0.01) (0.01) (0.01) (0.02) (0.02) (0.02) Predicted Hidden Volume 0.10 0.10 0.20 0.24 0.27 0.28
(0.01) (0.01) (0.03) (0.03) (0.03) (0.03) Actual-Predicted Hidden Volume 0.15 0.28 0.36
(0.00) (0.01) (0.01)
Actual Hidden Volume 0.14 0.28 0.35
(0.00) (0.01) (0.01)
Table V reports the parameter estimates for regressions of the mid-quote change over the next 30 trades on a constant, the sign of the trade, the signed trade size, a sign


![Table II: Iceberg Orders: Realized Profit and Executions Panel A: Realized Profit [basis points]](https://thumb-us.123doks.com/thumbv2/123dok_us/65685.2507586/36.918.112.803.137.774/table-iceberg-orders-realized-profit-executions-realized-profit.webp)