Green Municipal Bonds and the
Financing of Green Infrastructure in
the United States
Candace C. Partridge
A dissertation submitted in partial fulfillment of the requirements for the degree of
Engineering Doctorate of
University College London.
Urban Sustainability and Resilience, CEGE University College London
2
I, Candace C. Partridge, confirm that the work presented in this thesis is my own. Where information has been derived from other sources, I confirm that this has been indicated in the work.
Abstract
Green municipal bonds are a novel way to help unlock finance for investment in sustainable and urban infrastructure in the US. However, issuance lags in the US market due to negative perceptions such as high cost, low returns, and greater risk. In this study we aim to demonstrate that US green municipal bond performance is consistent with the returns of general municipal bonds, which can improve investor confidence and increase demand. The performance of this bond sector is assessed through two different means: through the creation of a green municipal bond index and benchmarking its performance against an overall municipal bond index; and by looking for a price difference between green municipal bonds and their conven-tional counterparts through yield curve assessment. Increased investment in this sector could be triggered by showing that the green municipal bond sector performs similarly to, or better than, conventional municipal bonds. We found that an in-dex comprised of green muni bonds outperforms the closest equivalent S&P inin-dex from 2014-2017, and there is a statistically significant green premium (“greenium”) present in the secondary muni bond market of at least 3 basis points in 2017. There was no conclusive evidence for the presence of greenium at issue in the primary market, however there are some signs that this could change, and furthermore we do not observe that green muni bonds come to market at a discount. These results are key to encouraging growth in the green municipal bond market, which can help American cities to target ESG and SRI investors and unlock more capital for green and climate-aligned infrastructure projects.
Abstract 4
Impact Statement
The research that was undertaken for this thesis focused on green municipal bonds, which are bonds that are used to finance sustainable infrastructure. This work is inherently beneficial to society because it shows examples of where these types of bonds are being used effectively to create more sustainable development and cut emissions. It also performs a survey of this market to uncover the depth of the market and trends in market development. Finally, it explores any pricing differen-tial between these green bonds and conventional bonds to show that investment in sustainable urban infrastructure via these mechanisms does not necessarily have to cost bond issuers more, and if anything, could potentially save them (and taxpayers) money through a cheaper cost of capital.
The market survey and findings, along with the overview of policy mecha-nisms, are all of practical use to both policy makers and to investors who are in-terested in increasing their sustainability platform. For policy makers, the business cases demonstrate workable financial models that can be adapted for use in many contexts. For investors, the findings show that they may, in the end, have to pay a bit more for green bonds, however this also demonstrates that these bonds have held their value over time, and can be more resilient to market downturns.
This is one of the first complete overviews of the green bond market, and more specifically the green municipal bond market. It uses multiple techniques to anal-yse the data set, which is uniquely comprehensive and curated to best reflect the state of the market. The unique contributions of this work include the creation of a green municipal bond index, along with a yield curve analysis that has not been undertaken to such depth for this segment of the market until now.
This thesis could potentially help to encourage more green bond issuance for sustainable urban infrastructure by demonstrating that this is a market that is seeing solid growth and gains, with benefits both for issuers and investors, and therefore to the world at large.
Contents
1 Introduction 17
2 Green Bonds 29
2.1 Green Bonds . . . 29
2.1.1 Green Bond Standards . . . 32
2.1.2 Advantages of Green Bonds . . . 34
2.2 State of the Market . . . 35
2.3 Green Bonds in the Literature . . . 39
2.4 Challenges to the Green Bond Market . . . 43
3 Green Municipal Bonds 47 3.1 Municipal Bonds in the United States . . . 47
3.2 Climate Federalism . . . 52
3.3 Green Municipal Bonds: Background . . . 54
3.4 History and State of the Market . . . 56
3.5 Green Muni Bonds: Policy Review . . . 59
3.6 Issuing Green Muni Bonds . . . 65
3.7 Taxation . . . 67
3.8 Tax-Credit Municipal Bonds . . . 69
3.8.1 Certified Renewable Energy Bonds (CREBs) and Qualified Energy Conservation Bonds (QECBs) . . . 69
3.8.2 Build America Bonds (BABs) . . . 70
Contents 6
3.9.1 The Morris Model . . . 74
3.9.2 ESCOs with Muni Bonds . . . 78
3.9.3 Delaware Sustainable Energy Utility . . . 82
3.9.4 The PACE Model . . . 84
3.9.5 Green Banks . . . 87
3.10 Conclusion . . . 91
4 Green Bond Pricing 92 4.1 Greenium . . . 92
4.2 Market Performance Review . . . 95
4.3 Bond Indices . . . 102
4.4 Yield Curves . . . 105
4.5 Conclusion . . . 107
5 Data and Liquidity 108 5.1 Overview . . . 108
5.2 Index Data . . . 109
5.3 Yield Curve Data . . . 114
5.4 Liquidity . . . 116
5.5 Liquidity Results . . . 118
5.6 Conclusions . . . 121
6 Green Municipal Bonds Index Benchmarking 123 6.1 Green Muni Bond Index Construction . . . 123
6.2 Index Methodology . . . 127
6.3 Fixed Income Mathematics and Descriptive Characteristics . . . 130
6.4 Index Benchmarking . . . 134
6.5 Results of Index Benchmarking . . . 137
6.6 Conclusions . . . 147
7 Green Municipal Bonds Yield Analysis 152 7.1 Yield Curve Analysis . . . 152
Contents 7
7.2 Results of Yield Curve Analysis . . . 159
7.3 Regression Analysis . . . 164
7.4 Conclusions . . . 169
8 Discussion and Conclusions 176 8.1 Context . . . 176
8.2 ESG Motivations . . . 177
8.3 Data and Liquidity . . . 178
8.4 Market Performance of Green Muni Bonds . . . 181
8.5 Why is there a Greenium? . . . 184
8.6 International Perspectives . . . 186
8.7 Recommendations . . . 188
8.8 Conclusions . . . 191
List of Figures
1.1 Needs for infrastructure investment in the United States to 2025 in billions of dollars. Source: McNichol (2017). . . 21 2.1 A Venn diagram (not to scale) showing the relationship between
green bonds, climate bonds, and municipal bonds. . . 31 2.2 A breakdown of global green bond issuance by sector and by type
of issuer. Source: Climate Bonds Initiative (2017d). . . 36 2.3 A breakdown of global green bond issuance by tenor and rating.
Source: Climate Bonds Initiative (2017d). . . 37 2.4 A breakdown of green bond issuance by type of issuer. Source:
Climate Bonds Initiative (2017d). . . 38 3.1 Sources of funding for state infrastructure. Source: McNichol (2017). 48 3.2 The amount of spending on public infrastructure in 2004. Source:
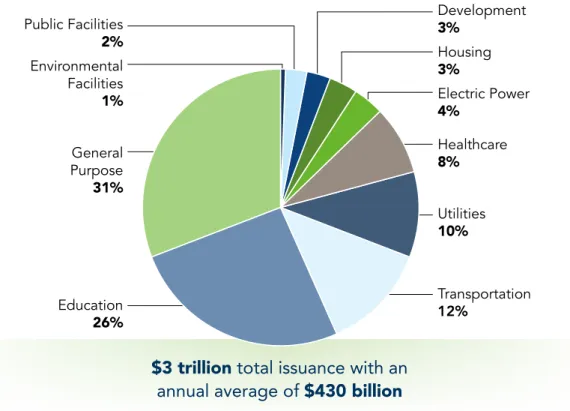
McNichol (2017); MSRB (2017). . . 49 3.3 The use of proceeds for municipal bonds issued from 2010-2016.
Source: MSRB (2017). . . 50 3.4 Breakdown of types of bond owners for US municipal bonds.
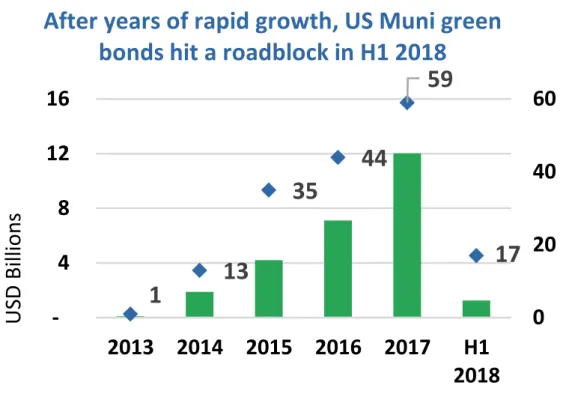
Source: MSRB (2017). . . 51 3.5 The size of the US green municipal bond market by year, both in
terms of issuance and total amount outstanding. Marin et al. (2018). 56 3.6 Amount outstanding for green municipal bonds by sector,
List of Figures 9
3.7 Amount outstanding for green municipal bonds by sector, 2015-2017. Climate Bonds Initiative (2018a). . . 59 3.8 Monthly issuance of BABs in millions of dollars from April
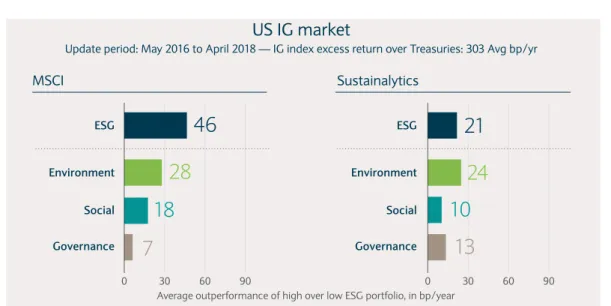
2009-December 2010. Source: MSRB (2017). . . 71 4.1 The returns of the US Investment Grade High ESG corporate bond
portfolio relative to the low ESG portfolio in basis points for the time frame spanning 2016-2018. Source: (Barclays Research, 2018). 105 5.1 Amount of climate-aligned and labelled green municipal bonds
is-sued by the top five most active states in $M. . . 111 5.2 The tenor breakdown of green and climate muni bonds. . . 113 6.1 The returns of the climate-aligned and green-labelled municipal
bond indices for 2014-2017 in relation to the S&P Muni Index. Re-based so that 2014-10-01 = 100; GDP for reference. . . 139 6.2 Green municipal indices by sector for Energy, Transport, and
Wa-ter, along with the overall climate-aligned and green-labelled muni indices, and the S&P municipal index. . . 142 6.3 Green municipal indices by state, and their corresponding state S&P
municipal index. . . 143 6.4 Rolling information ratio for the Climate-aligned (blue) and
Green-labelled (green) indices benchmarked against the S&P Muni index with a window size of 365 days. . . 144 7.1 The yield curve for Arizona Board of Regents University of Arizona
series of bonds issued in November 2016. . . 154 7.2 The aggregate primary market yield curve for December 2017. . . . 156 7.3 The aggregated monthly yield curve for the secondary market for
December 2017. . . 156 7.4 Spreads between the green and vanilla aggregate yield curves in the
List of Figures 10
7.5 Spreads between the green and vanilla aggregate yield curves in the secondary market. . . 161 7.6 Spreads between the green and vanilla pairs in the primary market. . 162 7.7 Spreads between the green and vanilla pairs in the secondary market. 163 7.8 Regression over raw yield data (top) compared with a regression on
the spreads of the same data with the base yield curve subtracted out (bottom). The yield curves at top are non-linear, so that performing an OLS regression on top of this unnormalized data could lead to spurious results. The normalized data is much noisier, so that has a lowerr2=0.26 compared with 0.71 for the unnormalized regression. 167 7.9 Normalized regression . . . 167
List of Tables
5.1 Green and Climate issuance by year, including the number of green labelled bonds. . . 110 5.2 Green and climate municipal bond issuance broken down by sector. 111 5.3 The number and amount of green and climate-aligned issuances by
the top five most active states 2009-2016. . . 112 5.4 Green and climate muni bonds broken down by Moody’s and S&P
ratings. . . 112 5.5 Index characteristics for the Climate-Aligned, Green-Labelled, and
S&P Muni indices. . . 113 5.6 The number of bonds and their volumes in the data sets spanning
January 2015 to October 2017. . . 115 5.7 The ratings bands for the green/vanilla muni bond pairs, and for the
total green/vanilla data set, of which all are at least A-rated. All of the bonds in this data set have been rated, and some bonds have both S&P and Moody’s ratings so they could appear twice in the totals. . 116 5.8 The means and standard deviations of the tenors for the green and
vanilla municipal series bonds in our set. . . 116 5.9 Issuance broken down by sector. . . 116
List of Tables 12
5.10 The normalized Index of Martin calculated from the traded prices and volumes of the bonds in the aggregated data sets (the green and climate-aligned index bonds spanning January 2015 to October 2017, and the green and vanilla series bonds spanning January 2015 through December 2017). The Index of Martin and Amihud met-ric have both been normalized by the total issue amount of assets in each basket, and the ratio of these values for each green/vanilla dataset is shown. . . 119 5.11 The mean ratios of Zero Trading Days (ZTDs) to trading days for
the green bonds and the vanilla bonds in our sample, along with t-test values to assess their statistical significance. The normalized IoM and AI are also shown for reference. . . 120 5.12 The Amihud and Martin illiquidity ratios along with the number
of active aggregated trading days calculated for the strictly paired green (GTDs) and vanilla (VTDs) bonds in our data set, broken down by year. . . 120 6.1 The number of constituents and par value of the green and
climate-aligned national and sector municipal bond indices, along with the number of constituents and par value of the S&P national and sector municipal bond indices as of mid-2017. . . 127 6.2 The pairs of the climate indices with their S&P muni index
bench-mark counterparts. . . 138 6.3 Compound Annual Growth Rate and annualised volatilities for the
period spanning October 2014 to October 2017. . . 139 6.4 Tracking errors in the returns of the climate indices compared with
their respective benchmarks over October 2014 to October 2017. . . 140 6.5 The risk-adjusted relative returns (information ratio), excess returns
(alpha), and correlations (beta) of the climate indices compared to their corresponding S&P benchmarks for the time span 1 October 2014 - 1 October 2017. . . 141
List of Tables 13
6.6 The results of the linear regressions performed on the excess returns of the climate and green indices against the excess returns of the S&P Investment Grade benchmark index, along with their statistical significance. . . 141 6.7 Three-year annualised returns for the Climate and Green indices,
along with their S&P counterparts. . . 142 6.8 The climate sub-sector index characteristics along with their S&P
counterparts. . . 143 6.9 Drawdowns experienced in the aftermath of the Presidential
elec-tion in the last quarter of 2016. The overall climate and green in-dices experienced a smaller downturn after the election than their S&P Muni index. . . 145
7.1 Weighted average characteristics for the green municipal bond data sets. The index values are for the end of the index (1 October 2017) and the green+vanilla values are averaged over December 2017. . . 155 7.2 The means and standard deviations of the initial offering yields for
the green and vanilla municipal series bonds in our set. Note the presence of greenium in 2017. . . 159 7.3 The weighted average spread between the green and vanilla series
bonds in basis points, along with the standard deviations for these means. . . 161 7.4 The weighted average spread between the green and vanilla strict
pairings in basis points, along with the standard deviations for these means. . . 162 7.5 The results of linear regressions in the spreads over time for the
green primary series bonds, the vanilla primary series bonds, the green secondary series bonds, and the vanilla secondary series bonds. . . 163
List of Tables 14
7.6 The results of a fixed effects regression of primary issuing yield spread against tenor for the series and the paired bonds in our data set, both pooled and broken down by year. . . 166 7.7 The results of a pooled panel OLS regression of yield spread against
time remaining for the secondary traded bond series and pairs in our data set, both pooled and broken down by year. . . 168 7.8 The results of fixed effects regressions of secondary yield spread
against tenor for the 2017 bonds in our data set, broken down by month. . . 170 7.9 The results of a fixed effects regression of the primary yield data,
pulling out the significance of factors like state, issue amount, etc. This regression hasr2=0.56. . . 170 7.10 The results of a panel regression of the secondary yield data, pulling
out the significance of factors like state, issue amount, etc. This regression hasr2=0.40. . . 170 7.11 The number of like-for-like green and vanilla paired bonds issued
per year, and how many of these issued with a greenium or vanil-lium (all others being issued at equal prices). . . 174
List of Abbreviations
ABS...Asset-Backed Security
ARRA...American Recovery and Act Reinvestment Act of 2009 BAB...Build America Bond bp...basis points, 1bp = 0.01% CREB...Certified Renewable Energy Bond ESG...Environmental, Social, Governance ESCO...Energy Services COmpany EMMA...Electronic Municipal Markets Access website GBP...Green Bond Principles MUSH...Municipal, University, School, Hospital (buildings) PACE...Property Assessed Clean Energy QECB...Qualified Energy Conservation Bond SREC...Solar Renewable Energy Certificate SRI...Socially Responsible Investment ZTDs...Zero Traded Days
Chapter 1
Introduction
In 2007, the Stern Review stated that climate change was the single biggest market failure. This report delivered the stark message that failing to act on climate change would result in a 20% reduction in global economic growth, and calculated that, at that time, every tonne of CO2being emitted caused damage valued at over $85 (Stern, 2007).
These findings helped to pave the way to the Paris Agreement in 2016, when 195 countries committed to keeping the increase in global temperature to within 2C above pre-industrial levels. Furthermore, it signals their commitment to “mak-ing finance flows consistent with a pathway towards low greenhouse gas emissions and climate-resilient development” (UNFCCC, 2017). This agreement was ground-breaking because it was the first time that a many nations committed to reducing their carbon emissions in an attempt to slow the pace of global warming and miti-gate the worst effects of climate change.
However, in 2017, the then-new Trump administration withdrew the United States from the Paris Agreement, stating that it would render the US non-competitive in economic terms (Rucker and Johnson, 2017). The withdrawal caused much consternation both in the US and internationally due to the fact that the US has one of the largest carbon footprints of any nation in the world and is responsible for nearly 15% of global CO2emissions (The World Bank, 2018). In reaction to the statement to withdraw, several American cities and institutions banded together and announced that they would still independently meet their Paris Agreement
commit-17
ments, under organizations such as We Are Still In and The United States Confer-ence of Mayors (We Are Still In, 2017; United States ConferConfer-ence of Mayors, 2017; Bloomberg and Pope, 2017).
Localized commitment by cities to climate action could conceivably enable the US to honor the spirit of the Paris Agreement by cutting emissions on a local, rather than national, level. This movement demonstrates the power that federalism still has in the US, where frequently legislation is driven by bottom-up rather than top-down political will (Rabe, 2018). Even more importantly, this form of climate federalism in the US further demonstrates the rise of power of cities in an increas-ingly urbanised world. Rather than being dictated to by what they perceive to be an increasingly out-of-step national regime, individual American cities and states are instead creating their own mandates for sustainable development.
Accordingly, the Fourth National Climate Assessment recently issued by the US Global Change Research Program (2018) states that “cities across the United States are leading efforts to respond to climate change.” This report warned that if climate change is allowed to happen unchecked, then the resulting damage will cost the US as much as 10% of the national GDP by 2100, which is more than double the losses incurred in the Great Recession of 2008, with damages including “$141 bil-lion from heat-related deaths, $118 bilbil-lion from sea level rise and $32 bilbil-lion from infrastructure damage by the end of the century, among others.” Overall, almost two million labor hours are forecast to be lost every year by 2090 due to temperature ex-tremes, which will cost $160 billion in lost wages by 2050. In agreement with the Stern Report, this report concludes that without a significant effort to cut emissions and improve climate mitigation and adaptation, “substantial losses to infrastructure and property would impede the rate of economic growth over this century.”
The Climate Assessment (2018) dedicated an entire chapter to the vulnerabili-ties of and effects of climate change to civulnerabili-ties in the US. It states that climate change can “exacerbate existing challenges to urban quality of life, including social in-equality, aging and deteriorating infrastructure, and stressed ecosystems,” and that “damages from extreme weather events demonstrate current urban infrastructure
18
vulnerabilities.”
At present, over half of the world’s population lives in urban areas with this proportion expected to increase to 66% by 2050 (United Nations, 2014). The US is already one of the most urbanised regions with 82% of North Americans living in urban areas (United Nations, 2014). At the same time, cities are the source of around 75% of carbon emissions from energy use (Seto et al., 2014). Due to the energy intensive nature of cities, reports have stated that we can cut global carbon emissions by 30% if we invest in energy efficiency, demand reduction, and sources of renewable energy for urban areas (Gouldson et al., 2015). Cities are very fre-quently situated on coastlines or other bodies of water, which leaves them most vulnerable to the primary effects of climate change, notably rising sea levels and increasingly severe impacts from major storms. Furthermore, the interconnected nature of urban infrastructure means that there is a need for “reliable infrastruc-ture that can withstand ongoing and fuinfrastruc-ture climate risks,” because damage to these systems will “adversely affect urban life” (US Global Change Research Program, 2018). Therefore, while it is in the world’s interest for cities to cut their emissions, it is particularly in the interest of the cities themselves to try and stave off climate change, because they will be among the first and most severely impacted.
More sustainable infrastructure (also known as “green infrastructure” in this work) for cities that addresses the issues of energy and water consumption, along with cutting emissions and improving resilience against natural disasters, is key to mitigating climate change. In 2016 in the United States, transportation was the source of over 28% of greenhouse gas emissions, and electricity generation was re-sponsible for another 28.4%, so decarbonizing these two sectors alone would make a considerable impact on the carbon budget (US Environmental Protection Agency, 2018). The IEA estimates that “an additional $36 trillion in clean energy invest-ment is needed through 2050 or an average of $1 trillion more per year compared to a ‘business as usual’ scenario over the next 36 years” (OECD, 2017b; IEA, 2016). A New Climate Economy report (2016) states that it will take $93 trillion to decar-bonize global infrastructure, with $8 trillion needed in the U.S. alone (Heal, 2016).
19
In 2017, the OECD stated that “recent estimates suggest that approximately USD 93 trillion in infrastructure investment will be needed in the next 15 years in a ‘low-carbon’ scenario” (OECD, 2017a,b).
Currently the majority of infrastructure in the United States is outdated and was not built with sustainability or resilience in mind. Every four years, the American Society of Civil Engineers publishes a report card that gives a quality rating for each sector of existing infrastructure. Overall, in 2017, they rated the infrastructure in the US as a D+, one grade above failing, meaning it is generally “poor and at risk” with a “strong risk of failure” (American Society of Civil Engineers, 2017). As stated in their latest report, “most electric transmission and distribution lines were constructed in the 1950s and 1960s with a 50-year life expectancy, and the more than 640,000 miles of high-voltage transmission lines in the lower 48 states’ power grids are at full capacity,” and this is all while facing “increasing demand, as well as increasing storm and climate impacts.” Transit, a sector that particularly has an impact on both emissions and livability of the urban environment, was rated as D-, because “the nation’s transit systems have been chronically underfunded resulting in aging infrastructure and a $90 billion rehabilitation backlog.”
Globally, infrastructure has been underfunded, resulting in a situation known as the infrastructure gap (Inderst, 2013; Subacchi et al., 2014). In the United States specifically, there is a $5 trillion USD shortfall in infrastructure investment through 2040 (American Society of Civil Engineers, 2016), and failing to address the prob-lems arising from increasingly dilapidated infrastructure will cost the US economy nearly $4 trillion in GDP by 2025. In addition to mitigation of climate change and emissions reduction, investment in more sustainable infrastructure will also help to improve work force efficiency and living standards (McNichol, 2017). However, most cities barely have the resources to maintain their infrastructure, much less invest in new. The 2018 budget that was approved by the Trump administration consisted of “tax credits to private-sector investors, which would boost investment in projects that will generate revenue like tolls or user fees (such as new roads and bridges) but leaves out maintenance of existing roads, bridges, and water lines, and
20
820 First Street NE, Suite 510 • Washington, DC 20002 • Tel: 202-408-1080 • center@cbpp.org • www.cbpp.org 19 APPENDIX
TABLE 2
Cumulative Infrastructure Needs by System Based on Current Trends Extended to 2025 (dollars in 2010 billions)
Infrastructure Systems Total Needs Estimated Funding Funding Gap
Roads, Bridges, & Transit1 $2,042 $941 $1,101
Electricity1 $934 $757 $177
Schools2 $870 $490 $380
Public Parks & Recreation3 $114 $12 $102
Airports1,4 $157 $115 $42
Dams, Levees, Waterways & Ports1,5,6 $162 $38 $124
Water & Wastewater7 $150 $45 $105
Rail8 $154 $125 $29
Hazardous & Solid Waste7 $7 $4 $3
Total $4,590 $2,526 $2,064
Source: American Society of Civil Engineers (ASCE) 2017 Report Card for American Infrastructure 1 Data taken from ASCE Failure to Act Series published 2011-16.
2 These numbers are based on the latest available national data collection and brought to current market dollars.
3 Total needs and estimated funding include all costs associated with parks and recreation. Funding gap is capital needs only. 4 Airport needs and gap include anticipated cost of NextGen: $20 billion by 2020 and $40 billion by 2040.
5 Total needs number is based on discussions with the National Committee on Levee Safety. 6 Total needs are federal and non-federal high-hazard dams.
7 Funding only includes publicly funded remediation, not funds from private sector. 8 These numbers are based on market projections and current investment trends.
Figure 1.1:Needs for infrastructure investment in the United States to 2025 in billions of
dollars. Source: McNichol (2017).
construction of public schools and many public transit projects” (McNichol, 2017).
The infrastructure investment amounts cited above do not even include en-ergy efficiency measures in building stock, whether in encouraging the construction of more efficient new construction, or the retrofitting older buildings. Yet building emissions are a significant part of the problem, since in some cities, over half of car-bon emissions result from the construction and use of buildings and transportation systems (BPIE, 2011; Merk et al., 2012). Overall, heating and cooling buildings accounts for about 40% of total energy consumed, with 70% of this energy coming from fossil fuel sources. As a result, building climate control is estimated to have been responsible for 30% of CO2emissions in 2012 (International Energy Agency, 2015).
This is why investment in infrastructure for cities must include a multi-faceted approach, which involves improved water management, expansion of public trans-port, decentralised energy generation, significant deployment of renewable sources of energy with intelligent distribution and demand response, and energy efficiency
21
measures for new and existing building stock. By investing in clean energy for cities in particular, the world benefits not only from lowered carbon emissions and improved climate change mitigation, but also from a more resilient and ultimately more affordable energy supply.
Additionally, financing green infrastructure would help to build a green econ-omy (United Nations Environment Programme, 2008), and localized investment could trigger economic growth on a national level. In particular, there has been extensive discussion about linking green infrastructure development with “green collar” jobs (Yi, 2013; United States Dept. of Energy, 2017; Gessesse et al., 2017). The stimulus of a new skilled employment sector could be a positive externality from investing in green infrastructure, along with improvement in sustainability and resilience for American cities. Otherwise, retaining a “business as usual” ap-proach rather than investing in a greener future, cities could face consequences later, both physically in terms of climate disaster mitigation, and fiscally in terms of dam-ages and depressed economic prospects that arise from a lack of resilient and robust infrastructure.
Green bonds can help to unlock financing for green and sustainable infrastruc-ture. Green bonds are a subset of bonds which are “intended to encourage sus-tainability and to support climate-related or other types of special environmental projects. More specifically, green bonds finance projects aimed at energy efficiency, pollution prevention, sustainable agriculture, fishery and forestry, the protection of aquatic and terrestrial ecosystems, clean transportation, sustainable water manage-ment and the cultivation of environmanage-mentally friendly technologies” (Investopedia, 2018). Despite their beginnings in the private sector in the form of corporate bonds, green bonds are now also increasingly being issued by public governmental bodies, both in the form of sovereign and sub-sovereign debt. This intersects with the fact that one of the largest sub-sovereign debt markets in the world is the municipal bond market in the US, currently with over $4 trillion in debt outstanding for a million different projects, and $445.8 billion issued in 2016 alone (SIFMA, 2018; Lambert, 2014). As stated by Saha and D’Almeida (2017), “Green municipal bonds are an
22
important area for future growth as cities and other sub-national entities look to low-cost and long-term sources of capital to finance climate mitigation and adaptation infrastructure requirements.” The New Climate Economy sustainable infrastructure report (2016) also says that “with the right approach, green bonds can be power-ful instruments and play a tremendous role in facilitating sustainable infrastructure investment and growth.”
Green bonds are important for closing the infrastructure gap because they help to “broaden the universe of highly-rated fixed-income products (bonds) attached to clean energy, thereby making it easier for investors to increase allocations to clean energy within existing liquidity/creditworthiness constraints” (Fulton and Ca-palino, 2014). However, against the background of increasing ESG (Environmen-tal, Social, and Governance) investment, the question is whether such these green bonds are competitive with respect to the overall market, which is necessary in or-der to prove appealing to investors who are subject to fiduciary duty, in that they are mandated to put profits before all other investment criteria. If, however, it can be shown that green assets can give returns as good as, or better than, their con-ventional counterparts, then investors can comply with their fiduciary duty and help invest in sustainability at the same time (Sandberg, 2011)
Another challenge facing the development of sustainable infrastructure is lack of access to institutional capital, despite the fact that socially responsible investors (SRI) are continually searching for investments that meet their ESG criteria (Fulton and Capalino, 2014). The sustainable investment sector is best situated for lever-aging capital to close the infrastructure gap via green bonds. At present, there are $22.89 trillion of assets under SRI management, which is an increase of 25% since 2014, and accounts for 26% of all managed assets (Global Sustainable Investment Alliance, 2016; US SIF, 2016). Also, there are more than $60 trillion in assets under management by signatories to the Principles for Responsible Investment (OECD, 2017a).
This is relevant at a time where ESG investing is becoming increasingly im-portant (Chandler, 2018), and where the demands of the socially conscious retail
23
investors are starting to influence the mandates of the larger institutional investors. As stated by Amy O’Brien, head of responsible investment at TIAA Investments Napach (2017),“we’re seeing the political climate actually act as a catalyst for ESG and impact investing solutions”.
A primary way to motivate ESG investment in green infrastructure is to demon-strate that the performance of green assets is comparable to the overall market. As long as the impression persists that ESG investing means taking a hit in terms of profitability (K¨ob, 2018), then most investors (both retail and institutional) will shy away from ESG investing. However, it is not necessarily true that ESG investing is less profitable, and now that there is beginning to be enough data to explore this issue (Barclays Research, 2016, 2018), the best way to trigger more ESG-guided investment into sustainable infrastructure is to show that it is a good investment in terms of financial returns in addition to being a good investment in terms of climate or moral returns. Indeed, the best way to help grow the market is to show that sus-tainable investing does not have to be a compromise. To this end, we don’t actually have to demonstrate the that green investments outperform the conventional market, but rather it is sufficient to show that they perform equivalently, so that the need to balance ESG returns against financial returns is negated.
The motivation of this work is to explore financial methods that can help to meet the challenges of sustainability, resilience, and chronic underinvestment in the infrastructure in American cities. We focus on the advancement of green (sustain-able) infrastructure in cities, from the perspective that financial instruments like green bonds can be used to kick start sustainable urban investment in a way that is currently lacking in the scope of traditional finance. As stated by Mathews and Kidney (2010), “many renewable energy projects are rendered uncompetitive not because of technical inadequacies but because funding sources are limited to loans from very conservative banks.” In particular, the main stumbling block for clean energy finance is the reluctance of investors to invest in new technologies and/or business models, especially when their revenues are sensitive to policy risk.
24
novel financial instruments, especially after the collapse of the CDO (Collateralized Debt Obligation) and ABS (Asset-Backed Securities) markets during the subprime crisis of 2008. Fortunately, there is already an existing financial instrument that has been used for over 200 years to finance infrastructure in the United States: munici-pal bonds. In particular, green municimunici-pal bonds are an increasingly popular way for American cities to finance green infrastructure (Sanders et al., 2013). Against this background, this work seeks to explore the behavior of green and climate-aligned municipal bonds in the United States with a specific focus on green infrastructure.
This work focuses on the United States municipal bond market because this market is the largest and most active municipal bond market in the world with al-most $5 trillion in assets outstanding, and municipal bonds are financial instruments that are commonly used in the US for investment in infrastructure for cities, towns, and states (Garrett, 2008). Because the US municipal bond market is the largest of its kind, it means that it is also the largest aggregation of green and climate-aligned municipal bond data, and no other bond market has the depth of data available in terms of infrastructure-related bonds that the US muni bond market does. While there is a growing corporate green bond market, these bonds are not issued in the same numbers as US municipal bonds, so in order to obtain the largest possible homogeneous data source, we focus our investigation specifically on the US munic-ipal bond market. This also ties in with our initial motivation of investigating ways to accelerate access to capital for sustainable urban infrastructure, since municipal bonds are implicitly vehicles for financing urban infrastructure.
The US saw $11 billion in green municipal bonds issued in 2017, the largest year ever, however these represent only about 2% of the overall US muni bond market. For the green municipal bond market to scale up and effectively address the infrastructure investment shortfall, investors need to know that buying green bonds does not expose them to greater losses than buying into conventional muni bonds. Moreover, if the green muni bond market showed a green premium, or “greenium”, this would show that some investors are willing to pay more for these bonds.
mu-25
nicipal bonds, we collected the relevant bonds into an aggregated data set which includes all green-labelled municipal bond ever issued in the US, along with a large sample of climate-aligned bonds, which are bonds that would qualify for the green label, however for whatever reason they have not been formally declared as green bonds. We also capture a segment of so-called “vanilla” bonds, or conventional non-climate-related bonds, that have been issued concurrently with green bonds. This data allows us to assess the performance of the green and climate municipal bonds against the prevailing conventional municipal bond market via two methods: the creation and benchmarking of a green and climate-aligned municipal bond in-dex, and yield curve spread analysis between contemporaneous green and vanilla municipal bonds.
Demonstrating that the green municipal bond market is competitive with, or outperforms, the conventional municipal bond market could help to alleviate some of the perceived market risks for green municipal bonds and unlock more capital for investment in sustainable infrastructure. Therefore, our overarching objective is to assess the competitiveness of the green and climate-aligned municipal bonds as compared with the prevailing municipal bond market. The techniques used to accomplish this are twofold:
1. To create an index for this asset class and benchmark its performance against conventional municipal bonds; and
2. To investigate whether there is any significant greenium in the market for new green municipal bond issuances via yield curve analysis.
This work makes several contributions to the current state of the art. First of all, the bond data that has been collected is uniquely comprehensive and well-formed. No other work has collected the depth of homogenous and manually checked and cleaned data that is used in our analysis, which is crucial to any study that inves-tigates the performance of green assets, particularly when so many question what actually constitutes “greenness”. In terms of the analysis, no one else has created an index specifically for green and climate-aligned municipal bonds. There are com-mercially available municipal indices and corporate green bond indices, but there
26
is no extant green municipal bond index in order to benchmark the performance of that market sector. Furthermore, while there have been yield curve analysis for cor-porate green bonds, and yield curve analysis for the secondary market performance of green municipal bonds, there has been no yield curve analysis for the primary market performance of green municipal bonds. Finally, this work includes a pair-wise like for like analysis between green muni bonds and their vanilla counterparts, which has not been done before.
The reason that we focus on green municipal bonds is because they are crucial to helping cities build and retrofit greener, more sustainable infrastructure. How-ever, in order for the green municipal bond market to scale up – and be able to effectively address the infrastructure investment shortfall – investors need to know that buying green bonds will not expose them to greater losses than buying con-ventional municipal bonds. If the green municipal bond market showed a green premium, or “greenium”, this could encourage a more diverse pool of investors to enter the market and potentially push down the cost of capital for municipalities looking to finance green and sustainable infrastructure projects.
This work is structured as follows: In Chapter 2 we provide background and context for what green bonds are and the state of the global green bond market. Chapter 3 focuses specifically on the green municipal bond market in the United States, and provides a history of this market along with giving several case studies of where municipal bonds have been used to finance sustainable infrastructure in the US. Chapter 4 focuses on the search for “greenium”, or a premium in the pricing of green bonds as compared to conventional bonds, and also introduces the two main tools for market performance analysis that we use in our research. Chapter 5 describes how we collected our data and describes how we assessed the comparative liquidity of our data. Chapter 6 pertains to the construction and benchmarking of our green and climate indices as a way of benchmarking the performance of this market. Chapter 7 describes the construction and spread analysis of the yield curves for the green municipal bonds compared with the conventional (“vanilla”) municipal bonds. Chapter 8 brings together our findings from the index benchmarking and
27
Chapter 2
Green Bonds
This chapter will provide an overview of the green bond markets, with a particular focus on applications for investment in green infrastructure. We will set the con-text for the the research by describing the background and history of green bonds, describe some of the literature where they are featured, and discuss some of their disadvantages.
2.1
Green Bonds
Bonds have always had an essential role in financing infrastructure, and with the increasing urgency behind developing more climate-resilient and sustainable infras-tructure, there is a burgeoning new asset class that is specifically targeted towards financing green infrastructure: green bonds. Green bonds are “debt instruments used to finance green projects that deliver environmental benefits” (OECD, 2017a). The issuers of these bonds are bound by commitments to use the proceeds that they raise solely to finance or refinance green and sustainable projects, business activi-ties, or assets. The Green Bond Working Group defines a green bond as “one for which the issuer declares that the proceeds will be applied (either by ring-fencing, direct project exposure or securitization) towards climate and/or environmental sus-tainability purposes” (Bank of America Merrill Lynch and Citi, 2013).
Green bonds have some significant advantages that lend themselves towards increasing the size of the market and therefore the capital available to green infras-tructure. Shislov et al (2016) outline some of these advantages in their report titled
2.1. Green Bonds 29
“Beyond transparency: unlocking the full potential of green bonds”. One key ad-vantage is that labelling a bond as green has been shown to increase the pool of po-tential lenders and diversify the investor base. As the report states, “issuing a green bond can be a way for these organizations to gain visibility, and thus attract more attention from investors,” which has led to many green bonds being oversubscribed. Of particular note within the context of the green muni bond market, “the green bond issued by the State of Massachusetts in 2013 was 30% oversubscribed, while the regular bond was undersubscribed” (KPMG, 2015). Furthermore, Shislov et al (2016) state that “at some point, a larger base of investors may also lead to a greater ability to reach long term lenders and thus have access to longer maturities,” and that green bonds also serve as a “way [for companies and municipalities] to com-municate on their sustainability strategy and thus enhance their reputation.” A side effect of this is that green bonds can “help build stronger sustainability awareness within the issuing organization and reinforce ties between financial and sustainabil-ity departments” and, in turn, “help develop and enable the basis for an improved understanding and integration of climate-related issues in the financial decision-making process.”
Green bonds are generally labelled as such by the issuers and/or indepen-dent reviewers, and “labelled green bonds are no different from normal bonds in the wider market; the difference is that proceeds are transparently channelled for climate-friendly purposes” (Financing the Future Consortium, 2015). In addition to labelled green bonds, there are many bonds whose use of proceeds are also for sustainable and climate-friendly uses and would qualify for the green label, how-ever for whathow-ever reason, these bonds are not labelled. In this work (in alignment with others (OECD, 2017a)), we refer to these bonds as “climate-aligned bonds”, or just “climate bonds”. Climate bonds are the super-set of all bonds whose use of proceeds finance green and climate-friendly infrastructure, and green bonds are the sub-set of the climate bonds that are “officially” labelled as green bonds. Ulti-mately, both climate bonds and green bonds serve the same goal. The relationship between green bonds, climate bonds, and municipal bonds is shown in Figure 2.1.
2.1. Green Bonds 30
Bond Universe US Municipal Bonds
$4 trillion
Labelled Green Bonds $221 billion
Green Municipal Bonds $12 billion
Climate Bonds $895 billion
Figure 2.1:A Venn diagram (not to scale) showing the relationship between green bonds,
climate bonds, and municipal bonds.
The European Investment Bank (EIB) and World Bank first started issuing what they call “climate bonds” in 2007 (European Investment Bank, 2015). Since then, the multilateral lenders have continued to champion green bonds, and in 2013 the first corporate green bonds were issued by EDF, Bank of America, and Vasakro-nan. The largest corporate green bond issued to date is a EUR2.5 billion offering from GDF Suez in March 2014 (Climate Bonds Initiative, 2015b). One of the main points for the increasing adoption of the green bond is that they were intended from conception to be identical to the pre-existing types of bonds in all ways except in their labelling and use of proceeds (Mathews and Kidney, 2012). The reason for this is that it keeps the barriers to entry into the green bond market as low as possi-ble since they can use already existing legal and financial frameworks, which was considered to be more efficient than creating an entirely new financial instrument. One of the main reasons for the success of green bonds is that “investors do not have
2.1. Green Bonds 31
to choose between financial returns and environmental benefits, as green bonds of-fer the same financial terms as other bonds, with the added bonus that their green label enables investors to identify them as environmentally beneficial investments” (Climate Bonds Initiative et al., 2015).
As opposed to (unlabelled) climate bonds, labelled green bonds have gone through the process of the issuers agreeing to the Green Bond Principals (GBP) (ICMA, 2016). The GBP states that use of bond proceeds must go towards eli-gible projects, specifically those that fulfil environmental objectives. In addition, the issuers also agree to provide periodic reports in order to ensure accountability and transparency, and also enable the stated objective of having third party auditing and/or certification (frequently from CICERO). Issuers that agree to the GBP and fulfil the criteria can then refer to these bonds as labelled green bonds. However, as stated previously, there is a larger universe of bonds that are issued for climate-friendly projects that are unlabelled. These bonds can be referred to as unlabelled green bonds or climate-aligned bonds. One of the main objectives of the green la-bel is to serve as a “discovery tool” (Climate Bonds Initiative, 2016), which has the potential “to reduce friction by allowing investors to find environmentally sustain-able securities while minimising transaction costs incurred through the diligence and research normally required to find and compare unlabelled bonds in the broader market.” In short, one of the main advantages of the green label is that it makes green bonds easier to identify for investors that are specifically looking for green investments.
2.1.1
Green Bond Standards
There are a number of different frameworks and taxonomies that deal with the project definitions of what is eligible for the green bond label, but the two major international standards are the aforementioned Green Bond Principles (GBP), and the Climate Bonds Standard (CBS), both of which are described below.
The Green Bond Principles (GBP) (ICMA, 2017) are voluntary guidelines that “recommend transparency and disclosure and promote integrity in the development of the Green Bond market by clarifying the approach for issuance of a Green Bond.”
2.1. Green Bonds 32
The GBP recognises “several broad categories of eligibility for Green Projects with the objective to address key areas of environmental concern such as climate change, natural resources depletion, loss of biodiversity, and air, water or soil pollution.” The framework includes but is not limited to: renewable energy (including produc-tion, transmission, appliances and products); energy efficiency (such as in new and refurbished buildings, energy storage, district heating, smart grids, appliances and products); pollution prevention and control; environmentally sustainable manage-ment of living natural resources and land use; terrestrial and aquatic biodiversity conservation; clean transportation; sustainable water and wastewater management; climate change adaptation; circular economy adapted products; and green build-ings. The basis for the labelling of a green bond as green according to the GBP is that the use of proceeds for a bond must go to green projects, “which should be appropriately described in the legal documentation for the security. All designated Green Projects should provide clear environmental benefits, which will be assessed and, where feasible, quantified by the issuer.” Furthermore, “The net proceeds of the Green Bond, or an amount equal to these net proceeds, should be credited to a sub-account, moved to a sub-portfolio or otherwise tracked by the issuer in an ap-propriate manner, and attested to by the issuer in a formal internal process linked to the issuer’s lending and investment operations for Green Projects,” and green bond issuers should issue regular (annual) reports on project progress and information on the actual use of proceeds. The GBP are voluntary guidelines with no means by which to enforce compliance with their standards, nor are their standards rigorously defined or intended to serve as a legal framework.
The Climate Bonds Standards (CBS) (Climate Bonds Initiative, 2017a) builds on the GBP, but goes a step further in seeking third party verification for green claims. As of 2017, the CBS is in full alignment with the GBP, and similarly re-quires “clear mandatory requirements for use of proceeds, tracking, and reporting and specific eligibility criteria for low carbon and climate resilient projects and as-sets. However, it also provides “an assurance framework with independent verifiers and clear procedures” and furthermore encourages “certification by an
indepen-2.1. Green Bonds 33
dent Climate Bonds Standard Board.” This certification by an external third party addresses potential greenwashing worries and “allows investors, governments and other stakeholders to prioritise green bonds with confidence that the funds are being used to deliver a low carbon and climate resilient economy.” However, certifica-tion is still voluntary under the CBS. Advantages of going through the certificacertifica-tion process are described as the prevention of investors “having to make subjective judgements or do expensive due diligence on the green attributes of certified invest-ments.” This, in effect, puts the onus on the issuer to go through the certification process, which while it may open the pool of interested SRI investors, could add to transaction costs due to the time and effort required. Furthermore, the CBS are separated into pre-issuance and post-issuance requirements, the former for a bond to gain certification, and the latter are reporting requirements to retain certification. While the types of projects that could be financed by a CBS certified green bond are in alignment with those covered by the GBP, the requirements for capital accounting and reporting on use of proceeds is much more proscriptive. Also, the sector-based requirements for green eligibility are still under development for many sectors. The CBS take a more rigorous legal approach and address what to do when a bond’s actual use of proceeds ends up falling outside of the “green” category.
2.1.2
Advantages of Green Bonds
Green bonds are beneficial because they deepen the pool of available investors, help address maturity mismatches between long-term projects and short-term financing, and potentially offer cost advantages amongst other things. In particular, institu-tional investors with long investment horizons, such as pension funds and insurance companies, are increasingly interested in investing in green infrastructure in order to help hedge against long term climate risks inherent to their current investment portfolios (Shishlov et al., 2016). They also provide “much-needed diversification” for investment portfolios while at the same time providing stable returns (Climate Bonds Initiative, 2015c). However, the market faces challenges in the form of lack of awareness, added transactional costs, and lack of standardisation (OECD, 2017a). In order to overcome some of these challenges, many ESG investors and issuers
2.2. State of the Market 34
are looking for a green premium, or “greenium”. This would provide evidence that green bond buyers are willing to pay more for green bonds, a point that this research explores in detail.
Furthermore, the green label helps to give a “green halo” (Hale, 2018) effect to the issuer, in that “the green label provides a good indication that, all things being equal, the given issuer has a stronger focus on governance, which in turn lowers the overall credit risk” (Michaelsen, 2018). Issuing green bonds helps to lower the cost of capital for an issuer because the “value ascribed to green bonds are not exclusive to the bond itself but is rather issuer-specific, such as improved governance and stronger strategic alignment towards a sustainable agenda, which also benefits non-green bonds.” A study done by NatWest also reported these findings, stating that “green bond issuance helps attract a broader sustainability-focused investor base to the company’s debt as a whole, thereby putting downward pressure on the entire [yield] curve” (Hale, 2018).
This green halo effect can also positively impact the bottom lines of the com-panies that have issued green bonds. Flammer (2018) found that the stock market responded positively to news of corporate bond issuances, finding a 0.67% in the cumulative abnormal return in a company’s stock price around the times of an-nouncements of green bond issues. The issuance of corporate green bonds was also associated with an increase in long term company value along with an increase on the return on assets. In addition to positive associations with book value, green bond issuance also correlated positively with an increase in the company’s environmental score and a decrease in their CO2 emissions.
2.2
State of the Market
Over the past decade, a growing market for green bonds has emerged in the wake of pioneering early issuers. The size of the green bond market grew from $3 billion in 2011 to $95 billion in 2016 (OECD, 2017a). Between 2008 and 2013, the World Bank (2013) issued approximately $4 billion in green bonds, and uses the proceeds raised for eligible projects that meet their project selection criteria, which include
2.2. State of the Market 35
4 Bonds and Climate Change www.climatebonds.net September 2017
$ Billions 300 200 400 500 600 0 100 Corporate Financial
corporate or sub-sov Sovereign government Supranational Does not meet broad investment parameters Investable universe $389bn AAA 13.5% A 20% BBB 18% Less than BBB 6.5% No rating 4% AA 38% Transport is the largest theme in the universe
but has decreased as a percentage of the total universe and now accounts for 61% (66% in 2016). The change is primarily due to the large increase in labelled green bond issuance - $100bn since the 2016 report.
The Energy theme is the second-largest theme in the universe and is primarily renewable energy manufacturers and operators. There are few utilities in this theme due to the diverse nature of most utilities.
The Multi-sector theme now accounts for 13% of the universe – all of which is labelled green bonds. The sector captures green bond issuers such as development banks where proceeds go to a range of projects in different themes.
Buildings and Industry, Agriculture and Forestry, Water and Waste make up a small proportion of the overall universe, accounting for less than 7% between them. This is partly because bonds are not frequently issued by
issuers in these sectors and partly because it is challenging to identify pure-plays in these themes and related sectors.
Sovereign and sub-sovereign agencies are an important part of the universe
accounting for 68% of the total amount outstanding. This includes entities owned by or guaranteed by the sovereign or sub-sovereign government such as China Railway Corp and Network Rail among others. Transport 61% Energy 19% Multi-sector 13%
Buildings & Industry 2%
Water 3%
Transport and Energy account for 80% of the universe
$389bn meet basic investment parameters
Sovereigns and sovereign entities make up the majority of the universe
Waste & Pollution 1%
Agriculture & Forestry 1%
To track what proportion of the universe is available to most investors around the world, we screened the universe using the following indicators:
ƭ
Size: > $200m (85% meet filter)ƭ
Liquidity: bond has a recent ask price (69% meet filter)ƭ
Currency: is included in the Barclays Global Aggregate Index (63% meet filter) 43% of the universe meet all 3 parameters - a universe of $389bn outstanding. The rating distribution of that sub-set is shown right. This provides an idea of the types of investment that many international investors are looking for although we note that the many fund managers will have their own methodology and criteria in place. For example, in the primary market, there has been large demand for labelled green bonds which are less than $200m in size.Overview of the $895bn climate-aligned bond universe
The growth in the climate-aligned universe is encouraging but there is headroom for a much larger market.
Figure 2.2:A breakdown of global green bond issuance by sector and by type of issuer.
Source: Climate Bonds Initiative (2017d).
mitigation projects such as solar and wind generation, along with efficiency, among others. As of mid-2015, there were $40 billion in labelled green bonds issued, and $532 billion of unlabelled climate bonds (Climate Bonds Initiative, 2015b). However, in the American context, green bonds (both corporate and municipal) make up only 0.061% of the total US bond market, which, percentage-wise, is much lower than “China, India, and South Africa, and an order of magnitude below the share in the Nordic countries, Germany, the Netherlands, and France” (Chiang, 2017).
In their 6th annual State of the Market report in 2017, the Climate Bonds Ini-tiative (2017d) estimated the size of the global climate-aligned bond market to be worth just under US$895 billion, $221 billion of which are labelled green bonds, and includes 3,493 bonds from 1,128 issuers. The largest sector for bond issuances is transport, specifically rail, however clean energy is the second largest sector with 21% of issuances (see Figure 2.2). This is likely due to the developed nature of the rail bond market, and to the “greenness” inherent to rail transport that makes it relatively easy for these bonds to be labelled as green. Over $600 billion in green bonds are issued by sovereign or sub-sovereign governmental entities (which
in-2.2. State of the Market 36
Bonds and Climate Change www.climatebonds.net September 2017 5
Pe rc en ta ge 30% 20% 40% 0% 10% 0-10m 0 100 200 300 400 500 600 10-100m 100-200m 200-500m 500m-1bn >1bn RMB 32% USD 26% EUR 20% GBP 6% Other 4% Labelled Unlabelled
AAA AA A BBB less than BBB No rating
>10
5-10
<5 The average bond size is approximately
$262m with a similar distribution of issue sizes for both green bonds and climate-aligned bonds. The largest number of bonds fall into the $10-$100m bracket – a large number of municipal bonds fall into this bracket as do corporate bonds, particularly in emerging market currencies where bond sizes of less than $100m are common.
The main currencies are broadly similar to the major bond market currencies, with USD and EUR well represented. One difference is the dominance of RMB5 and the very limited presence of JPY. There are a few reasons for this: a) RMB figures are very large because the largest issuer in the dataset – China Railway Corp makes up 25% of the universe alone. China Railway Corp raises the finance for China’s extensive and rapidly-growing rail network; b) RMB bonds have become a large proportion of the green bond market (which in turn makes up a growing percentage of the total market) while there are almost no JPY denominated green bonds.
The majority of issuance has tenors in excess of 10 years, with the average tenor of climate-aligned bonds at 11.7 years. This is similar to the average global corporate bond tenor of just over 11 years. Long tenors are common in state-backed rail entities or utilities whose assets have long lifetimes and which have the credit rating to issue longer-dated debt. These bonds make up the majority of the climate-aligned bond universe.
A large proportion of bonds do not have a credit rating. Issuers such as China Rail Corp have a local credit rating but no international credit rating. For this report, only the
international rating agencies were used.
Climate-aligned bond
universe in the global bond
market context
An $895bn universe is big but how big is this in the context of the global bond market?
The value of climate-aligned and green transactions in Q2 2017 amounted to just over $43bn while the value of international debt capital market transactions in the same period amounted to $1.1tn6 putting climate-aligned transactions at just under 4% of the total volume. Growth is encouraging but also indicates that there is
headroom for an even bigger climate-aligned bond universe.
CAD 2% RUB 2% INR 2% SEK 2% KRW 2% CHF 1% AUD 1%
Most bonds are between $10-$100m
RMB, USD and EUR account for the majority of issuance
61% of the universe has a tenor greater than 10 years
Ye
ar
s
$ Billions
Figure 2.3:A breakdown of global green bond issuance by tenor and rating. Source:
Cli-mate Bonds Initiative (2017d).
cludes municipal bonds), also as shown in Figure 2.2.
This State of the Market report also found that the majority of the climate bond universe is investment grade (rated BBB- or above), and most green bonds issued are $10 to $100 million in size, however the average bond size is $262 million. This could be due to influenced by the municipal bond market, which features many smaller issue bonds rather than large monolithic ones, but there is also a pipeline of large benchmark size green bonds that would explain the high average. A break-down of the relationship between tenor and rating is shown in Figure 2.3, which shows that 61% of issued green bonds have a tenor longer than 10 years, which is in alignment with the long term nature of infrastructure investment. This report states that the amount of bond issuance in the global debt capital markets in Q2 2017 was $1.1 trillion, compared with $43 billion of climate and green bond issuance, or 4% of the overall total.
2.2. State of the Market 37
Bonds and Climate Change www.climatebonds.net September 2017 17 Sovereign
Development Bank
Corporate
Commercial Bank
ABS Other debt instruments
Muni/Provincial/City Govt agencies & State-Backed Entities
$ Billions 60 40 80 100 0 2013 2014 2015 2016 2017 YTD 2017 estimate 20
The labelled green bond market is growing rapidly
There has been an increasing diversity of structures within the last 2 years, with the first covered bonds (Pfandbrief), the first green Schuldschein, and the first green residential mortgage-backed securities (RMBS) coming to market.
Country issuance continues to be driven by China and the major North American and European markets, but there has been issuance from emerging and new markets including India, Brazil and South Africa. In comparison with the global bond markets, the main missing market is Japan with less than $3bn outstanding. With new green bond guidelines having now been issued by the Ministry of the Environment of Japan in March 2017, we expect this to change. China was the largest source of issuance in 2016, and 2017 is expected to exceed that of 2016. In H1 of 2017, France was the leader of the country table on the back of the EUR7bn ($7.5bn) sovereign bond. Green bonds have been issued in 40 different countries and from all habitable continents.
Strong demand continues to drive the market with oversubscription being the norm. The French sovereign bond was a particular highlight with the sovereign initially going to market for EUR3bn and upsizing to EUR7bn, after receiving orders in excess of EUR20bn. While it is difficult to know whether there is an upper limit on the demand for green product, two features are notable: 1) numerous green bond-specific funds and indices have been launched in the past year which is both indicative of strong demand and may lead to further demand; 2) while demand from investors
Largest issuers to date EIB KfW World Bank SPD Bank Republic of France Iberdrola TenneT Holdings EDF IFC Engie Amount $22.6bn $12.8bn $10.6bn $7.6bn $7.6bn $5.6bn $5.5bn $5.3bn $5.3bn $5.1bn Issuer type Development Bank Development Bank Development Bank Commercial Bank Sovereign Corporate Corporate Corporate Development Bank Corporate Country Supranational Supranational Supranational China France Spain Netherlands France Supranational France with a green mandate has been a driving
force behind market growth, a key success has been that green bonds are identical in structure to vanilla bonds making them equally attractive to investors without a green mandate.
Development banks have maintained a strong presence and leadership role
in the market despite the fact that they have been outgrown by corporate and sub-sovereign issuers. The EIB, KfW and World Bank take the top three spots in terms of total issuance to date. All three have been involved in pushing best practice in the market through the Working Towards a Harmonized Framework for Impact reporting54 launched in 2015. Several new
players have entered this market in the past year, including the China Development Bank and Brazil’s BNDES.
Issuance from corporates and commercial banks has grown but there’s plenty of headroom for more. In some countries, corporates and commercial banks make up a large proportion of issuance – e.g. the Netherlands (69% by value) and France (65% by value). In other countries, it is lower – in the U.S., corporates and commercial banks account for 56% and Germany just 20%.
External reviews in the form of second opinions and third-party certification are vital for maintaining transparency and credibility in a market and are recommended by the Green Bond Principles. Over the past few years there has been an increase in the percentage of bonds that have had external reviews. By value, the percentage of green bond issuance which has received an external review has been steadily increasing from 65% in 2015, to 77% in 2016 and to 82% so far in 2017.
Figure 2.4:A breakdown of green bond issuance by type of issuer. Source: Climate Bonds
Initiative (2017d).
In terms of labeled green bonds, in 2016 $81.4 billion in labeled green bonds was issued, double the amount of 2015 issuance, with the trend projected to con-tinue. By the end of 2017, total green bond issuance was $155 billion, beating the projection in this report of $100 billion, and according to analysis by Moody’s, 2018 is forecast to see issuance of over $250 billion (Sharma, 2018).
In their S&P report, Marin et al. (2018) discuss the application of their “Green Evaluation methodology to a sample of 45 self-labeled U.S. municipal green bonds” issued from 2012-2017 and found that “the U.S. green bonds scored on par with their international counterparts.” This is based upon the Green Evaluation frame-work that S&P released in April 2017, which “scores how green a bond is, rather than providing an opinion whether or not it is green.” This green evaluation tool establishes a score for the total environmental benefit or resilience impact “relative to a regional baseline and compared with that of similar projects and technologies globally” and also provides a second-party opinion consistent with the GBP. This method quantifies the “greenness” of a bond “based on three components with dif-ferent weightings–Governance (25%), Transparency (15%), and Environmental or
2.3. Green Bonds in the Literature 38
Resiliency impact (60%)” with each transaction scored from 0 to 100 to reflect “the transaction’s overall environmental contribution as well as its alignment with climate-change mitigation or adaptation goals.” Then this score is expressed as a quartile from E1-E4, with E1 projects having the most benefit. They found that “the majority of global self-labeled green bonds evaluated under our Green Evaluation tool scored E2, with an average score of 70”. This report concludes with a forecast, stating, “in the near-to-medium term, we expect growth in both labeled green bonds and unlabeled climate-aligned bonds as issuers seek to make investments that miti-gate or adapt to the impacts of climate change, and as investors increasingly pursue yield associated with improving the environment.”
2.3
Green Bonds in the Literature
One of the first papers to appear in the literature about green bonds was “Mobilizing private finance to drive an energy industrial revolution” (Mathews et al., 2010). This policy paper says, “if capitalist industrialism created the problem in the first place, then in our view a way has to be found for capitalist processes to solve the problem.” It proposes the establishment of “Climate Bonds”, stating that “privately financed instruments (that may tentatively be termed Climate Bonds) will have to play a significant role in the transformations that lie ahead.” Furthermore, “when we look back at the history of financing of major infrastructure projects, we see that private debt finance instruments (bonds or debentures) have done the heavy lifting in getting the projects off the ground.”
This was follow