Enterprise Feedback Suite
EFS Reporting +
Version: Date: 1.4 17.02.2012and reproduction of this publication or any parts of it is only permitted with the express written approval of QuestBack AG.
This publication is issued without any guarantee whatsoever. Information contained herein can be changed without prior notification. In addition QuestBack accepts no guarantee as to the exactness or completeness of the information, text, graphics, links and other items in this publication. This publication is a preliminary version, which is not subject to any valid licence agreement or other agreements with QuestBack. The software products offe-red by QuestBack AG and/or its distributors may contain software components of other software manufacturers. All products may show country-specific differences.
QuestBack, Enterprise Feedback Suite, EFS, EFS Survey, EFS Panel, EFS Employee and EFS Leadership, other QuestBack products and services mentioned in the text and their corresponding logos are trademarks and can be registered trademarks of QuestBack in Ger-many and other countries worldwide. All other names of products and services are trade-marks of their respective companies.
Germany
QuestBack AG
Kalscheurener Straße 19a 50354 Koeln-Huerth
Norway (Head office)
QuestBack AS Løvenskiolds gate 26 0260 Oslo
Contents
1 EFS Reporting +
. . . 72 Creating and Managing Reports
. . . 82.1 Overview of the Report Manager . . . 8
2.2 Creating a Report . . . 9
2.3 Subsequent Updating of Reports. . . 10
2.4 Restricting Access to EFS Reporting + . . . 11
3 Building a Report Structure
. . . 123.1 Overview of the Drag-and-drop Editor . . . 12
3.2 Basic Rules for Building Report Structures . . . 14
4 Selecting Source Data
. . . 154.1 Overview of Source Data . . . 15
4.2 Using Participant Data . . . 16
4.3 Using Panel-specific Data . . . 17
4.4 Importing External Data . . . 19
5 Dividing Reports Into Chapters
. . . 225.1 Overview of Chapter Structuring . . . 22
6 Defining the Base
. . . 246.1 Overview of Limiting the Base . . . 24
6.2 Defining Restricting Conditions. . . 25
6.3 Using Test Data Instead of Live Data . . . 27
6.4 Anonymizing Results. . . 28
6.5 Effects of Anonymization in Detail . . . 29
7 Creating Contingency Tables
. . . 317.1 Overview of Contingency Table Configuration. . . 31
7.2 Defining Split Dimensions . . . 33
8 Compacting Results
. . . 348.1 Overview of Recode Configuration . . . 34
8.2 Defining Recodes . . . 35
9 Configuring Tables
. . . 389.1 Overview of Table Configuration . . . 38
9.2 Defining the Table Structure . . . 39
9.3 Displaying Useful Information . . . 41
9.4 Adding Key Figures and Aggregations. . . 42
9.5 Controlling the Inclusion of Missings. . . 45
9.6 Formatting Numbers . . . 46
9.7 Changing Texts . . . 47
9.8 Changing Codes . . . 48
9.9 Re-sorting Answer Options . . . 48
9.10 Moving, Hiding, Or Deleting Individual Anwer Options. . . 48
10 Creating Charts
. . . 5010.1 Overview of Chart Configuration . . . 50
10.2 Chart Types . . . 52
10.3 Assigning Chart Types to Question Types . . . 52
10.4 Making Chart-specific Settings . . . 53
11 Creating and Distributing Reports
. . . 5511.1 Overview of the Export Functions . . . 55
11.2 Generating and Downloading Report Files. . . 56
11.3 Available File Formats . . . 57
11.4 The Generation Process . . . 58
11.5 Making Reports Available in EFS Survey Status . . . 58
12 FAQ
. . . 601
EFS Reporting +
EFS Reporting + is the new complete solution for the evaluation of results of EFS Survey and EFS Panel projects.
앫 Intuitive drag-and-drop interfaces and streamlined workflows make the applica-tion a convenient and efficient tool to work with. Thus, you can create even com-plex reports within next to no time.
앫 The application supports all quantitative project types of EFS Survey and EFS Panel, i.e., both anonymous and personalized surveys, panel surveys, and master data surveys.
앫 All the results of the respective project, including the data from open-ended ques-tions, are available as source data for individual evaluation. In panel and master data surveys, you may also use panel-specific data such as master data or perfor-mance data.
앫 Even externally collected data can be imported into EFS Reporting + and used for evaluation. In particular, this allows for the import of encoding results from EFS Qualitative Analysis into EFS Reporting + and the subsequent quantification of qualitative statements.
앫 The pool of project participants to be included in the evaluation (the base) can be defined according to the specific research goals and further restricted in particular sections of the report. This provides a high degree of flexibility for detailed exami-nations.
앫 All important properties of the evaluation tables, such as table structure, number format, or labels, can be adapted as required. Aggregations or key figures can be added with only a few clicks to be displayed in the report.
앫 Pie and bar charts help illustrate the evaluation results, allowing for significant reports.
앫 A user-friendly editor allows you to create complex contingency tables with only little effort. Practical function sets for the creation of tables help you realize your desired table structures quickly and efficiently.
앫 Recoding allows you to compact your survey results or to combine various indivi-dual results.
앫 Following its configuration, the report can be exported into a navigable HTML page or into common MS Office formats such as XLS, PPT or PDF for subsequent download.
In this manual, all features of EFS Reporting + are introduced in detail.
Additionally, you will find videos demonstrating all the steps from the creation of a report to the download of the finished file in the customer center.
If you haven’t changed to EFS Reporting + yet, please get in touch with your Quest-Back contacts: They will be happy to introduce you to the new solution.
The old reporting tool will be kept available throughout EFS 8.0 and 8.1. But in the versions > EFS 8.1, it will not be available anymore.
2
Creating and Managing Reports
A project-specific report manager is used to create and manage the reports.
앫 When you create a report, the current questionnaire structure and the existing result data of the respective project will be transferred into EFS Reporting +. If necessary, you can subsequently update the data (Chapter 2.3, p. 10).
앫 The rights system of EFS allows to restrict access to both EFS Reporting + and the created reports (Chapter 2.4, p. 11).
2.1 Overview of the Report Manager
To open the report manager, click on the menu item EFS Reporting + in the survey menu of your project.
The figure shows all relevant functions:
앫 The head section lists the most important properties of the project.
앫 The list below contains all the reports of the project that have been created so far. Listed are the title, the author, and the date of the last change.
앫 In order to edit one of the existing reports, click on it and select the appropriate button below the list:
– Open: This will open the report. Alternatively, you can also open a report by double-clicking on its title. Please note: A report can only be edited by one user at a time. If you try to open a report that is being edited by another user, this will prompt a message telling you that the report is currently blocked. Now you can either wait or view the report in read-only mode. In read-only mode, the drag-and-drop function and other actions are disabled and all icons, buttons, and settings are greyed out.
– Edit: You can change the entries for the title, description, and author in the dialog shown in figure 2.2.
– Copy: A copy of the report will be created.
– Delete: The report will be deleted. Please note that any existing export files will also be deleted. Especially if you wish to keep export files of the report available on EFS Survey Status, you should not delete the report.
앫 If you wish to create another report, select the button Create report and follow the instructions. The creation of reports is explained in detail in Chapters 2.2, p. 9 and
2.3, p. 10.
In order to use EFS Reporting +, you need write rights to the ACL right “report_reporting”. Otherwise, you won’t be able to see the EFS Reporting + menu.
Figure 2.1 Report manager
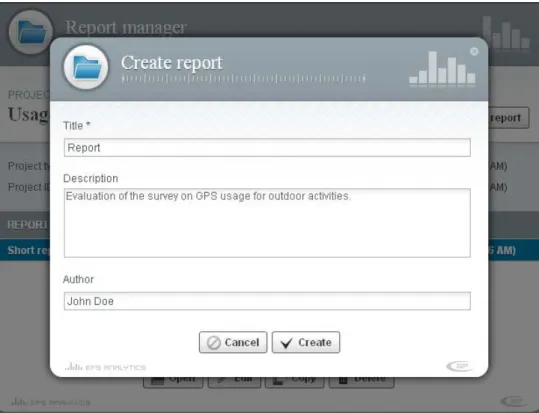
2.2 Creating a Report
To create a new report, please proceed as follows:
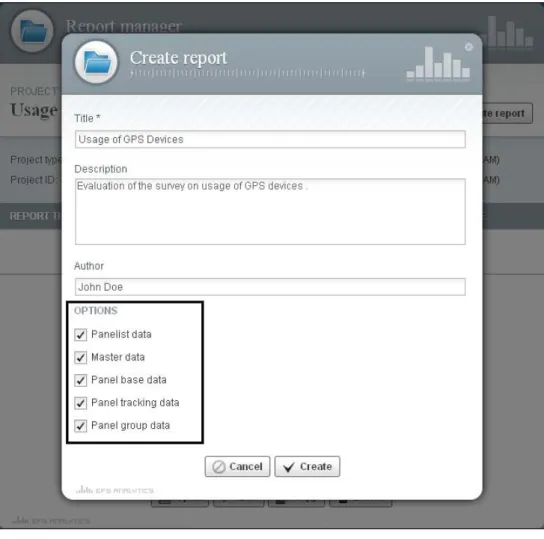
1. All standard texts in the new report, as e.g. information on the project or the labeling of the first chapter, will be automatically preset in your admin area language, i.e. either English or German. Therefore, before opening the report manager, please set your EFS admin area to the language in which you want to create the report. (Some of the preset texts cannot be changed at a later date.) 2. Click on the Create report button.
3. Enter the title.
4. Optionally, you can add a description or name the author of the report.
5. In panel and master data surveys, an additional “Options” section will be displayed. There, you can select panel-specific data such as master data or performance data: These data will then be included in the report and will be available for evaluation (Chapter 4.3, p. 17). Please note that you will not be able to return to this option later on.
Figure 2.2 Creating a report
6. Confirm by clicking on Create.
7. The report will be created. In this process, the current questionnaire structure, the existing result data of the project, and possibly also certain panel-specific data will be included in EFS Reporting +. Upon completion, the report will be opened for further editing.
2.3 Subsequent Updating of Reports
When you create a report, the current questionnaire structure and the existing result data of the respective project will be transferred into EFS Reporting +. If you have made any subsequent changes to the questionnaire or if additional respondents have participated after creating your report, you can manually update it. This update includes:
앫 The latest result data of the project will be included in the report.
앫 All calculations in the report will be repeated.
앫 If the questionnaire structure has changed in the meantime, the affected structural elements will be marked.
You will find this function in the Extras->Data update menu. The update process requires considerable resources. Therefore, EFS checks if an update is required and prevents excessive usage.
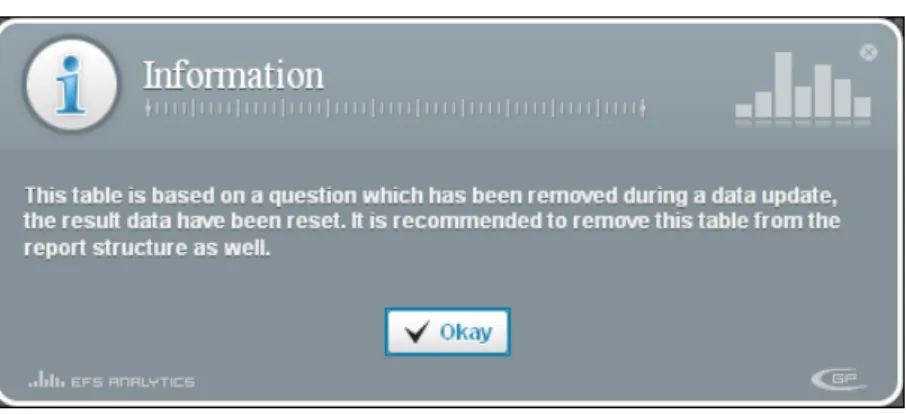
After performing an update, please check your report and adjust any changed parts accordingly. The following figures show typical markings and messages.
Figure 2.3 Marking of a changed question within the structure
Figure 2.4 Problem notification upon opening a table whose source question has been deleted in the table editor
2.4 Restricting Access to EFS Reporting +
The rights system of EFS provides you with a means to control access to both EFS Reporting + and the created reports.
앫 Access to EFS Reporting + is protected by the new ACL right “report_reporting”. Your staff needs write rights in order to see the menu item EFS Reporting + and to use the tool.
앫 If you handle the distibution of the reports created with EFS Reporting + using EFS Survey Status, you can control access to the individual files via ACL and object rights as usual, see Chapter 11.5, p. 58.
앫 The conventional EFS Reporting continues to be protected by the right “report_onlinereport”.
See Chapter 16.1 of the EFS Survey Manual 8.1 for detailed information on the rights system of EFS.
3
Building a Report Structure
This chapter introduces you to the user interface of EFS Reporting + and its most important functions.
3.1 Overview of the Drag-and-drop Editor
Creating a new report or opening an existing report via the report manager will take you to the actual edit dialog of EFS Reporting +.
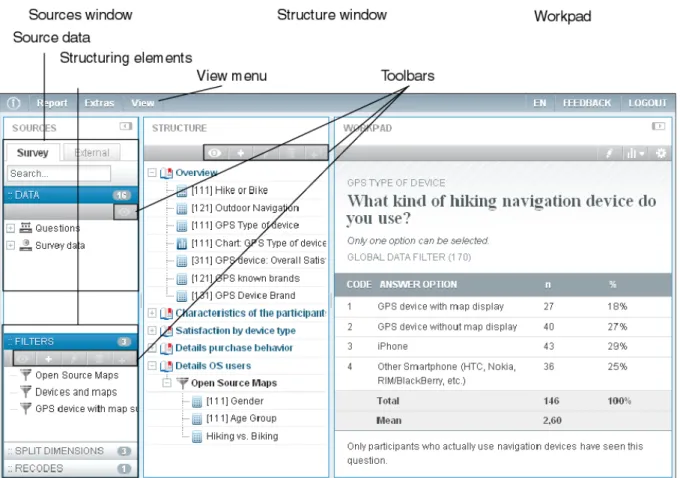
Figure 3.1 Drag-and-drop editor
앫 The Sources window on the left-hand side contains all available source data (Chapter 4, p. 15), recodes (Chapter 8, p. 34), and structuring elements such as filters for restricting the base (Chapter 6, p. 24) and split dimensions for creating contingency tables (Chapter 7, p. 31).
앫 In the Structure window you build your report.
앫 In the Workpad on the right-hand side you can open and edit individual tables and charts (Chapters 9, p. 38 and 10, p. 50).
Please note: A report can only be edited by one user at a time. If you open a report that somebody else is already working on, it will be displayed in read-only mode. The drag-and-drop function and other actions will be disabled, all icons, buttons, and settings will be greyed out.
The figure above also shows some important features that you will be needing for central procedures.
앫 In the View menu you can define how the questions shall be labeled in the sources and structure windows. By default, the question types and titles are displayed. Alternatively, you can have the questions texts or question IDs displayed. Please note that this function only serves as an aid to orientation. Which information will be displayed in the report will be configured elsewhere (Chapter 9.3, p. 41).
앫 The toolbars of the source and structure windows provide various functions needed for editing the respective contents:
– Preview: Opens a preview of the contents or results of the selected element. Please note: The preview for the entire report in the structure window contains only predefined test data (Chapter 6.3, p. 27).
– Create element: Opens the dialog for creating a new element such as a chapter or a filter.
– Edit: The selected element will be opened. – Delete: The selected element will be deleted. – Copy: The selected element will be copied.
3.2 Basic Rules for Building Report Structures
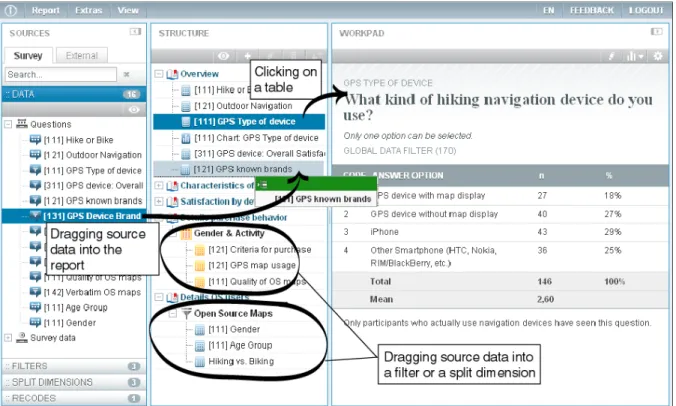
Preparing complex reports in EFS Reporting + in a quick and efficient manner requires only a few basic functions.
앫 Drag-and-drop: Source data and structural elements are dragged from the sources window into the structure window, where they are arranged in the desired order.
앫 Structuring: Structuring functions, such as filters for restricting the number of participants or split dimensions for creating contingency tables, are created as separate elements which are then dragged to the desired position in the report. All tables and charts that are to be subjected to a split dimension - i.e., for which contingency tables are to be created - are subsequently dragged into this split dimension, thus creating a separate branch.
앫 Detail view: To open a table or chart in the workpad, simply click on the selected element.
Figure 3.2 Basic rules for building report structures
The report structure can be up to ten level deep, i.e., it is possible to nest up to ten elements.
4
Selecting Source Data
Depending on the type of project, various source data can be used for evaluations in EFS Reporting +:
앫 Automatically available are all the results of the respective project including answers to open-ended questions and text input fields, as well as GET parameters (p variables), user-defined variables (c variables), and important survey variables.
앫 The participant variables (u variables) of personalized projects can be used optionally. From EFS 8.1, you can import them when creating the report (Chapter
4.2, p. 16). In EFS 8.0, specific participant data which are required for evaluation from external sources can be imported as external data (Chapter 4.4, p. 19) or a recoding trigger can be used to write them into user-defined variables.
앫 In panel and master data surveys, you may also use panel-specific data such as master data or performance data.
앫 Data collected outside of EFS and in particular encoding results from EFS Qualitative Analysis can be imported as well.
앫 A report may contain up to 300 variables. Up to 100 additional external variables can be generated via import and filled with data.
앫 A report may contain up to 20,000 data records.
4.1 Overview of Source Data
In the header section of the sources window you will find several tabs with all the data that is available for evaluation.
앫 Tab Survey: automatically available data from the respective project, i.e.,
– all questions of the projects (v variables) including open-ended questions and text input fields. Exceptions: unsupported question types (the text matrices 143, 144 and 363 and the user-defined question type 911) and results from loops and conjoint surveys.
– GET parameters (p variables) – user-defined variables (c variables)
– important survey data: disposition code, quota assignment, sample number – from EFS 8.1 in personalized surveys optionally available participant data
(Chapter 4.2, p. 16)
앫 Tab Panel: in panel and master data surveys, optionally available panel-specific data such as master data or performance data (Chapter 4.3, p. 17).
앫 Tab External: external data that were manually uploaded into the report (Chapter
4.4, p. 19).
Please mind: The complexity of a report depends of both the number of variables and the number of data records. Depending on the size of these two factors, you may experience extended calculation times below the thresholds mentioned above.
Figure 4.1 Source data
Various display features and icons help you locate the desired source data quickly:
앫 To see more information on a question and a simple frequency distribution of the answers, mark the respective question and then open the Preview.
앫 Questions located in a filter branch, i.e., questions that have been viewed and answered by selected participants only, are marked with a filter icon.
앫 Text input fields for open-ended answers to closed-ended questions (e.g. “Other:...”) are listed as separate elements and marked [A+T] (“answer and text”).
앫 Survey data containing no values will be greyed out. For example, the sample number will not be filled in anonymous surveys.
앫 Unsupported question types will be greyed out as well. Currently, only the text matrices 143, 144 and 363 and the user-defined question type 911 are not being supported.
4.2 Using Participant Data
When evaluating personalized surveys, you may optionally use participant data (u variables).
앫 From EFS 8.1, to have them available in the report, please include them according to the instructions in the following Chapter 4.3, p. 17 when you create your report. It is not possible to include them at a later date. In EFS 8.0, specific participant data can be imported as external data (Chapter 4.4, p. 19) or a recoding trigger can be used to write them into user-defined variables.
4.3 Using Panel-specific Data
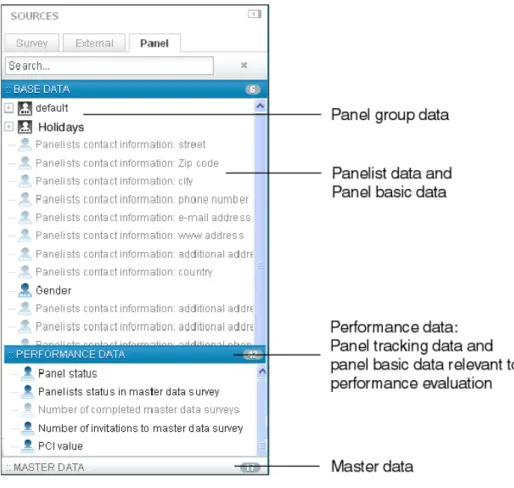
When evaluating panel and master data surveys, you may also use panel-specific data. In general, the following data types are available:
앫 Panelist data: participant data of the panelists (u variables)
앫 master data (m and md variables)
앫 Panel basic data: important system variables (mode of entry, language version, way of entry, PCI value, panelist status in the master data survey, and panel status)
앫 Panel tracking data (track variables)
앫 Panel group data: membership of panelists in panel groups
To have these panel-specific data available in the report, you have to include them according to the following instructions when you create your report. It is not possible to include them at a later date.
Performing an import
When creating a report on a panel or master data survey, an additional “Options” section will be displayed in the create dialog.
Including all available panel-specific data in a report can have adverse affects on the performance. Also, especially in the case of more complex panels, you may reach the maximum of 300 internal variables per report. However, by carefully selecting the panel data to be included according to the respective objective of your evaluation you can keep the number of variables in your report small, resulting in improved processing times.
Figure 4.2 Including panel-specific data
Select the desired data. The following figure shows the imported data in the sources window (in the example, all data were imported).
Figure 4.3 Panel data in the sources window
4.4 Importing External Data
If necessary, you can import data collected outside of EFS into EFS Reporting + and subsequently use those data as source data for your evaluation. This allows, among others, to import coding results from EFS Qualitative Analysis, thus turning qualitative results into quantifiable data.
앫 You will find the import function in the Extras->Import external data menu. In the following, the import will be explained in detail.
앫 Upon completion of the import, the data will be available on the External tab of the sources window.
Advice for your planning
The following advice will help you in preparing your import:
앫 You can import up to 100 additional variables per report. These variables will be created anew. It is not possible to import any values for already existing variables, neither for EFS variables nor for previously imported external data.
앫 When importing, you can specify whether the values of the imported variables shall be treated as codes or as text. External variables of the “code” data type may have up to 25 answer options. If you have to import variables with a greater number of answer options, you may alternatively declare those variables as being of the "text" data type: The data will then be displayed in the report as open-ended answers. They cannot be used for crossbreaks, calculations, etc.
앫 The usual missing values (“-77”, “-66”, “-99”) can be used in the import file: They will be treated as user-defined missings in the report (Chapter 9.5, p. 45).
앫 If the imported variable names are displayed in the report, the labels can be subsequently adapted via the table editor (Chapter 9.7, p. 47). It is not possible to subsequently edit the imported values or the data types.
앫 When importing answers to multiple response questions, it may make sense to use the recoding function to combine multiple variables into one question or to display the 0/1 encoding (“selected” / “not selected”) as desired. Please note in particular the notes on the possibility of multiple recodes in Chapter 8.3, p. 36.
앫 If an import file contains two columns with identical labels or if you import the same variable twice, then two new variables will be created. Internally, EFS will assign unique names to all columns of the import file, there will be no duplicates check.
앫 When performing multiple imports, a dedicated, dated file for each import operation will be created on the External tab, containing all variables imported within this operation.
Creating an import file
The import file should be structured as follows:
앫 The import file should be in CSV or Excel format.
앫 One column is used for each variable to be imported.
앫 A column should contain the consecutive numbers of the participants ("lfdn") so that the imported data records can be linked to the data records in EFS Reporting +.
앫 The first row should contain the labels of the variables.
앫 The following rows contain the external data records of the participants.
Performing an import
Please proceed as follows:
1. Please make sure that your report contains all current data records. If not, you can trigger an update via Extras->Data update (Chapter 2.3, p. 10).
2. Open the menu Extras->Import external data. 3. Select the appropriate character set.
4. Use the Browse function to select the import file on your PC. 5. To start the import process click on Execute.
6. Specify which column of the import file contains the consecutive numbers of the participants (“lfdn”).
7. Assign the appropriate data types to the imported variables.
– Code (integer): This data type should only be selected if the values of the variables are as suitable for calculation as are the codes of EFS. Upon completion of the import, the values will be available for calculations in EFS Reporting +.
– Text: The values will be stored in the database as strings, i.e., they will be displayed as open-ended answers and will not be available for crossbreaks, calculations, etc.
8. Confirm by clicking on Execute. 9. The assignment will be executed.
– If the system reports that data rows cannot be assigned, it means that no data record was found for the values of the linking variable in those rows. Check whether the values of the linking variable have been entered properly.
– The message “Data type does not match” signals that a column contains text while it was selected for the “code” data type.
10. Upon clicking on Import, the new variables will be created and the data uploaded. 11. You will find the external data on the External tab.
5
Dividing Reports Into Chapters
Reports can be divided into chapters. In the completed report, these chapters will be displayed differently depending on the specified format:
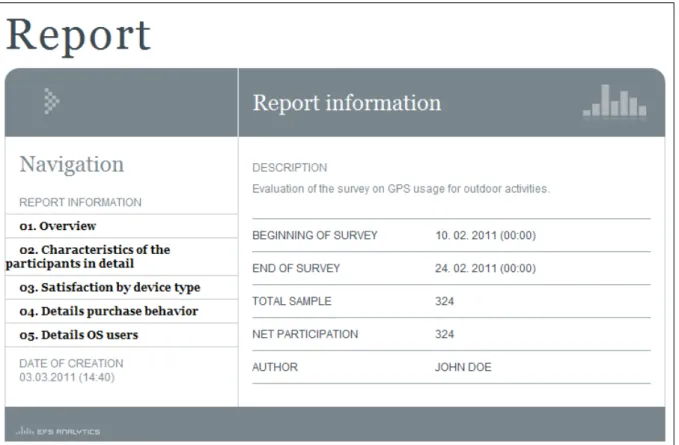
앫 HTML reports: The chapters will be shown in the navigation bar of the report (see Figure 5.1). The contents of a chapter will be summarized on one HTML page.
앫 Excel reports: The contents of a chapter will be summarized on one Excel sheet.
앫 PPT reports and PDFs generated from PowerPoint reports: An additional PPT slide with an inside title will be inserted at the beginning of each chapter.
5.1 Overview of Chapter Structuring
Figure 5.1 shows an example of an HTML report with chapter structure.
Figure 5.1 Chapter structure in a completed HTML report
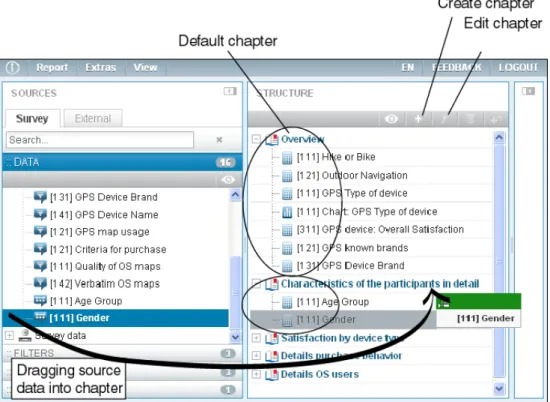
Figure 5.2 shows you how to create such a chapter structure.
앫 Every report automatically contains a first chapter with the default title “First chapter”. This chapter can neither be moved to another position nor can it be deleted. If you wish to rename it, open the chapter editor by clicking on the Edit
icon in the structure toolbar.
앫 In order to create another chapter, click on the Create chapter icon and enter the title and description in the chapter editor. The new chapter will be automatically inserted at the end of the report: If necessary, you can drag it to another position.
Afterwards, you drag all required source data and structural elements into this new chapter.
앫 If you wish to subsequently edit, delete, or copy an already existing chapter, you need to mark it and then select the respective function in the structure toolbar. Please note that - just as in the questionnaire editor - you will delete or copy the entire branch below that chapter.
Figure 5.2 Functions for editing the chapter structure
In order to make sure that your chapter structure will be displayed correctly in the completed report, please note the following: The chapters in the completed report will be arranged in linear sequence. It is not possible to create subchapters. All chapters should therefore be at the topmost level in the report structure. If you move a chapter into the branch of another chapter, it will still be interpreted as the regular next chapter at the base level, i.e., there will be a break in the completed report.
6
Defining the Base
EFS Reporting + enables you to specify the number of persons to be included in the evaluation (“base”) and to further limit this number for certain sections of your report, if required. You can control the size of your base using special filters.
앫 The restricting conditions are formulated using the condition editor that you are already familiar with from the questionnaire and which you also use to define questionnaire filters, triggers, and hiding conditions.
앫 The frequently-used restrictions by disposition code and date of participation can be activated with a few clicks via separate fields.
앫 To protect the anonymity of the participants, you can define anonymity limits both for the entire report and for particular sections. See Chapters 6.4, p. 28 and 6.5, p. 29.
앫 Displaying test data instead of real result data will speed up your work. See Chapter
6.3, p. 27.
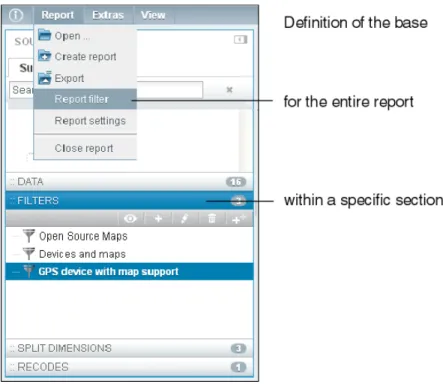
6.1 Overview of Limiting the Base
Using the filters familiar from the questionnaire editor, you can restrict the base either for the entire report or just for a particular section. Figure 6.1 shows you where to find the respective filters.
Figure 6.1 Options for limiting the base
앫 The base for the entire report is defined via the Report filter in the Report menu. The functions of this filter are presented in Chapter 6.2, p. 25.
앫 Furthermore, you can create separate filters to limit the base within a specific section of the report.
– In the filter section of the sources window you will find the filters from your questionnaire. You can create additional filters via the toolbar the way you are familiar with from the chapters. Chapter 6.2, p. 25 provides a detailed explanation of the dialog for defining the filter conditions.
– Place the defined filters in the appropriate positions of your report structure as shown in Figure 6.2. Then drag all those elements into this filter to which a filter shall be applied or in which the base shall be limited using the filter.
Figure 6.2 Further limiting the base for a particular section
6.2 Defining Restricting Conditions
Report filter menu and filter dialog share largely the same structure. Table 6.1
presents all functions.
앫 The columns “Report filter” and “Filter” you which restricting options are available in the Report filter menu and in the filter dialog.
Figure 6.3 Using the report filter to limit the base for the entire report
Option Report
filter
Filter Meaning
Name x x In standard configuration, the header sections of all tables and charts of the report will show the respective base (Table 9.2). In this field you can change the default label.
6.3 Using Test Data Instead of Live Data
Optionally, you can have predefined test data displayed instead of the real result data when working in the workpad. This means:
앫 For all values in the tables and charts, predefined default values will be displayed. Total and base will likewise only be the sums of those predefined test data.
앫 The test data are totally unrelated to the test and result data of the survey. Data from tester accounts are generally ignored in EFS Reporting +.
앫 The preview always contains predefined test data
앫 As soon as you generate an export file, the system will automatically refer to the real result data, perform live calculations, and display real results.
Condition editor x x The condition editor familiar from the
questionnaire editor. The condition will be applied to the entire report or - in the case of filters - to the respective report section.
Please note that EFS Reporting + does not sup-port all operators which are available in the ques-tionnaire editor.
• The following operators are available: greater, greater equal, equal, less equal, less, unequal. • The following operators are not available:
con-tains, contains any, matches regex, in, in or below, in branch.
If a questionnaire filter contains one of these unsupported operators, the condition will be blank after transfer into EFS Reporting +. Only in the report filter:
Use test data in the workpad
x - In order to speed up the work process, you may optionally display predefined test data in the workpad instead of the actual live data. See Chapter 6.3, p. 27.
Anonymity limit x x Optionally, you can define an anonymity limit for the entire report or - in the case of filters - for a specific report section.
• By default the drag-and-drop list is preset at “0”, i.e., all results will be displayed. • Chapter 6.4, p. 28 provides detailed
information.
Disposition codes x x The base can be limited via the disposition code. Usually, only data from participants who completed the questionnaire are used. Therefore, only the disposition codes 31 and 32 are activated.
Only in filters: Date of participation
- x For individual report sections, the base can be limited to participants who participated within a particular period.
Using test data will speed up your work!
(Cont.)Option Report filter
Filter Meaning
Using test data will eliminate the resource-intensive calculations that take place whenever you open a table or a chart. Thus you can work more efficiently especially in the following situations:
앫 Preparing complex reports for large projects: With the resource-intensive live calculations eliminated, you can work faster - and you can still check the plausibility of your table configuration based on the test data.
앫 Preparing a report for a project with no data available yet: The test data provide orientation when configuring the report. Test data need not be generated manually anymore.
If you wish to work with test data, tick the option “Use test data in the workpad” in the
Report->Report filter menu (Figure 6.3 and Table 6.1).
6.4 Anonymizing Results
Occasionally, there are survey situations where the number of answers to certain questions will become so small, due to filtering or quotation, as to compromise the respondents’ anonymity. Also, when using the evaluation functions of EFS Reporting +, such as filters or crossbreaks, it may allow for inferences to be made about particular participants or groups of participants. This can be avoided by setting an anonymity limit for your report. Anonymity limits are limit values stating the minimum number of answers required for a result to be displayed in the report. If the number of answers does not exceed this limit, the result will be hidden. This is necessary to ensure the participants' anonymity.
앫 Anonymity limits can be defined both for the entire report and for specific sections.
앫 The anonymity limits are applied to all question types available in EFS Reporting +, including open-ended questions.
앫 In standard configuration, the anonymity limits always refer to a single variable. If there are not enough results for at least one answer option of the variable, the values for all its answer options will be hidden in all tables and charts. Of the statistical values, only “Base” and “Total” will be shown, all other values will be hidden as well.
앫 From the next EFS 8.2 onwards, it will be possible to configure EFS Reporting + in such a way that the anonymity limits refer to “Total”. If you need this option earlier for an EFS 8.1 project, please contact QuestBack Support.
앫 Anonymized data are marked (see Figure 6.4):
– You can tell anonymized tables and charts by the comment “*) Some values have been anonymized”.
– Columns containing anonymized values are marked with a *.
– In tables, anonymized values are replaced with a dash (-). In charts, “0” is displayed for the corresponding answer options.
앫 By default, no limit is preset, i.e., all results are displayed.
If you wish to anonymize your reports or a section thereof, enter the desired value into the field “Anonymity limit” in the Report->Report filter menu or in the filter dialog (Table 6.1).
6.5 Effects of Anonymization in Detail
1. Anonymization in various question types
In standard configuration, the anonymity limits of EFS Reporting + always refer to a single variable. Therefore, it depends on the question type how the answers to a question are anonymized.
Single response question and open-ended text field
The number of answers for each separate answer option must exceed the anonymity limit. Otherwise the values for all answer options of the question will be hidden.
Figure 6.4 Anonymization in the case of a single response question. Limit: 52. The grey table on the right has not been anonymized.
Multiple response
The number of participants who chose a specific answer option must exceed the anonymity limit. Otherwise the answer option will be hidden.
Figure 6.5 Anonymization in the case of a multiple response question. Limit: 138. The grey table on the right has not been anonymized.
Matrix
For each answer option, the number of answers for each separate dimension must exceed the anonymity limit. Otherwise the values for all dimensions of the answer option will be hidden.
2. Nested anonymity limits
The use of filters allows for anonymity limits to be nested. Please note that anonymity limits at subordinate levels may only become increasingly restrictive.
앫 Therefore, a filter will only raise the limit defined for the entire report.
앫 A filter located in another filter branch will likewise only raise the limit of the superordinated filter branch and the limit for the entire report.
Examples:
While the anonymity limit for the entire report is set to “5”, it is set to “10” within a particular filter. -> Before and after the filter the anonymity limit is “5”. Within the filter branch it is “10”.
While the anonymity limit for the entire report is set to “10”, it is lowered to “5” within a particular filter. -> For the entire report inclusing the filter branch, the anonymity limit is “10”: You cannot override the limit for the entire report with a filter.
3. Anonymization of crossbreaks
Contingency tables are anonymized as well. In the case of contingency tables with “Total” column, please note: Once a column has been anonymized, the “Total column” will be completely anonymized as well. This is necessary to prevent anybody from calculating the missing values on the basis of the remaining data and total values.
7
Creating Contingency Tables
Contingency tables come into play when you want to examine whether and how the participants’ answers correlate with a certain attribute or a combination of attributes. In these tables, the participants’ answers are split up according to the attribute combinations to be examined, and listed side-by-side, thus allowing for their direct comparison.
In the contingency table shown, the details regarding the use of maps are split up based on the respondents’ sex and preferred sports. Additionally, the right-hand column “Total” displays the marginal totals.
Figure 7.1 Contingency table with two nested variables and one "Total" column
In EFS Reporting +, you can realize complex contingency tables with little effort.
앫 The split dimensions (table headers) do not have to be configured for each contingency table individually. Like filters, they are prepared in the sources window and then placed at the desired position in the report.
앫 The structure of split dimensions can be defined easily via drag-and-drop.
앫 Contingency tables can be up to three dimensions deep (i.e., a maximum of three variables can be nested within one split dimension) and contain a maximum of twentyfive columns.
앫 Please note that the choice of chart types available for contingency tables is limited to column charts.
7.1 Overview of Contingency Table Configuration
앫 All the split dimensions required for the report are prepared in the sources window, similar to the filters. The drag-and-drop editor for the definition of split dimensions is presented in detail in Chapter 7.2, p. 33.
Figure 7.2 Preparing split dimensions
앫 The prepared split dimensions are placed at the appropriate positions in the report structure. Then you drag all those elements for which you want to create contingency tables into the corresponding split dimension, creating separate branches.
7.2 Defining Split Dimensions
The exact structure of the table headers for the contingency tables is defined in a separate drag-and-drop editor. You open this editor by clicking on the Create split dimension icon, or by selecting an existing split dimension and then clicking on Edit. Figure 7.4 shows all relevant functions.
Figure 7.4 Defining split dimensions
앫 Drag the variables used for splitting from the sources window onto the drawing board. All source data and recoding variables are available.
앫 Arrange the variables on the drawing board in the same order and hierarchy as you want them to appear in the table header. It is possible to nest up to three variables.
앫 Via the “Total” drop-down list you can add a “Total” column.
앫 Via the Compact mode and Detail mode tabs you can change the view: In compact mode, only the variables will be displayed. In detail mode, you can also see the answer options.
앫 If you want to change the order of the answer options for a variable, click on the
Arrow icon . The opened dialog allows to rearrange the options, similar to the table editor (figure 9.7).
앫 To change the labeling of a variable or an answer option, click on the respective element: the text will be opened in the input field above the drawing board.
앫 In the “Name” field of the header section, you can change the internal label of the split dimension.
8
Compacting Results
Recoding allows you to compact your survey results or to combine various individual results.
앫 In EFS Reporting +, not only single response questions can be represented in recoding variables, but also multiple response situations (Chapter 8.3, p. 36).
앫 The recoding conditions are formulated using the condition editor that you are already familiar with from the questionnaire editor.
앫 The recoding results can be displayed directly in the report, integrated in filters and split dimensions, or used in other recodes.
8.1 Overview of Recode Configuration
The creation of recodes is largely similar to that of filters and split dimensions.
앫 All the recodes required for the report are prepared in the sources window. – Click on the Create recodes icon in the toolbar as shown in figure 8.1. Then
select the desired recode type (Chapter 8.3, p. 36).
– Define the conditions in the recode editor. The editor is presented in detail in Chapter 8.2, p. 35.
Figure 8.1 Preparing recodes
앫 If you wish to display recoding results in the report, simply drag the respective recodes to their desired positions in the report.
앫 Recoding results often serve as the basis for further recodes, filters, or split dimensions. For this purpose, you can select the recoding variables marked “rec_” for the relevant subsequent recodes, filters, or split dimensions.
Figure 8.2 Recoding variable in the condition editor of a filter
8.2 Defining Recodes
As is the case with the split dimensions, there is a separate editor for recodes. You open this editor by clicking on the Create recodes icon, or by selecting an existing recode and then clicking on Edit. Figure 8.3 shows all relevant functions.
Figure 8.3 Defining recodes
앫 To the left you see a list of the already existing categories.
앫 To edit a category, simply click on it: The recoding condition of that category will be opened in the condition editor. In the input field above, you can change the label of the category.
앫 Via the toolbar, you can create additional categories, delete superfluous ones, or preview the recoding results.
앫 In the “Name” field of the header section, you can change the internal labels of the recodes.
앫 Once you have defined the conditions for all categories, you trigger the recoding process by clicking on Execute.
8.3 Recode Types
In EFS Reporting +, you can realize two types of recodes: simple and multiple recoding.
Simple recoding
Simple recoding is the conventional recode type corresponding to a single response question.
앫 The source data are transferred into a target variable with multiple categories.
앫 Each participant is uniquely assigned to a single category.
앫 When displaying a simple recoding in the report, the same key figures and chart types are available as for a single response question.
In the example shown, the birth years are recoded to age groups.
Figure 8.4 Simple recoding
Multiple recoding
The new, experimantal recode type “multiple recoding” corresponds to a multiple response question.
Do not click on Execute before all categories have been created and all conditions have been defined!
You decide on the recode type to be used when creating new recodes. It is not possible to change the type at a later date.
앫 The source data are transferred into multiple target variables with one corresponding recoding category each. Analog to the answer options of a multiple response question, each category has the codes “1” (“quoted”) and “0” (“not quoted”).
앫 Each participant can be counted once for each category (i.e., assigned to the code “1”).
앫 When displaying a multiple recoding in the report, the same key figures and chart types are available as for a multiple response question.
In the example shown, the age groups created above shall be combined with the participants’ favored holiday destinations. As the participants were able to select
multiple favorite holiday destinations in the questionnaire, a multiple recoding is used, i.e., every possible combination of age group and holiday destination is mapped into its own recoding variable.
9
Configuring Tables
Central to your report are the tables with the result data. EFS Reporting + allows you to optimally adjust the structure and appearance of the tables to your needs:
앫 All important general properties such as table structure, number format etc., can be configured, either for the entire report or for a particular table only (Chapter
9.2, p. 39, 9.3, p. 41, 9.6, p. 46).
앫 You can choose from a variety of key figures and aggregations (Chapter 9.4, p. 42). Calculation is performed automatically.
앫 You can decide for yourself if and in which calculations missing values shall be included (Chapter 9.5, p. 45).
앫 Table-specific details such as labels or positions of answer options can be edited (Chapters 9.7, p. 47 through 9.10, p. 48).
9.1 Overview of Table Configuration
Figure 9.1 shows a table created with EFS Reporting + and its key elements.
Figure 9.2 shows you where to find the functions for editing tables.
앫 In order to make general settings such as the table structure or number format for the entire report, use the Report->Report settings menu. If you wish to apply the changes to all existing tables, save your settings by clicking on the Save all button. 앫 If you wish to change general settings such as the table structure or number
format for the current table only, a click on the Settings icon in the workpad toolbar will take you to the table-specific dialog.
앫 If you wish to change a particular text or move a particular answer option within the current table, you open the table editor by clicking on the Edit icon in the workpad toolbar (see figure 9.5).
Figure 9.2 Table configuration options
9.2 Defining the Table Structure
You can decide for yourself how your evaluation tables are to be structured. By default, they contain columns for code, frequencies, and percentages, with the “Total” row displayed below the various answer options. However, if necessary, you may disable certain columns or move the “Total” row above the answer options, as is usual in the Anglo-Saxon world.
You will find the respective display options by following these click paths:
앫 For the entire report: Menu Report->Report settings->Tab Table display->Section “Display options for tables”
The evaluation table may vary slightly, depending on the question type. For open-ended questions, only the participants’ answers are listed.
앫 For individual tables: Workpad toolbar->Settings->Tab Table display->Section “Display options for tables”
Figure 9.3 Editing the table structure for an entire report or for individual tables
Option Meaning
Show code in tables If this checkbox is ticked, the “Codes” column will be displayed. Please note: Depending on the question type and situation, the display of codes may not be advisable. For example, for each answer option of multiple response questions (121, 362, 521, 522, 621, and checkbox matrix 362) there is always a corresponding variable with the code “0” “1”. You should check, therefore, whether it may be more practical to hide the codes for these question types.
Show row percentage in split dimensions
If you have inserted a “Total” column in a contingency table and this option is activated, the percentages in the “Total” column are calculated by summing up all percentages in the respective row.
If this option is deactivated, the percentages in the “Total” column show which percentage of the base falls upon the respective row.
Show columns Via the drop-down list you can control which columns will be displayed. The following options are available:
• Show frequencies and percentages (default) • Show frequencies
• Show percentages Only for report settings:
Always insert Total on first position
If this checkbox is ticked, the “Total” row will be inserted above the answer options and not below. This is the typical mode of display in the Anglo-Saxon world.
As this option makes sense for the entire report only, it is only available in the Report settings menu.
9.3 Displaying Useful Information
Information from the questionnaire editor that is helpful for understanding the evaluation, such as fill-in instructions, internal variable names, and question types, can be hidden and displayed at will.
You will find these display options by following the click paths shown in figure 9.3:
앫 For the entire report: Menu Report->Report settings->Tab Table diplay->Section “Display options”
앫 For individual tables: Workpad toolbar-> Settings->Tab Table display->Section “Display options”
Figure 9.4 Displayable information
Option Meaning
Show question text The question text will be displayed.
You can edit the question text in the table editor (Chapter 9.7, p. 47). Show fill-in instructions The fill-in instructions will be displayed.
You can edit the fill-in instructions in the table editor (Chapter 9.7, p. 47). Show base description In standard configuration, the header sections of all tables and charts of the report will show the respective base. You can disable the display by unticking the checkbox.
If you wish to change the default labeling of the base field, you can do so in the Report->Report filter menu (Chapter 6.2, p. 25).
Only for report settings: Number each table in report
The tables will be numbered consecutively.
As this option makes sense for the entire report only, it is only available in the Report settings menu.
9.4 Adding Key Figures and Aggregations
EFS Reporting + provides a variety of key figures and aggregations which you can insert in your tables with only a few clicks.
Table 9.3 presents all key figures and aggregations.
앫 The columns “Report” and “Table” you which key figures can be inserted automatically anywhere in the report and which can be defined only with respect to a specific question.
앫 The column “Question types” shows the question types and recode types for which key figures are available. Whether it is practical to use these key figures depends on the actual answer options.
앫 You can decide for yourself whether user-defined missing values and code “0” shall be taken into account when calculating the key figures. The corresponding options are described in Chapter 9.5, p. 45.
You will find the functions for adding key figures here:
앫 For the entire report: Menu Report->Report settings->Tab Table display->Section “Automatically added statistical values” (figure 9.3)
앫 For individual tables: Workpad toolbar->Edit->Bottom edit bar of the table editor (figure 9.5)
Show internal variable names
The internal variable names of EFS will be displayed.
Show question type The question type will be displayed. (Cont.)Option Meaning
Figure 9.5 Adding key figures in the table editor Key figure Report Table Question types Meaning Total x x Single response
(111, 112, 113, 131, 132, 511, 611), matrix (311, 312, 313, 351, 361, 364, 611), semantic differential (340), scroll bar (341, 342), ranking (411), simple recoding
The sum of the frequencies or percentages of all answer options.
Hidden answer options will be included, answer options deleted from the table will not be included.
If you wish to display the “Total” above the evaluation of the individual answer options, as is common in the Anglo-Saxon world, simply use the option “Always insert “Total” on first position” in the Report settings menu (table 9.1).
Population The sum of the frequencies or percentages of all answer options and all missing value types.
Mean x x Single response, matrix, simple recoding
The sum of the individual values of a data bundle, divided by their number.
Median x x Single response, matrix, simple recoding
The middle value of a data bundle ordered by size, i.e., that value below and above which there is the same number of data values.
Quantile - x Single response, matrix, simple
recoding
The value below which lies a specified fraction of the values in a data bundle.
• It is stated in terms of so-called p-quantiles. The value of the p-quantile is that value which separates the lower p * 100 percent of the data values of the distribution from the upper (1-p) * 100 percent. • p is configurable: p must lie between “0.01” and “1”. Example: The quantile “0.3” is that value below which there are 30 percent of all cases of a distribution. Top box x x Single response,
matrix, simple recoding
Accumulated frequencies and percentages of the n answer options with the lowest code. The answer options with the lowest code often also have the lowest sorting numbers, which is why they are top of the list. Hence the name “top box”.
The number n of the answer options to be aggregated can be configured. n must lie between 0 and 100.
Bottom box x x Single response, matrix, simple recoding
Accumulated frequencies and percentages of the n answer options with the highest code.
The number n of the answer options to be aggregated can be configured. n must lie between 0 and 100.
Standard deviation x x Single response, matrix, simple recoding
Square root of the variance of a data bundle. The variance is a measure of the average distance of the individual values from the mean. Extracting the square root yields a value of the same measuring unit as the data values, i.e., you can represent the standard deviation in a chart together with the data values, for example. Standard error x x Single response,
matrix, simple recoding
The variation of the data values around the unknown “true value” in the population. The greater the standard error, the wider the confidence interval containing the “true value” with the specified probability.
Base x x Single response,
matrix, mulitple response (121, 362, 521, 522, 621 and checkbox matrix 362), simple recoding, multiple recoding
The number of participants that have viewed the page containing the question (question base).
If you wish to display the base above the evaluation of the individual answer options, as is common in the Anglo-Saxon world, simply move the row to the topmost position (Chapter 9.10, p. 48). System missings (code -77) x x Single response, matrix, multiple response, simple recoding, multiple recoding
Participants that have not seen the question.
If a participant has not seen a question due to filtering or premature termination, for example, the corresponding variable or variables will be automatically filled with the missing value “-77”.
Please note that you cannot insert system missings into charts. The handling of missings in charts is predefined and cannot be manipulated (Chapter 10.1, p. 50). (Cont.)Key figure Report Table Question types Meaning
9.5 Controlling the Inclusion of Missings
You can decide for yourself whether missing values shall be included in the calculation of the total or other key figures (table 9.3).
You will find the respective options by following these click paths:
앫 For the entire report: Menu Report->Report settings->Tab Missings 앫 For individual tables: Workpad toolbar->Settings->Tab Missings Not answered (code
0)
x x Single response, matrix, simple recoding
Participants that have seen, but not answered, the question.
If a participant has seen a question without answering it, the corresponding variable or variables will be filled with the missing value “0”.
When displaying participants with code “0” in the tables, please check whether these should also be included in the calculation of the total or of statistical values. You will find the respective functions in the Settings dialog on the Missings tab (Chapter 9.5, p. 45).
User-defined missings
x x Single response, matrix, simple recoding
By default, answer options that have been marked as missing values in the questionnaire editor will not be displayed in the tables. This function allows you to display these options.
When displaying options marked as missing (e.g. “No selection”) in the tables, please check whether these should also be included in the calculation of the total or of statistical values. You will find the respective functions in the Settings dialog on the Missings tab (Chapter 9.5, p. 45).
Inside title - x Single response, matrix, multiple response, simple recoding, multiple recoding
Manually created inside titles which may be used to organize a list of answer options, for example. Please note: Inside titles or group items created in the source question in the questionnaire editor will not be included in the reports.
Net x x Multiple
response, multiple recoding
Net participation.
The net participation indicates how many participants have answered a multiple response question, or particular answer options of that question, respectively. Thus, the aggregation shows how many participants have selected at least one answer, and not how many answers have been selected how many times altogether.
Optionally, you can aggregate several related answer options and then have the net participation calculated for this particular aggregation. For each aggregation, the participants will be counted only once.
Please note that the Missings tab is not available for charts. The handling of mis-sings in charts is predefined and cannot be manipulated (Chapter 10.1, p. 50).
(Cont.)Key figure Report Table Question types Meaning
9.6 Formatting Numbers
You can decide for yourself how to format the numbers in your tables. You will find the formatting options by following these click paths:
앫 For the entire report: Menu Report->Report settings->Tab Numerary 앫 For individual tables: Workpad toolbar->Settings->Tab Numerary
Option Meaning
User-defined missings are included in the calculation of “Total”
By default, answer options that have been marked as missing values in the questionnaire editor will not be included in the calculation of the total number. They will be included if you tick this checkbox.
User-defined missings are included in the calculation of statistical values
By default, answer options that have been marked as missing values in the questionnaire editor will not be included in the calculation of statistical values. They will be included if you tick this checkbox.
Participants “Not answered” (code 0) are included in the calculation of “Total”
By default, participants that have seen a question without answering it (code “0”) will not be included in the calculation of the total number. They will be included if you tick this checkbox.
If a participant has seen a question without answering it, the
corresponding variable or variables will be filled with the missing value “0”.
Participants “Not answered” (code 0) are included in the calculation of statistical values
By default, participants that have seen a question without answering it (code “0”) will not be included in the calculation of statistical values. They will be included if you tick this checkbox.
Table 9.4 Inclusion of missings
Option Meaning
Category Available are frequencies, percentages, and all key figures and aggregations from table 9.3 where the use of decimal places makes sense.
Number of decimal places Numbers may have either no decimal place or up to ten decimal places. Decimal separator Definition of the decimal separator.
Possible formats: • Comma • Period Rounding Possible settings:
• Normal rounding: If the first digit in the first decimal place to be eliminated is a 4 or less, the number will be rounded down (21.1 -> 21). If the first digit in the first decimal place to be eliminated is a 5 or greater, the number will be rounded up (21.7 -> 22).
• Round up: Numbers are always rounded up. Thus, if all decimal places are to be eliminated, the number will be rounded up to the next higher integer (21.1 -> 22). If decimal places are desired, then all values after the last desired decimal place will be ignored, and the number will be rounded up to the next higher integer (21.71 -> 22).
• Round down: Numbers are always rounded down. Thus, if all decimal places are to be eliminated, the number will be rounded down to the next lower integer (21.1 -> 21). If decimalplaces are desired, then all values after the last desired decimal place will be ignored (21.71 -> 21).
9.7 Changing Texts
The texts used in tables and charts can be changed as desired. Figure 9.6 shows the texts and the corresponding text fields in the table editor.
Follow this click path: Workpad toolbar->Edit.
Figure 9.6 Editing texts in the table editor
Thousand separator Definition of the thousand separator. Possible formats: • No separator • Comma • Point • Space • Apostrophe
You can change the labeling of the base in the Report->Report filter menu (Chapter
6.1, p. 24).
(Cont.)Option Meaning
9.8 Changing Codes
Codes can be changed as desired. To do so, you only need to change the values in the “Code” column of the table editor (see figure 9.6).
Thus, an integral, positive scale can be modified to be centered around the zero point. Questionnaire editor: 1, 2, 3, 4, 5 -> EFS Reporting + : -2 -1 0 1 2.
To open the table editor, follow this click path: Workpad toolbar->Edit.
9.9 Re-sorting Answer Options
By default, the answer options in tables and charts are sorted in the order of the questionnaire editor (“number”). If necessary, however, you may re-sort the answers. To do so, follow this click path: Workpad toolbar->Settings->Tab Table display -> Section “Sort”.
9.10 Moving, Hiding, Or Deleting Individual Anwer Options
Apart from being re-sorted, answer options and scale dimensions may also be moved to another position, hidden, or deleted altogether. Figure 9.7 shows the corresponding functions of the table editor.
Follow this click path: Workpad toolbar->Edit.
Option Meaning
Criterion Answers may be sorted by the following criteria: • Answer option: the text of the answer option.
• Code. Please note: Depending on the question type and situation, the sorting by codes may not be advisable. For example, for each answer option of multiple response questions (121, 362, 521, 522, 621, and checkbox matrix 362) there is always a corresponding variable with the code “0” or “1”. Especially for multiple response questions you should therefore choose a more appropriate criterion.
• Frequency
• Number in EFS: the position defined in the questionnaire editor (“number”).
Order The following options are available: • Ascending
• Descending Table 9.6 Sorting of tables
If you wish to exclude any particular answer option from being re-sorted, you can simply lock it. See Chapter 9.10, p. 48.
Figure 9.7 Moving individual answer options
Option Meaning
Changing the order As shown in figure 9.7, use the mouse pointer to drag the answer option to its desired position. When the green bar lights up, you can drop the answer option.
Hiding an answer option The answer option will be hidden but included in calculations. If you click on Show, the answer option will be displayed again.
Locking / unlocking selection
If you wish to exclude any particular answer option from being re-sorted, you can simply lock it.
This is useful, for example, if the positions of any particular answer options (“No answer”) or key figures (“Total number n”) shall remain unchanged when sorting.
Deleting an answer option The answer option will be deleted from the table completely. It will no longer be included in any calculations.
Please note: This action cannot be undone. If you inadvertently delete an answer option, the table must be created anew.
10
Creating Charts
Charts help you visualize the central findings of your evaluation. EFS Reporting + offers you a large variety of options:
앫 The most popular chart types are available in several versions (Chapters 10.2, p. 52
and 10.3, p. 52).
앫 Important chart properties such as color scheme, legend, etc. can be customized (Chapter 10.4, p. 53).
앫 All the general settings that you already know from the tables, such as number format or display of additional information, are also available for charts.
10.1 Overview of Chart Configuration
Figure 10.1 shows a chart created with EFS Reporting + and its key elements.
Figure 10.1 The structure of a chart
The creating and configuring of charts is largely similar to that of the already familiar tables. Figure 10.2 shows you where to find all relevant functions.
The appearance of the chart varies according to question type, chart type, and selected settings.
Figure 10.2 Chart configuration options
앫 To convert a table into a chart, you open the Charts menu in the workpad toolbar and select the desired chart type.
앫 If you wish to enlarge a chart, e.g. to check the values or the legend, all you need to do is to double-click on the chart: It will then be opened in an additional window.
앫 All chart-specific setting options, such as color schemes or the display of legends, are combined in the Charts->Chart settings menu.
앫 General settings such as the number format or the display of additional information are made via the dialogs already familiar from the tables, either for the entire report (Report->Report settings menu) or for a specific chart (Settings icon of the workpad toolbar), as required. The only exception is the Missings tab, which is not available for charts: The handling of missings in charts is predefined, see the info box below.
앫 If you wish to change texts or the sorting order of answer options, you open the equally familiar table editor by clicking on the Edit icon of the workpad toolbar.