SUMMER OUTLOOK
& WINTER REVIEW
2015/2016
31st May 2016
Page 2 of 166
Content
SUMMER OUTLOOK REPORT 2016 AND WINTER REVIEW 2015/2016 ... 1
1. INTRODUCTION ... 4
2. EXECUTIVE SUMMARY ... 6
3. METHODOLOGY ... 10
3.1. A CONTINUOUSLY IMPROVING ADEQUACY METHODOLOGY ... 10
3.2. SEASONAL OUTLOOKS REPORTS ARE BASED ON TSO EXPERTISE INPUTS ... 10
3.3. GENERAL ADEQUACY APPROACH ... 11
3.3.1. UPWARD ADEQUACY ANALYSIS ... 11
3.3.2. DOWNWARD ADEQUACY ANALYSIS ... 12
3.4. ADEQUACY ANALYSES ... 13
3.4.1. REGIONAL ANALYSIS (UPWARD AND DOWNWARD ADEQUACY) ... 14
3.4.2. PROBABILISTIC ANALYSIS FOR REGIONS OR COUNTRIES AT RISK ... 16
3.5. DATA PROCESSING ... 16
3.5.1. SYNCHRONOUS POINTS IN TIME FOR REGIONAL ANALYSIS ... 16
3.5.2. RENEWABLES INFEED DATA ... 17
3.5.3. LOAD SCALING ... 18
4. SUMMER OUTLOOK 2016 ... 20
4.1. A CONTEXT OF DECREASING FLEXIBLE GENERATION CAPACITY ... 20
4.2. MAIN REGIONAL ADEQUACY RISKS IDENTIFIED FOR THE COMING SUMMER ... 21
4.3. REGIONAL UPWARD ADEQUACY ASSESSMENT ... 22
4.3.1. UPWARD REGULATION UNDER NORMAL CONDITIONS ... 23
4.3.2. UPWARD REGULATION UNDER SEVERE CONDITIONS ... 29
4.4. PROBABILISTIC SENSITIVITY ANALYSIS FOR COUNTRIES OR REGIONS AT RISK ... 35
4.5. DOWNWARD REGULATION MARGINS ... 37
5. WINTER REVIEW 2015/16 ... 45
5.1. GENERAL COMMENTS ON PAST WINTER CLIMATE ... 45
5.2. SPECIFIC EVENTS AND UNEXPECTED SITUATIONS DURING PAST WINTER ... 45
5.3. SYSTEM ADEQUACY CONDITIONS IN EUROPE ... 45
6. APPENDICES ... 47
APPENDIX 1:INDIVIDUAL COUNTRY COMMENTS ON THE SUMMER OUTLOOK 2016 ... 47
APPENDIX 2:INDIVIDUAL COUNTRY COMMENTS ON THE WINTER REVIEW 2015/16 ... 128
APPENDIX 3:DAILY AVERAGE TEMPERATURES FOR NORMAL WEATHER CONDITIONS – REFERENCE SETS ... 156
Page 3 of 166
Page 4 of 166
1.
Introduction
ENTSO-E and its member TSOs analyse potential risks to system adequacy that is the possibility for a power system to meet demand at all times and thus guarantee security of supply, for the 35 countries that are part of the network (including Turkey that joined ENTSO-E in 2015 as Observer member) plus Albania and the Burshtyn Island in Ukraine. The Burshtyn Island is covered in adequacy assessments as it is connected with the electrical system of continental Europe.
These analysis are done ahead of each critical season – that is seasons where weather conditions can be extreme and strain the system. ENTSO-E thus publishes before 1 June its Summer Outlook and before 1 December its Winter Outlook. Additionally ENTSO-E publishes an annual mid-term adequacy forecast – formally known as SOAF – that looks at system adequacy for the next decade. The MAF is put to public consultation in June and published in September.
Each seasonal outlook is accompanied by a review of what happened during the previous season. The Summer Outlooks are thus released with the Winter Reviews. The Winter Outlooks with the Summer Reviews. This allows for a check of what was forecast and what actually took place with regard of system adequacy.
The ENTSO-E system adequacy forecasts are presenting the views of the TSOs on risks to security of supply and also the countermeasures they plan, either individually or in cooperation with neighbouring TSOs.
Data is collected from TSOs and analysed using a common methodology based on high and internationally recognised standards in such exercises. For maximum accuracy ENTSO-E uses in its assessment the Pan-European Climate Database (PECD) to determine the level of solar and wind generation on a specific date and time.
ENTSO-E analyses the impact on system adequacy of climate conditions, planned outages, evolution of demand, demand management, evolution of generation capacities and system stability issues.
Page 5 of 166
In addition, an assessment of ‘downward regulation’1 issues is performed. Downward
regulation is a technical term used when analysing the influence on the security of a power system when there is an excess in generation which cannot be reduced, typically when the wind is blowing at night when demand is really low or when the wind and sun generation are high but demand is not, for example a sunny Sunday.
The Summer Outlook analyses are performed by individual country, at pan-European level looking at how neighbouring TSOs can contribute to the power balance of a power system under strain. Finally, additional probabilistic analysis are performed for countries where a system adequacy risk has been identified.
They are done for each week between 1 June and 2 October 2016. The winter review looks at the system adequacy issues registered between 1 December 2015 and 3 April 2016. The aim of publishing this forecast is two-fold:
1) It is to gather information from each TSO and share it within the community. This allows for neighbouring TSOs to consider actions to support a system which may be in difficulty. Also all TSOs share with one another the remedial actions they intend to take within their control areas. This information sharing contributes to increase security of supply and encourages cross-border cooperation.
2) The publication also informs stakeholders of potential risks to system adequacy. The goal is to raise awareness and hopefully incentivise stakeholders to adapt their actions to reduce these risks by for instance reviewing the maintenance schedules of power plants, the postponement in decommissioning and other risk preparedness actions.
ENTSO-E’s seasonal outlooks are one of the associations’s legal mandates under Article 8 of EC Regulation n. 714/2009.
Page 6 of 166
2.
Executive summary
The Summer Outlook 2016 @ a glance
The analysis performed by ENTSO-E shows that all considered Europe has sufficient generation to meet normal and severe demand conditions in the summer of 2016.
Various countries may have to rely on imports to cover demand but available cross-border capacities are expected to be sufficient in all conditions to accommodate them at the exception of Poland where security of supply might be at risk under severe conditions. Similarly, Great Britain might reach its maximum import capacity if severe conditions occur in the second half of September.
The decline in traditional net generation capacity continues. And as already identified in the Winter Outlook 2015/16, this decline is not compensated by the growth in net variable generation capacity.
Polish system adequacy still at risk
The risks to system adequacy in Poland that were already observed during the summer of 2015 could be repeated in 2016.
ENTSO-E’s Summer Outlook 2016 identifies that during severe conditions, there is a risk that Polish import needs may exceed its available import capacity. In particular capacities on the synchronous profile2 with Germany, the Czech Republic and Slovakia are significantly
limited due to high unscheduled flows through Poland, from its Western border towards the South. These flows are the result of market transactions concluded outside of Poland and are very often causing a violation of the N-1 criteria3, as proven on 15 September 2015 (N-1
2 A profile is a geographical boundary between one bidding zone (area where electricity is traded without capacity allocation) and several neighbouring bidding zones. Synchronous means it is managed at the same time.
3 N-1 is a European standard in transmission system operation by which the TSOs have to guarantee that their system will run safely even with one generator/asset down
Page 7 of 166
not fulfilled for 4 hours). To decrease the risk of not fulfilling N-1 criteria4, and to allow
increasing commercial transmission capacities to Poland, PSE (the Polish TSO) and 50Hertz (one of the four German TSOs, from East Germany) agreed to exceptionally and temporarily disconnect one of the two interconnection lines between the two countries until it is upgraded to 380kV and equipped with a phase shifter5.
This however is a temporary topological measure. It aims at mitigating the negative impact of unscheduled flows only, but it is not solving the origin of the problem of unscheduled flows. The sustainable solution, by means of structural market improvement (that is flow-based mechanism for coordination of capacity calculation in relevant regions with properly configured bidding zones), needs to be implemented as soon as possible. Since this sustainable solution cannot be implemented before 2018, interim actions need to be developed in TSC, TSO Security Cooperation6.
Also Great Britain system might be constrained under severe conditions during the second half of September, notably in week 38. Indeed, the simulations during this week 38 show that Great Britain will have to rely on almost its maximum imports capacity. In extreme cases without wind and with low temperature, situation in Great Britain could potentially be very tight even with maximum imports from neighbour countries. However, such conditions have a very low probability of occurring, and even if they did occur, there are still several options available to meet demand. For instance, these may include using system operational reserves, a response from the market that could result in some imports from Irish interconnectors or generators shifting outages.
Evolution of generation capacity in Europe
4 N-1 is a European standard in transmission system operation by which the TSOs have to guarantee that their system will run safely even with one generator/asset down
5 Common, PSE and 50Hertz press release: http://www.pse.pl/index.php?dzid=32&did=2908&lang_id=2
6 TSC like Coreso is one of the Regional Service Coordinators, RSC, which will roll out in the whole of Europe by
Page 8 of 166
The trend of declining dispatchable7 generation capacity in Europe, as mentioned in previous
seasonal outlook reports, is continuing. On one hand, renewable installed capacities, mainly wind and photovoltaic, continue to grow strongly.
Compared to last summer, the global net generating capacity in Europe has even slightly decreased which seems to indicate that traditional generation units are being decommissioned at a faster rate than renewable energy sources are being installed.
*see footnote for details of data considered for this graph8
Despite this, thanks to the highly interconnected European electricity network, the net importing9 regions will be able to import from neighbouring countries. The European grid allows the necessary flexibility to transport the energy from generation to demand areas.
7 Dispatchable generation means generation plant that can be turned on and off or adjust their output at the request of the transmission system operator or the plant owner.
8 It needs to be noted that the quoted quantities are net generating capacities; outages or the availability are not
taken into account in the above graph. In particular wind/solar availability in hours per year, possible increased outage rate due to ageing of the conventional fleet, mothballing of gas plants due to market conditions, are not considered in the above figure 4, but are taken into account in the adequacy assessment,
Page 9 of 166
Using the interconnection flexibility, installed demand side management and strategic reserve measures, the adequacy for the coming summer should be met for most European countries.
Result of the downward regulation assessment
In addition, throughout the summer period a ‘downward regulation’10 assessment was
performed to assess the constraints generated by an excess of renewable and non-dispatchable conventional generation when demand is low. This could occur typically on weekend nights (low demand combined with high wind) or on weekend days (limited demand combined with high photovoltaic generation and high wind).
The present report highlights that during certain weeks over the summer period it may
be necessary to export generation in excess to various countries. Furthermore, in some countries it might even be required to reduce excess generation due to insufficient cross-border export capacity.
This later risk is limited to Germany and Belgium. Germany might be concerned - during daytime only - due to photovoltaic generation. Belgium might lack export capacity during some weeks in July and August, as its nuclear power availability is expected to be at its maximum in this period with a reduced availability of the pumping capacity. In some specific cases additional measures may be needed (for example modulation on nuclear units or optimisation of export capacity), in order to avoid curtailing the output of renewable energy sources.
9 Net importing regions are regions that need to import electricity from other power systems to cover their demand in average
Page 10 of 166
3.
Methodology
3.1. A continuously improving Adequacy Methodology
The integration of large amounts of Renewable Energy Sources (RES), the completion of the internal electricity market, as well as new storage technologies, demand side response and evolving policies require revisited adequacy assessment methodologies.
ENTSO-E, supported by committed stakeholders, is continuously improving its existing adequacy methodology with a special emphasis on harmonised inputs, system flexibility and interconnection assessments.
ENTSO-E published its Target Methodology for adequacy assessment11 after a consultation
period with the stakeholders, who acknowledged the proposed target methodology. The comments received mainly focused on the adequacy assessment methodology, assumptions, models to be implemented and the need for increased transparency. The Stakeholders’ feedback on seasonal reports are critical and contribute to developing the methodology further.
3.2. Seasonal Outlooks reports are based on TSO expertise inputs
The coordination team that develops the Seasonal Outlook reports is composed of experienced experts from various TSOs all over Europe. At once, the analysis is based on data submitted by each TSO. For the present Seasonal Outlook both qualitative and quantitative data were submitted in March 2016 through a questionnaire. The report presents the TSOs’ views on national and regional matters regarding the security of supply and/or inflexible generation surplus for the coming summer, including the possibility of neighbouring countries contributing to the generation/demand balance of each country in critical situations. The regional analysis is based on coordinated data which are submitted for several synchronous points in time.
11
Page 11 of 166
3.3. General adequacy approach
3.3.1. Upward adequacy analysis
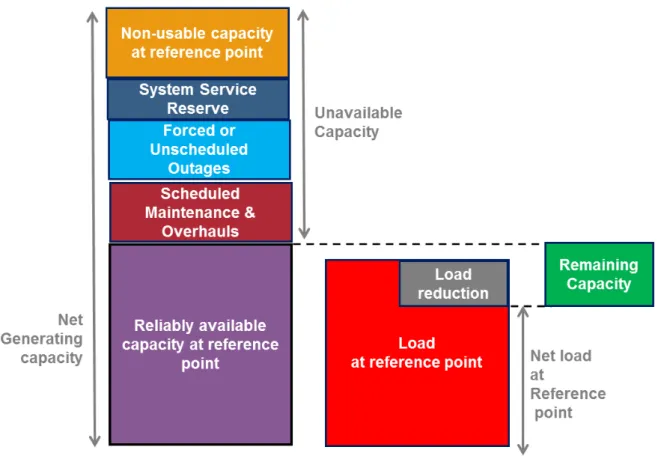
The upward adequacy methodology consists of identifying the ability of generation to meet the demand by calculating the ‘remaining capacity’ under two scenarios:
‘normal conditions’ correspond to normal demand on the system (i.e. normal weather conditions resulting in normal wind production or hydro output and an average outage level); ‘severe conditions’ correspond to extreme weather conditions in terms of demand (higher than in normal conditions) and in terms of reduced generation output (i.e. severe conditions resulting in lower wind or restrictions on classical generation power plants).
The methodology is schematically depicted in the figure below12:
Figure 1: Upward adequacy methodology
Page 12 of 166
The figures included in the per-country analysis show the ‘Net Generating Capacity’, the ‘Reliably Available Capacity’ and the ‘Net Load’ under normal and severe conditions. The remaining capacity is then calculated for normal and severe conditions.
The NTC values represent an ex-ante estimation of the seasonal transmission capacities of the joint interconnections on a border between neighbouring countries, assessed through security analyses based on the best estimation by TSOs of system and network conditions for the referred period.13 All contributors were asked to provide a best estimate of minimum
NTC values, being used as the basis for a worst-case analysis. When two neighbouring countries provided different NTC values on the same border, the lowest value was used. Additionally, for the regional analysis, simultaneous importable and exportable limits are considered to limit the global imports or exports of a country. These simultaneous limits were also reported by the contributors if applicable.
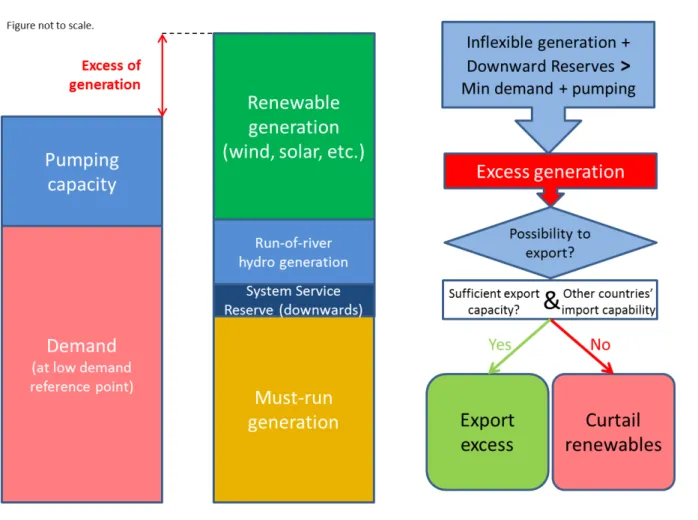
3.3.2. Downward adequacy analysis
Under minimum demand conditions, countries could potentially have an excess of inflexible generation running. Every TSO is likely to have varying levels of ‘must-run’ generation. This may be Combined Heat and Power (CHP) units or generators that are required to run to maintain dynamic voltage support, etc. In addition, there is renewable generation such as run-of-river hydro generation, solar and wind power, whose output is inflexible and variable. At times of high renewable output, the combination can result in generation exceeding demand plus the pumped storage capacity of the country. In that case, the ‘excess’ generation is either exported to a neighbouring region or curtailed.
The methodology is schematically depicted in the figure below:
Page 13 of 166
Figure 2: Downward adequacy methodology
For countries that have a generation excess, the optimisation in the regional analysis tries to export the excess power to neighbouring regions in deficit, by use of the best estimate of the minimum NTC values submitted, and via a constrained linear optimisation.
The analysis will highlight periods in which groups of countries cannot export all of their excess generation. It should be again stressed that this analysis is not a market simulation. Rather, it is a feasibility analysis to indicate countries that may be required to curtail excess generation due to limited cross-border export capacity.
This analysis becomes more and more essential as a number of TSOs experience growing system operation constraints due to an increase of variable generation on the system (wind and solar) and the lack of flexible generation.
Page 14 of 166
3.4.1. Regional analysis (upward and downward adequacy)
The regional analysis is based on a constrained linear optimisation problem14. The goal is to
detect if problems could arise on a Pan-European scale due to a lack of available capacity (upward adequacy) and to provide an indication of whether countries requiring imports will be able to obtain these across neighbouring regions under normal and severe conditions, as well as from which countries the needed energy might originate from. In case a potential shortage is detected in one or more countries, the potential curtailment will be equally shared. In other words, the curtailed energy to initial remaining capacity ratio will be equal among those countries. At present, the distribution of curtailed energy follows much more complex rules, which can lead to significantly different distributions of curtailed energy. The regional analysis consists of several steps.
The first element that is checked is whether in a ‘copperplate’ scenario there is enough power capacity to cover the demand. Here, all remaining capacity is simply added, and when the result is greater than zero, theoretically enough capacity is available in Europe to cover all countries’ needs. No problems are expected using this approach, either for normal or severe conditions. As this method does not take into account the limited exchange capacity between countries, it is too optimistic to draw final conclusions based on it.
As a consequence of this, a second, more precise approach is taken. The problem is modelled as a linear optimisation with the following constraints:
- Bilateral exchanges between countries should be lower than or equal to the given NTC values;
- Total simultaneous imports and exports should be lower than or equal to
the given limits.
Based on this methodology, it was calculated which groups of countries would have a generation deficit for a certain week due to saturated cross-border exchanges.
For neighbouring systems of the study geographic perimeter that are not modelised in detail, like Morocco, Russia, Belarus, the Ukraine (except the Burshtyn Island, which operates
14Linear optimisation is a method to achieve the best outcome (such as maximum profit or lowest cost) using a mathematical model
Page 15 of 166
synchronously with Continental Europe), the following values were assumed for the regional analysis:
- The balance (remaining capacity) of these systems was set at 0 MW.
- A best estimate of the minimum NTC comes from neighbouring systems belonging to ENTSO-E.
This approach will result in the possibility to ‘wheel’ energy through these bordering countries, without them adding to or subtracting from the total generation level of the region. Regarding the linear optimisation problem, two variants can be distinguished: a feasibility simulation and a simplified merit-order simulation.
For most simulations in this outlook report, by default, the feasibility simulation is used. For this simulation, the input used is the calculated remaining capacity of all countries when using the available generating capacity of all generation types.
Besides the upward feasibility, a simplified merit order simulation approach has been also implemented in order to show which countries may be prone to import in a market perspective, even if they do not need import for adequacy reasons.
For the simplified merit-order simulation the approach is slightly different. In this case, an iterative approach is used by gradually adding available generating capacity of different generation types. The simplified merit-order that is used is the following:
1) Solar
2) Onshore Wind 3) Offshore Wind
4) Other Renewable Sources 5) Nuclear
6) Coal 7) Gas
8) Other non-renewable sources 9) Hydro pumped storage
10) Demand side management and strategic reserves
It is important to note that the merit order approach is a simplified approach which does not aim to predict the real market behaviour. Furthermore, the simplified hydro power
Page 16 of 166
modelisation using deterministic capacity-based assessments [MW] and merged modelling of reservoir and run-of-river hydro might not capture all specificities of countries with large share of hydro production (Norway, France, Switzerland, etc.).
3.4.2. Probabilistic analysis for regions or countries at risk
In case the aforementioned regional analysis shows that a country or region (combination of adjacent countries) could experience adequacy issues for a specific time point, this country or region is investigated in more detail.
The goal of this detailed analysis is to detect what the main drivers are of a certain adequacy issue (e.g. temperature in country X, wind or photovoltaic infeed in country Y, etc), and to be able to give an indication of probability of occurrence to a situation.
For every reference time point, the collection of 546 records is used to run 546 different simulations. The following high-level methodology is applied to build each one of those simulations:
• As a starting point, the qualitative data provided by the TSOs for severe conditions is
used;
• Next, the severe conditions load is replaced by normal conditions, average load as
given by the TSOs. For the related reference temperature, the average temperature over all 546 records is used;
• The capacity factors for onshore wind, offshore wind and solar are replaced by those
of the concerned record;
• The normal conditions load is scaled by use of load-temperature sensitivity relations.
The difference between reference temperature and the temperature of the concerned record is translated into ‘increase/decrease’ of load, using the methodology described in section 3.5.
After performing these manipulations on the base data, the simulation is run (including the simulation of cross-border exchanges with other countries), and the results are calculated. In this manner, for every simulation it is determined whether or not the considered region suffers adequacy issues or not.
3.5. Data processing
Page 17 of 166
Several synchronous points in time are collected for all countries to allow for a meaningful regional analysis when determining the feasibility of cross-border flows. Ahead of the data collection, a study15 was conducted using European historical load data to identify the most
representative synchronous time points for the different analyses:
• Upward adequacy analysis - global European peak load in summer:
Wednesday at 12:00 CET (Central Europe Time);
• Downward adequacy analysis - global European minimum load in summer:
Sunday at 05:00 CET;
• Downward adequacy analysis – maximum solar panels generation combined
with low load in summer: Sunday at 11:00 CET.
3.5.2. Renewables infeed data
For the upward adequacy analysis, the renewables infeed is handled through an estimate of non-usable capacity in normal and severe conditions by country. For wind (onshore, offshore) and photovoltaic, the non-usable capacities by default were calculated using a
Pan-European Climate Database. This Pan-European Climate Database contains per
country and per hour, load factors for solar, onshore wind and offshore wind in a fourteen-year period (2000 to 2013). It also includes geographically-averaged hourly temperatures. To create a consistent scenario throughout Europe, the following approach was adopted for a given time:
• All ‘records’ are retained that lie within the interval of one hour before the reference
time and one hour after the reference time, on a date (day/month) from six days before the reference date and six days after the reference date. This yields a collection of 546 (14 years x 13 days x 3 hours) records per reference time point;
• To achieve per country representative load factors for the generation adequacy
analysis, the 50th (average conditions) and 10th (1 out of 10 situations) percentile of
the 546 record collections are respectively calculated for normal and severe
Page 18 of 166
conditions of the capacity factors per country and for solar, onshore wind and offshore wind separately.
As such, consistent Pan-European renewable infeed scenarios are created. For example, the 10th percentile scenario represents a consistent worst-case scenario for the different countries and for the different primary energy sources. It should be highlighted that this approach guarantees a worst-case scenario as it considers a perfect correlation between the different capacity factors, i.e. renewable infeed in all countries is simultaneously assumed to be equal to the 10th percentile. This scenario can then be used to detect regional adequacy
issues that can consequently be investigated in more detail and with a more realistic (and therefore less worst-case) renewable infeed scenario if necessary.
For the downward adequacy analysis, each country was asked to provide an estimate of the highest expected proportion of solar, onshore wind and offshore wind generation. Default values of 65% for wind and 95% for solar were proposed, and countries could also enter an alternative best estimate.
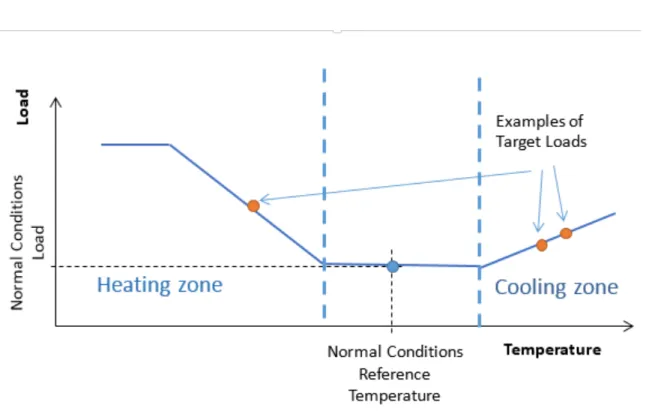
3.5.3. Load scaling
The submitted per-country load data is collected under normal and severe conditions. For each simulation, the per-country load needs to be scaled to a target temperature as given by the Pan-European Climate Database. To this end, ENTSO-E calculated load-temperature sensitivity coefficients. A detailed description on how these coefficients were determined can be found in Appendix 3. During data collection, the TSOs were given the possibility to update the ENTSO-E proposed load sensitivity factors with their best estimate. An ENTSO-E dedicated Task Force was recently launched to improve further the load sensitivity factor data at pan-European level. This will increase consistency of the adequacy studies performed by ENTSO-E.
The graph below shows how these coefficients, combined with the normal load conditions and temperature reference as a starting point, are used to scale the load to the target temperature of the concerned record.
To this end, when temperatures are concerned, the population-weighted average daily temperatures are used. Population-weighted daily average temperatures are considered since they are better suited to assess temperature dependence of demand (see Appendix 3 for details).
Page 19 of 166
Page 20 of 166
4.
Summer Outlook 2016
4.1. A context of decreasing flexible generation capacity
The analysis for the Summer Outlook 2016 confirms the trend of a decreasing of dispatchable generation capacity in Europe. Therefore the risks of adequacy tensions may appear more often in the future.
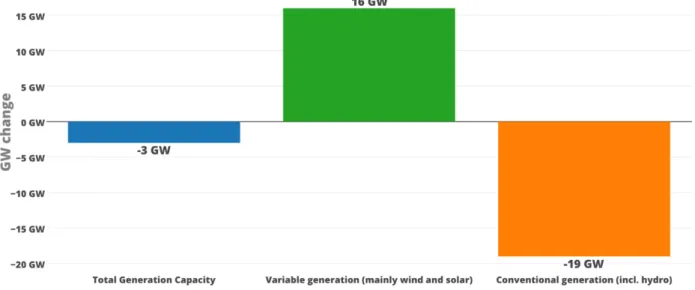
An illustration of the evolution of generation capacity throughout Europe is depicted in the figure below16. The capacity from dispatchable units have strongly decreased compared to
last summer (-19 GW), while the Renewable Energy Sources (RES) capacity increased (+16 GW), causing the total Net Generation Capacity to decrease (-3 GW). In brief, this trend is showing that dispatch units are being decommissioned at a faster rate than Renewable Energy Sources are being installed.
Figure 4: Net Generating Capacity evolution
16 This comparison has been performed on the same perimeter as in the previous Summer Outlook report: Malta and
Page 21 of 166
It needs to be noted that the quoted quantities are net generating capacities; outages or the availability are not taken into account in the above graph. In particular wind/solar availability in hours per year, possible increased outage rate due to ageing of the conventional fleet, mothballing of gas plants due to market conditions, are not considered in the above Figure 4, but are taken into account in the adequacy assessment,
4.2. Main regional adequacy risks identified for the coming summer
The ENTSO-E Summer Outlook Analysis reveals that most countries in Europe would have sufficient generation in both normal and severe conditions. Several of them, though, may have to rely on imports, load reduction measures or the use of strategic reserves to cover their demand.
However, the Polish TSO (PSE) may have a problem balancing the system during the summer if severe conditions occur. In case of severe conditions indeed, there is a risk that Polish import needs may exceed its available import capacity. In particular, the import capacity on the synchronous profile (with DE+CZ+SK) is significantly limited due to high unscheduled flows through Poland, from its Western border towards the South. These flows are the result of market transactions concluded outside Poland and very often cause a violation of N-1 criteria, as proven on 15th September 2015 (n-1 not fulfilled for 4 hours). The
optimum solution concerning unscheduled flows, is structural market improvement (i.e. flow based mechanism for coordination of capacity calculation in relevant region with properly configured bidding zones), which will not be implemented before 2018. In regards to possible generation shortage during severe conditions in the summer 2016, PSE has asked TSOs in
the TSO Security Cooperation (TSC17) area to take interim actions which will allow PSE to
rely on not less than 1000 MW of imports on the synchronous profile (at least in emergency situations) and to ensure enough remedial actions to keep an N-1 security state on the DE-PL border. The interim actions as mentioned above have so far proven been insufficient for summer 2016. Regardless of the above actions within TSC, PSE in cooperation with 50Hertz analysed other bilateral measures possible for timely application, which could reduce
17
The “TSO Security Cooperation” (TSC) is a cooperation initiative of eleven European Transmission System Operators (TSOs) to improve the security of the power grids throughout Central Europe. TSC is one of the Regional Service Coordinators, RSCs, that will cover all of Europe by end 2017. Other existing RSCs include Coreso in
Brussels and SCC in Belgrade. Discussions on a Nordic RSC started in May 2016. See www.entsoe.eu for more
Page 22 of 166
negative impact of unscheduled flows on interconnected system security. The commissioning of the PST in Polish substation Mikułowa is planned in May 2016. This substation refers to Mikułowa-Hagenwerder line, which is one of two cross-border lines between Poland and Germany. In regards to this commissioning, PSE and 50Hertz agreed on the temporary disconnection of the Krajnik-Vierraden, second Polish-German interconnection. This network topology should allow for effective utilization of the PST in Mikułowa border substation. It will therefore allow for maintaining the secure operation of both transmission grids, even in situations causing so far high flows through the German-Polish interconnection and consequently high re-dispatch needs. In addition, steering the physical flow on the remaining Mikułowa-Hagenwerder line by PST operation is expected to allow for increasing commercial transmission capacities in the direction to Poland. Details can be found in PSE / 50Hertz press release: "Disconnection of Krajnik-Vierraden line". Nevertheless, solutions described above are still considered as a temporary measure only aiming to decrease the negative impact of unscheduled flows but not solving the origin of unscheduled flows problem.
Also, but to a lesser extent, the Great Britain system might be constrained under severe conditions during the second half of September, notably in week 38. Indeed, the simulations during this week 38 show that Great Britain will have to rely on almost maximum imports capacity from its neighbour countries.
4.3. Regional upward adequacy assessment
A regional assessment of the upward regulation was performed. For the generation adequacy analysis, infeed from wind and solar was calculated from the Pan-European Climate Database (Cf. section 3.5.2) to achieve a consistent scenario of renewable infeed over Europe.
It is important to emphasise that the scenarios evaluated in the regional assessment represent conditions that are significant to and realistic for the European system as a whole. Therefore they may differ from the scenarios evaluated in each individual country perspective analysis, which correspond to conditions significant and realistic for each country. For example, the severe conditions of the entire European System do not correspond to the ‘simple envelope’ of each individual severe condition.
Page 23 of 166
4.3.1. Upward regulation under normal conditions
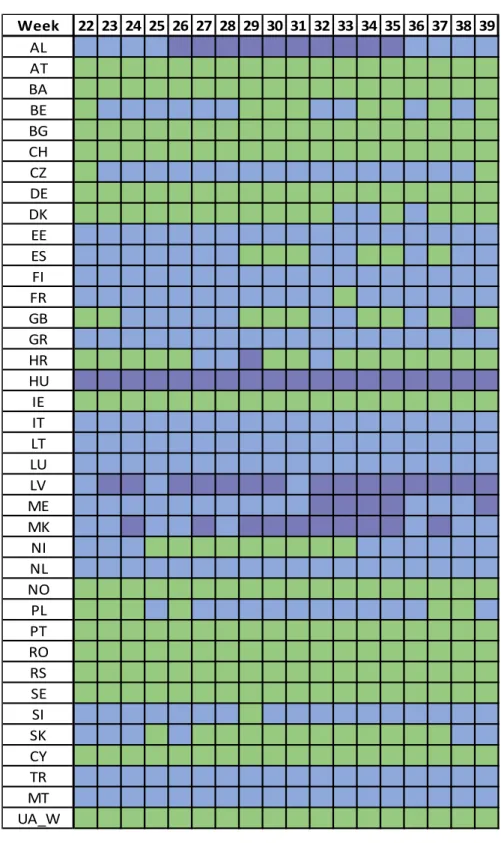
Based on normal conditions for generation and demand, the majority of countries do not require imports at the synchronous reference time points, as shown pictorially in the Table 1.
It is also shown in Figure 5. It should be noted that for these simulations, the demand
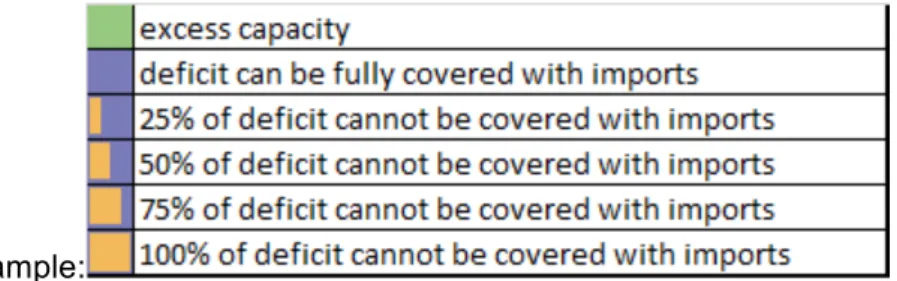
reduction measures and available strategic reserves are taken into account as reported by the TSOs. Where a country is coloured green, it has excess capacity to meet demand and reserves. The countries that are fully coloured in purple can cover their deficit with imports, whereas the regional analysis revealed that for the countries that show partial orange results, their deficit cannot be fully covered with imports due to insufficient reported cross-border exchange capacities or a lack of energy. The portion of the cell that is coloured in orange reflects the portion of the deficit that cannot be covered with imports.
For example:
Page 24 of 166
Figure 5: Generation adequacy map under normal conditions
Week 22 23 24 25 26 27 28 29 30 31 32 33 34 35 36 37 38 39 AL AT BA BE BG CH CZ DE DK EE ES FI FR GB GR HR HU IE IT LT LU LV ME MK NI NL NO PL PT RO RS SE SI SK CY TR MT UA_W
Page 25 of 166
Simplified merit order approach
While the majority of regions do not require imports for adequacy reasons, the markets will determine the economic energy transfers based on the respective price differentials between regions, so various borders may be transmitting power at their maximum capacity.
As indicated in the description of the methodology, a simplified merit order analysis was also conducted to provide an indication of the countries which will probably import energy from a market point of view. Different from the table above, which shows the import needs from an adequacy perspective (using a ‘feasibility simulation’), Table 2 shows the countries which are prone to import from a market point of view for next summer under normal conditions. The
No need for energy import Imports needed for some weeks Imports needed all summer long
Normal Conditions: import needs
Page 26 of 166
countries and weeks that do not require imports from an adequacy perspective, but are prone to import due to market conditions, are coloured in light blue.
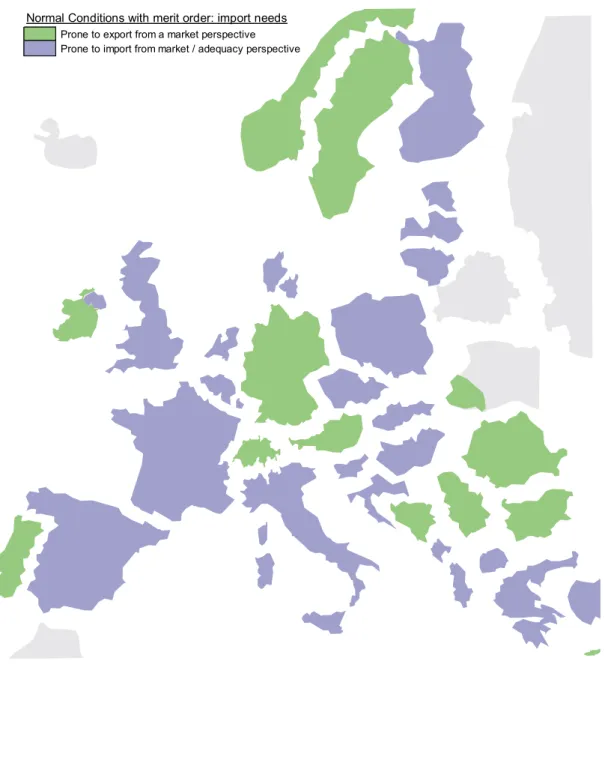
Figure 6 shows which countries are prone to such a market-based importing position for some or all weeks under normal conditions.
It is important to note that the merit order approach is an assumption and that the following Table 2 and Figure 6 may not represent the real market situations. Especially the current hydro power simplified modelisation with deterministic capacity-based assessments [MW] may not represent the market reality of countries with high penetration of reservoir hydro with natural feed-in (Norway, France, Switzerland, etc.).
Page 27 of 166
Table 2: Countries prone to market-based imports at peak time under normal conditions
Legend: Week 22 23 24 25 26 27 28 29 30 31 32 33 34 35 36 37 38 39 AL -1 -1 -1 -1 1 1 1 1 1 1 1 1 1 1 -1 -1 -1 -1 AT 0 0 0 0 0 0 0 0 0 0 0 0 0 0 0 0 0 0 BA 0 0 0 0 0 0 0 0 0 0 0 0 0 0 0 0 0 0 BE 0 -1 -1 -1 -1 -1 -1 0 0 0 -1 -1 0 0 -1 0 -1 0 BG 0 0 0 0 0 0 0 0 0 0 0 0 0 0 0 0 0 0 CH 0 0 0 0 0 0 0 0 0 0 0 0 0 0 0 0 0 0 CZ 0 -1 -1 -1 -1 -1 -1 -1 -1 -1 -1 -1 -1 -1 -1 -1 -1 0 DE 0 0 0 0 0 0 0 0 0 0 0 0 0 0 0 0 0 0 DK 0 0 0 0 0 0 0 0 0 0 0 -1 -1 0 -1 0 0 0 EE -1 -1 -1 -1 -1 -1 -1 -1 -1 -1 -1 -1 -1 -1 -1 -1 -1 -1 ES -1 -1 -1 -1 -1 -1 -1 0 0 0 -1 -1 0 0 -1 0 -1 -1 FI -1 -1 -1 -1 -1 -1 -1 -1 -1 -1 -1 -1 -1 -1 -1 -1 -1 -1 FR -1 -1 -1 -1 -1 -1 -1 -1 -1 -1 -1 0 -1 -1 -1 -1 -1 -1 GB 0 0 -1 -1 -1 -1 -1 0 0 0 -1 -1 0 0 -1 0 1 0 GR -1 -1 -1 -1 -1 -1 -1 -1 -1 -1 -1 -1 -1 -1 -1 -1 -1 -1 HR 0 0 0 0 0 -1 -1 1 0 0 -1 0 0 0 0 0 0 0 HU 1 1 1 1 1 1 1 1 1 1 1 1 1 1 1 1 1 1 IE 0 0 0 0 0 0 0 0 0 0 0 0 0 0 0 0 0 0 IT -1 -1 -1 -1 -1 -1 -1 -1 -1 -1 -1 -1 -1 -1 -1 -1 -1 -1 LT -1 -1 -1 -1 -1 -1 -1 -1 -1 -1 -1 -1 -1 -1 -1 -1 -1 -1 LU -1 -1 -1 -1 -1 -1 -1 -1 -1 -1 -1 -1 -1 -1 -1 -1 -1 -1 LV -1 1 1 -1 1 1 1 1 1 -1 1 1 1 1 1 1 1 1 ME -1 -1 -1 -1 -1 -1 -1 -1 -1 -1 1 1 1 1 -1 -1 -1 1 MK -1 -1 1 -1 -1 1 -1 1 1 1 1 1 1 1 -1 1 -1 -1 NI -1 -1 -1 0 0 0 0 0 0 0 0 0 -1 -1 -1 -1 -1 -1 NL -1 -1 -1 -1 -1 -1 -1 -1 -1 -1 -1 -1 -1 -1 -1 -1 -1 -1 NO PL 0 0 0 -1 0 -1 -1 -1 -1 -1 -1 -1 -1 -1 -1 0 0 -1 PT 0 0 0 0 0 0 0 0 0 0 0 0 0 0 0 0 0 0 RO 0 0 0 0 0 0 0 0 0 0 0 0 0 0 0 0 0 0 RS 0 0 0 0 0 0 0 0 0 0 0 0 0 0 0 0 0 0 SE 0 0 0 0 0 0 0 0 0 0 0 0 0 0 0 0 0 0 SI -1 -1 -1 -1 -1 -1 -1 0 -1 -1 -1 -1 -1 -1 -1 -1 -1 -1 SK -1 -1 -1 0 -1 0 0 0 0 0 0 0 0 0 0 0 -1 -1 CY 0 0 0 0 0 0 0 0 0 0 0 0 0 0 0 0 0 0 TR -1 -1 -1 -1 -1 -1 -1 -1 -1 -1 -1 -1 -1 -1 -1 -1 -1 -1 MT -1 -1 -1 -1 -1 -1 -1 -1 -1 -1 -1 -1 -1 -1 -1 -1 -1 -1 UA_W 0 0 0 0 0 0 0 0 0 0 0 0 0 0 0 0 0 0
Page 28 of 166
Figure 6: Estimated market-based imports at peak time under normal conditions
Prone to export from a market perspective Prone to import from market / adequacy perspective Normal Conditions with merit order: import needs
Page 29 of 166
4.3.2. Upward regulation under severe conditions
Under severe conditions (cf. methodology: this is a worst-case envelope, representing an extreme scenario to detect regions potentially at risk), the picture is somewhat different: the demand of several individual countries increases, whilst generation availability might be
lower due to unfavourable meteorological conditions. For these simulations, the demand
reduction measures and available strategic reserves are taken into account as reported by the TSOs.
The analysis indicated that even under severe conditions, demand can be met and reserves can be maintained across nearly all of Europe, thanks to energy surpluses in most regions and available interconnector capacity to supply the regions depending on imports.
However, a potential risk has been identified for Poland in several weeks between June and August. The severe balancing conditions take place in case of long lasting heat wave leading to significant deterioration of Polish power system. This causes an increase of load with a simultaneous decrease of generating capacities due to the increase of non-usable capacity and a higher forced outage rate of generators. Wind generation is quite low at that time in summer and there is almost no solar generation, because level of solar installations is negligible. The growth of non-usable capacity mainly refers to hydrological constraints resulting from an extremely dry summer and autumn 2015 and its continuation into winter. Low water levels and warmer temperatures of rivers affect not only the output of hydro power plants, but mainly compromises the ability of the water to cool thermal generation plants effectively. Indeed, water temperature must not deviate too far above a normal temperature, as said deviations may lead to restrictions in the power output of thermal generation plants. All available cross-border capacities into Poland are saturated, and no import capacity is available on the common synchronous profile (with DE+CZ+SK). The unavailability of import capacity on this profile is due to congestion from unscheduled flows through Poland from its western border to its southern border as the result of market transactions concluded outside of Poland. To decrease the risk of not fulfilling N-1 criteria and to allow increasing commercial transmission capacities to Poland, PSE and 50Hertz agreed to exceptionally and temporarily disconnect the Krajnik-Vierraden line between the two countries. It allows effective steering of the physical flow on the remaining PL-DE Mikułowa-Hagenwerder line
Page 30 of 166
by PST operation (cf. press release18). For a more detailed appreciation of the expected
situation in Poland, please refer to the Polish section in Appendix 1.
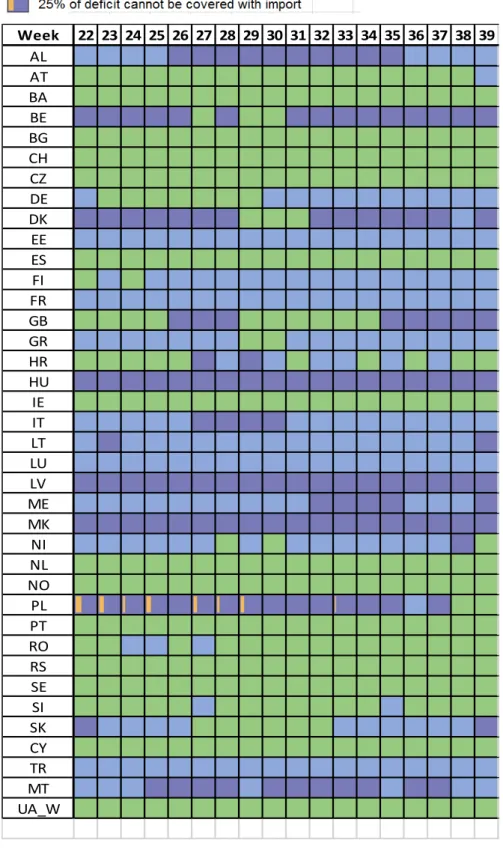
Table 3: Import needs at peak time under severe conditions
18http://www.pse.pl/index.php?dzid=32&did=2908&lang_id=2 Week 22 23 24 25 26 27 28 29 30 31 32 33 34 35 36 37 38 39 AL AT BA BE BG CH CZ DE DK EE ES FI FR GB GR HR HU IE IT LT LU LV ME MK NI NL NO PL PT RO RS SE SI SK CY TR MT UA_W
Page 31 of 166
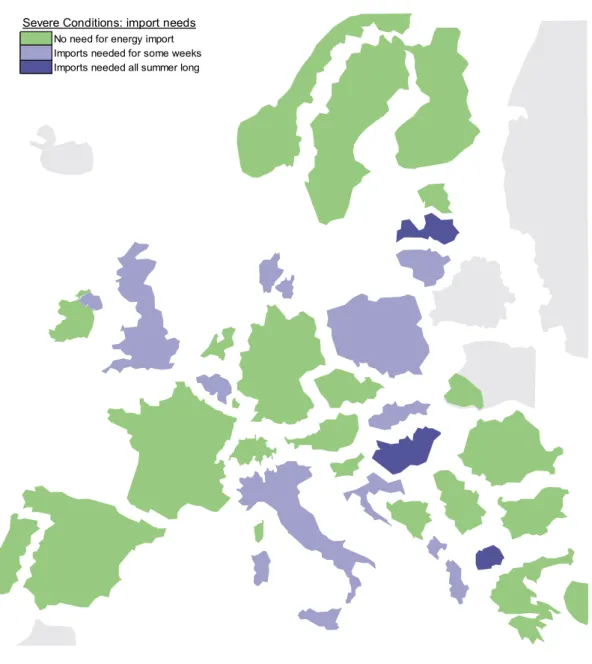
The European map below provides another view of the data shown in the above table. It indicates the countries expecting a need for imported energy in at least one week of the considered period or in all weeks of the considered period, respectively. As can be seen, the need for importable energy is quite limited and geographically distributed, resulting in a low probability of potential issues regarding generation adequacy for the coming winter period. The beneath map show in particular that Latvia, Hungary and FYR of Macedonia will need to import all summer long at peak time under severe conditions. But the interconnection capacities of these three countries will be fully sufficient to reply to their needs.
Page 32 of 166
Simplified merit order approach
Using, the same approach as under normal conditions (cf. chapter 3 for methodology details), an estimation of countries prone to import was performed.
Table 4 shows which countries are prone to import from a market point of view for next summer under severe conditions. The countries and weeks that do not require imports from an adequacy perspective, but are prone to import due to market conditions, are coloured in light blue.
No need for energy import Imports needed for some weeks Imports needed all summer long Severe Conditions: import needs
Page 33 of 166
Figure 8 shows which countries are prone to such a market-based importing position for some or all weeks under severe conditions.
It is important to note that the merit order approach is an assumption and that the following Table 4 and Figure 8 may not represent the real market situations. Especially the current hydro power simplified modelisation with deterministic capacity-based assessments [MW] may not represent the market reality of countries with high penetration of reservoir hydro with natural feed-in (Norway, France, Switzerland, etc.).
Page 34 of 166
Table 4: Countries prone to market-based imports peak time under severe conditions
Week 22 23 24 25 26 27 28 29 30 31 32 33 34 35 36 37 38 39 AL -1 -1 -1 -1 1 1 1 1 1 1 1 1 1 1 -1 -1 -1 -1 AT 0 0 0 0 0 0 0 0 0 0 0 0 0 0 0 0 0 -1 BA 0 0 0 0 0 0 0 0 0 0 0 0 0 0 0 0 0 0 BE 1 1 1 1 1 0 1 0 0 1 1 1 1 1 1 1 1 1 BG 0 0 0 0 0 0 0 0 0 0 0 0 0 0 0 0 0 0 CH 0 0 0 0 0 0 0 0 0 0 0 0 0 0 0 0 0 0 CZ 0 0 0 0 0 0 0 0 0 0 0 0 0 0 0 0 0 0 DE -1 0 0 0 0 0 0 0 -1 -1 -1 -1 -1 -1 -1 -1 -1 -1 DK 1 1 1 1 1 1 1 0 0 0 1 1 1 1 1 1 -1 1 EE -1 -1 -1 -1 -1 -1 -1 -1 -1 -1 -1 -1 -1 -1 -1 -1 -1 -1 ES 0 0 0 0 0 0 0 0 0 0 0 0 0 0 0 0 0 0 FI 0 -1 0 -1 -1 -1 -1 -1 -1 -1 -1 -1 -1 -1 -1 -1 -1 -1 FR -1 -1 -1 -1 -1 -1 -1 -1 -1 -1 -1 -1 -1 -1 -1 -1 -1 -1 GB 0 0 0 0 1 1 1 0 0 0 0 0 0 1 1 1 1 1 GR -1 -1 -1 -1 -1 -1 -1 0 0 -1 -1 -1 -1 -1 -1 -1 -1 -1 HR 0 0 0 0 0 1 -1 1 -1 0 -1 -1 0 -1 0 -1 0 0 HU 1 1 1 1 1 1 1 1 1 1 1 1 1 1 1 1 1 1 IE 0 0 0 0 0 0 0 0 0 0 0 0 0 0 0 0 0 0 IT -1 -1 -1 -1 -1 1 1 1 1 -1 -1 -1 -1 -1 -1 -1 -1 -1 LT -1 1 -1 -1 -1 -1 -1 -1 -1 -1 -1 -1 -1 -1 -1 -1 -1 1 LU -1 -1 -1 -1 -1 -1 -1 -1 -1 -1 -1 -1 -1 -1 -1 -1 -1 -1 LV 1 1 1 1 1 1 1 1 1 1 1 1 1 1 1 1 1 1 ME -1 -1 -1 -1 -1 -1 -1 -1 -1 -1 1 1 1 1 -1 -1 -1 1 MK 1 1 1 1 1 1 1 1 1 1 1 1 1 1 1 1 1 1 NI -1 -1 -1 -1 -1 -1 0 -1 0 -1 -1 -1 -1 -1 -1 -1 1 0 NL 0 0 0 0 0 0 0 0 0 0 0 0 0 0 0 0 0 0 NO 0 0 0 0 0 0 0 0 0 0 0 0 0 0 0 0 0 0 PL 1 1 -1 1 0 0 PT 0 0 0 0 0 0 0 0 0 0 0 0 0 0 0 0 0 0 RO 0 0 -1 -1 0 -1 0 0 0 0 0 0 0 0 0 0 0 0 RS 0 0 0 0 0 0 0 0 0 0 0 0 0 0 0 0 0 0 SE 0 0 0 0 0 0 0 0 0 0 0 0 0 0 0 0 0 0 SI 0 0 0 0 0 -1 0 0 0 0 0 0 0 -1 0 0 0 0 SK 1 -1 -1 -1 -1 0 0 0 0 0 0 -1 -1 -1 -1 -1 -1 1 CY 0 0 0 0 0 0 0 0 0 0 0 0 0 0 0 0 0 0 TR -1 -1 -1 -1 -1 -1 -1 -1 -1 -1 -1 -1 -1 -1 -1 -1 -1 -1 MT -1 -1 -1 1 1 1 1 -1 1 1 1 1 1 -1 1 1 -1 -1 UA_W 0 0 0 0 0 0 0 0 0 0 0 0 0 0 0 0 0 0
Page 35 of 166
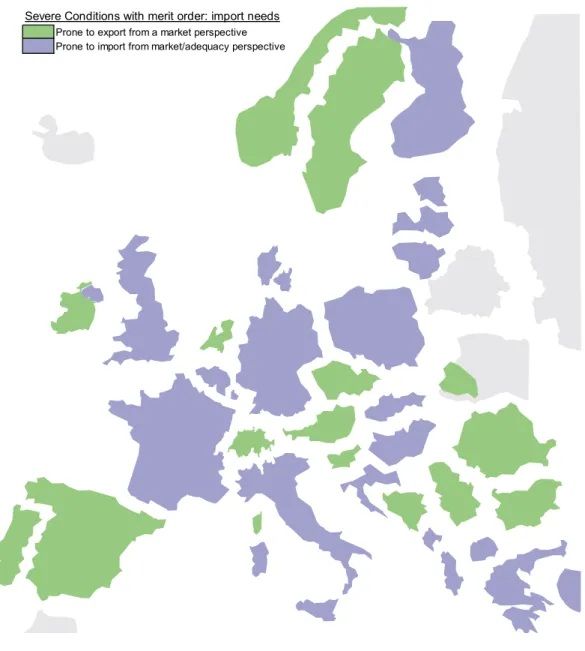
Figure 8: Estimated market-based imports peak time under severe conditions
4.4. Probabilistic sensitivity analysis for countries or regions at risk
The adequacy calculations under severe conditions (cf. previous chapter) show that Poland might not have enough import capacity to cover its demand during several weeks. For Poland, the critical situation is closely linked to a long lasting heat wave, when not only load increase is observed, but also the increase of non-usable capacity in thermal power plants.
Prone to export from a market perspective Prone to import from market/adequacy perspective Severe Conditions with merit order: import needs
Page 36 of 166
This would indeed be a repetition of what happened in the year before (cf. Winter Outlook 2015/16 Report19). Hence calculating the probability even of very high temperature during
few days would not be representative of a critical situation for Poland.
Also Great Britain system might be constrained under severe conditions during the second half of September, notably in week 38. Indeed, the simulations during this week 38 show that Great Britain will have to rely on almost maximum imports capacity from its neighbour countries.
To investigate the situation for Great Britain in more detail, further simulations have been carried out for the third week of September (week 38). As explained in the methodology, a large number of simulations (546 in total) were run, varying the temperatures and renewables infeed and assessing the impact on the remaining capacity in Great Britain. Figure 9 shows the results, with the total weighted wind capacity factor on the horizontal axis, and the population weighted daily average temperature on the vertical axis. The scatter plot depicts the probability of following situations:
Green if no imports are needed for that simulation;
Blue if imports are sufficient to cover the demand;
Orange if imports (up to 3GW) cannot cover the demand and require more imports from other interconnectors and/or up to 3GW strategic reserves might have to be used;
Red if imports (more than 3GW) cannot cover the demand and require more imports from other interconnectors and/or up to 3GW strategic reserves and/or emergency signal to market for extra capacities measuresmight have to be used.
Figure 9: Probabilistic assessment of import needs for Great Britain for the situation investigated (Week 38)
Page 37 of 166
Under severe conditions, the British TSO would require imports from France or the Netherlands to meet demand. In extreme cases (red dots in above chart), e.g. if wind is less than 6% and the temperature is less than 8 °C in September (i.e. week 38), then the
situation could potentially be very tight even with maximum imports from France and the Netherlands. However, the probability of such weather conditions is very low (around 0.5%). Even if such conditions were to occur, there are still several options available to meet demand. These include using some of the 3GW system operational reserve, which have been excluded from this assessment, but could be used to meet demand in real-time. We may also expect to see a response from the market that could result in some imports from Irish interconnectors, or generators shifting outages.
4.5. Downward regulation margins
With increasing renewable generation and in parallel decreasing dispatchable generation in Europe, the probability of encountering issues relating to an excess of inflexible generation
Page 38 of 166
also grows. During certain weeks it may be necessary to export excess inflexible generation in various countries. Furthermore, in some countries (Germany and Belgium) it might even be required to reduce excess generation (or other measures) as a result of insufficient cross-border export capability.
The downward regulation margins were calculated for both weekend nights (characterised by low load, high wind) or on weekend daytime with high photovoltaic generation.
The results of the analysis of available downward regulation margins at the daytime reference time point are shown below in Table 5. Where a country is coloured green, it has sufficient downward regulation margin. The countries that are fully coloured in purple can export their excess energy, whereas for the countries that show partial orange results, the regional analysis revealed that their excess cannot be fully covered with exports considering the reported NTC values. The portion of the cell that is coloured in orange reflects the portion of the excess that cannot be covered by exports.
Page 39 of 166
Table 4: Export needs at the daytime minimum
no generation excess (no need to export) excess can be covered by export
25% of excess cannot be covered by export 50% of excess cannot be covered by export
Week 22 23 24 25 26 27 28 29 30 31 32 33 34 35 36 37 38 39 AL AT BA BE BG CH CZ DE DK EE ES FI FR GB GR HR HU IE IT LT LU LV ME MK NI NL NO PL PT RO RS SE SI SK CY TR MT UA_W
Page 40 of 166
It can be observed that with wind and solar output set at a representative level across the ENTSO-E region, there are some countries that would be required to export excess inflexible generation under minimum daytime demands to neighbouring regions. For most countries, the estimated minimal NTC’s, in combination with the possibility for neighbouring countries to absorb excess energy, result in a feasible ENTSO-E-wide situation. For Germany and Belgium a potential issue regarding excess inflexible generation might arise in several weeks.
The situation in Germany is caused by high amount of renewable, especially photovoltaic during the daytime.
In Belgium, the situation is mainly linked to the maximum availability of nuclear power (6 GW during July and August), as nuclear power is considered as “must run” in the assumptions for Belgium, in combination with a reduced availability of the pumping capacity. In some specific cases additional measures may be needed (for example modulation on nuclear units, optimisation of export capacity...), in order to avoid curtailing the output of renewable energy sources.
Page 41 of 166
Table 6: Export needs at the night-time minimum
no generation excess (no need to export) excess can be covered by export 25% of excess cannot be covered by export 50% of excess cannot be covered by export
Week 22 23 24 25 26 27 28 29 30 31 32 33 34 35 36 37 38 39 AL AT BA BE BG CH CZ DE DK EE ES FI FR GB GR HR HU IE IT LT LU LV ME MK NI NL NO PL PT RO RS SE SI SK CY TR MT UA_W
Page 42 of 166
The overnight minimum demand scenario yields similar results and conclusions as the daytime scenario: sufficient interconnection capacity is available to export excess inflexible generation to neighbouring countries under the investigated hypotheses. For Belgium, a potential issue regarding excess inflexible generation might arise. However, the risk would be significantly smaller compared to the daytime minimum scenario. For Germany the results of night-time minimum demand do not show a potential issue in opposition to daytime demand scenario.
The below maps offer another view on the data shown in Table 5 and Table 6. They indicate the countries expecting a need to export energy in at least one week of the considered period or in all weeks of the considered period, respectively. As can be seen on these maps, the countries that need to export energy are quite geographically distributed and are neighbour to importing countries. Thus, a low probability of potential issues on a pan-European scale regarding an excess of inflexible generation for the coming summer period. On the beneath maps it can be noted that FYR of Macedonia needs to export all weeks of the year in daytime and night time downward calculations. The reason is the small size of the system and its important part of inflexible thermal generation, what results in needed moderate export in downward regulation.
Page 43 of 166
No need for energy exports Exports needed for some weeks Exports needed all summer long Daytime Conditions export needs
Page 44 of 166
Figure 11: Overview of the export needs for the night-time scenario
No need for energy exports Exports needed for some weeks Exports needed all summer long Nighttime Conditions export needs
Page 45 of 166
5.
Winter Review 2015/16
The Winter Review 2015/16 report is based on qualitative information submitted in March 2016 through a questionnaire in order to present the most important events that occurred during the winter period and compare them to the forecasts and risks reported in the previous Seasonal Outlook. The TSOs mainly answered whether their respective power system experienced any important or unusual events or conditions during the winter period as well as identified the causes and the remedial actions taken.
5.1. General comments on past winter climate
The winter 2015/2016 was moderate with average monthly temperatures near or higher (up to 4°C in Britain for example) than the average values - as a result, demand was around or lower than the seasonal average in most of European countries, with just a few exceptions such as Finland and Norway where exceptionally cold temperatures and new records of peak load were reached in January. Some countries also experienced dry weather conditions through the winter - where less rainfall caused lower outputs from their hydro power plants.
5.2. Specific events and unexpected situations during past winter
There are only few isolated events regarding transmission network could be mentioned:
● High wind infeed in Germany caused significant limitations on the DK1-DE border.
● A Notice of Insufficient Margin (NISM) was issued in Great Britain on the 4th November 2015 and 40MWs of DSBR (Demand Side Balancing Reserve) was used to meet demand.
● Due to the very high electricity deficit in Latvia and Lithuania the electrical flows were from North to South and the congestions on the border EE-LV in Baltic States have been occurred.
● The Moyle Interconnector between Northern Ireland and Scotland, on a prolonged
outage since 2012 limiting it to half its capacity, has been restored to full capacity.
● In January in one week the gas shortage affected some Natural Gas Power plants in
Turkey.
Page 46 of 166
The system adequacy was comfortably managed during past winter – mainly generation was sufficient to meet demand in Europe and there was no load reduction or major disconnections during winter 2015/2016.
Due to the return of 2 nuclear units (1GW each) during the winter 2015-2016, the adequacy risks for Belgium assessed in the Winter Outlook 2015/16 were notably reduced.
In Switzerland, during the last months of 2015, a tense situation was experienced:
• Outage of nuclear power plants Beznau 1 and 2 (720MW);
• Rivers with considerably less water compared to the long-term average (run-of-river
production), as a result of the dry summer and autumn;
• Water reservoirs filled below average (~1.2TWh below the median of the last 18
years).
However, during the first months of 2016, the situation became increasingly less critical thanks various factors and measures:
• Joint problem-solving by the energy industry: Since December 2015, a working group
from the Swiss energy industry (power plant operators, distribution system operators and traders) has been developing solutions to ease the situation. Swissgrid has also introduced and implemented additional technical and market-oriented measures in close coordination with European transmission system operators.
• Mild temperatures: the unusually mild temperatures this winter have resulted in
reductions in grid load and in overall consumption, which has had a positive effect on the energy supply and grid situation. Thanks to frequent rainfall since mid-January, electricity production from run-of-river production has also been higher than normal for this time of the year.
• Restarting of Beznau 2: Since the restarting of Block 2 of the Beznau nuclear power
plant on 23 December 2015, a proportion (360MW) of the unavailable base load is once again supplied into the 220-kV grid.
Page 47 of 166
6.
Appendices
Appendix 1: Individual country comments on the Summer Outlook 2016
AlbaniaMost of the maintenance works in generation – transmission system will be performed during summer period from April till October. The most critical period remains during months of July and August, depending from the temperatures, and due to that, the maintenance schedule of units and transmission elements in that period is set to minimum. This period is also characterized by low hydro levels. Albania does not foresee any unexpected event that may affect the adequacy during this period.
Most critical periods for maintaining adequacy, countermeasures adopted and expected role of interconnectors
The most critical period remains during months of July and August, depending from the temperatures, and due to that, the maintenance schedule of units and transmission elements in that period is set to minimum. Thermal power plant Vlora will be used only in cases of very dry summer according to KESH GEN20, hence the adequacy will be maintained with
firm contracts of imports from OSHEE (DSO) around 300MW. In general the interconnections are sufficient for fulfilling the need of electricity imports, and also for exports if it will be the case, and they are used as well for transits, mainly towards Greece. The maintenance of the interconnectors is arranged to be in the period of April – May and September – October, when the demand is relatively lower, also in the neighbouring TSOs, thus the adequacy will be maintained.
Most critical periods for downward regulating capacity, countermeasures adopted and expected role of interconnectors in managing an excess of inflexible generation
Albania has not yet inflexible generation, thus it is not expected to have any problem with demand minimum periods. The export capacity of our interconnectors is expected to be around 700 MW when the new 400kV Line Tirana2-KosovaB will be in operation.
20
Regarding the wholesale activity within the Albanian Market Model, KESH Gen is given a mission to supply energy for captive customers and operate in a way to financially mitigate the hydrological risk inherent in the Albanian supply portfolio.
Page 48 of 166 0,0 GW 0,5 GW 1,0 GW 1,5 GW 2,0 GW 22 23 24 25 26 27 28 29 30 31 32 33 34 35 36 37 38 39
Demand and generation availability: Albania
Net load under severe conditions Net load under normal conditions
Reliably available capacity under normal conditions Reliably available capacity under severe conditions Net generating capacity
-0,8 GW -0,6 GW -0,4 GW -0,2 GW 0,0 GW 0,2 GW 0,4 GW 0,6 GW 22 23 24 25 26 27 28 29 30 31 32 33 34 35 36 37 38 39
Remaining Capacity (import requirement if negative): Albania
Simultaneous Importable capacity Remaining capacity under normal conditions Remaining capacity under severe conditions
-1,0 GW -0,8 GW -0,6 GW -0,4 GW -0,2 GW 0,0 GW 0,2 GW 0,4 GW 0,6 GW 0,8 GW 22 23 24 25 26 27 28 29 30 31 32 33 34 35 36 37 38 39
Downward regulation (export requirement is positive): Albania
Page 49 of 166
Austria
According to the deterministic capacity adequacy methodology no problems have been detected for Austria for the upcoming summer. The remaining capacity will be even higher than the years before due to following reasons:
The installed power plant capacity is going to increase in summer 2016 (e. g. the new pumped storage power plant Reisseck 2). But also a lot of renewables are going to go into operation. Here the methodology of the availability of renewable energy sources has been changed and so will be considered higher than the years before (cf. Pan-European Climate Database). In the end there are capacities of thermal power plants contracted for congestion management measures this summer (Austrian grid reserve).
Due to the high number of installed capacity of pumped storage power plants the deterministic assessment covers potential capacity problems e. g. of low water levels of impounding reservoirs as a result of long droughts.
Page 50 of 166 0,0 GW 5,0 GW 10,0 GW 15,0 GW 20,0 GW 25,0 GW 30,0 GW 22 23 24 25 26 27 28 29 30 31 32 33 34 35 36 37 38 39
Demand and generation availability: Austria
Net load under severe conditions Net load under normal conditions
Reliably available capacity under normal conditions Reliably available capacity under severe conditions Net generating capacity
0,0 GW 1,0 GW 2,0 GW 3,0 GW 4,0 GW 5,0 GW 6,0 GW 7,0 GW 8,0 GW 9,0 GW 22 23 24 25 26 27 28 29 30 31 32 33 34 35 36 37 38 39
Remaining Capacity (import requirement if negative): Austria
Remaining capacity under normal conditions Remaining capacity under severe conditions
-4,5 GW -4,0 GW -3,5 GW -3,0 GW -2,5 GW -2,0 GW -1,5 GW -1,0 GW -0,5 GW 0,0 GW 22 23 24 25 26 27 28 29 30 31 32 33 34 35 36 37 38 39
Downward regulation (export requirement is positive): Austria
Page 51 of 166
Belgium
Due to the return of 2 nuclear units (1GW each) during the winter 2015-2016, the adequacy risks for Belgium are reduced. This makes that in normal conditions Belgium has a small positive remaining capacity. In severe conditions the remaining capacity becomes negative, with sufficient import capacity.
The import capacity is increased compared to the analysis of 2015 due to an additional PST on the north border.
Most critical periods for maintaining adequacy, countermeasures adopted and expected role of interconnectors
In the winter period Belgium can count on additional strategic reserve (for winter 2015-2016 ~1,5GW) in case of adequacy issues. However, in summer there is no need for this additional reserve capacity since the interconnection capacity is sufficient in Belgium, even in severe conditions.
Most critical periods for downward regulating capacity, countermeasures adopted and expected role of interconnectors in managing an excess of inflexible generation
Due to the return of 2 nuclear units (1GW each), the amount of inflexible generation increased which can lead to periods of excess capacity in summer. The main drivers for an excess of inflexible generation are reduced load, increased wind and solar production and high availability of nuclear units.
In case of normal wind and solar conditions (P50) the excess is mainly limited to weekends and the holiday period. In these cases the export capacity should be sufficient.
In case of high wind and solar conditions the excess is increasing. In most cases the export capacity should be sufficient, however in some specific cases additional measures may be needed (for example modulation on nuclear units, optimisation of export capacity...). These additional measures (before curtailing the output of renewable energy sources) are not
Page 52 of 166
included in the data collection.
0,0 GW 5,0 GW 10,0 GW 15,0 GW 20,0 GW 25,0 GW 22 23 24 25 26 27 28 29 30 31 32 33 34 35 36 37 38 39
Demand and generation availability: Belgium
Net load under severe conditions Net load under normal conditions
Reliably available capacity under normal conditions Reliably available capacity under severe conditions Net generating capacity
-5,0 GW -4,0 GW -3,0 GW -2,0 GW -1,0 GW 0,0 GW 1,0 GW 2,0 GW 3,0 GW 4,0 GW 22 23 24 25 26 27 28 29 30 31 32 33 34 35 36 37 38 39
Remaining Capacity (import requirement if negative): Belgium
Simultaneous Importable capacity Remaining capacity under normal conditions Remaining capacity under severe conditions
-2,0 GW -1,0 GW 0,0 GW 1,0 GW 2,0 GW 3,0 GW 4,0 GW 5,0 GW 22 23 24 25 26 27 28 29 30 31 32 33 34 35 36 37 38 39