2015
Annual Report
on Form 20-F
The Annual Report on Form 20-F is our SEC filing
for the fiscal year ended December 31, 2015, as
submitted to the US Securities and Exchange
Commission.
© Statoil 2016 STATOIL ASA BOX 8500 NO-4035 STAVANGER NORWAY TELEPHONE: +47 51 99 00 00 www.statoil.com2015 Annual Report on Form 20-F
1 Introduction ... 6
1.1 About the report ... 6
1.2 Key figures and highlights ... 7
2 Strategy and market overview ... 8
2.1 Statoil’s business environment ... 8
2.1.1 Market overview ... 8
2.1.2 Oil prices and refining margins ... 9
2.1.3 Natural gas prices ... 10
2.2 Statoil’s corporate strategy ... 10
2.3 Group outlook ... 12
3 Business overview ... 13
3.1 Our history ... 13
3.2 Our business ... 13
3.3 Our competitive position ... 14
3.4 Corporate structure ... 14
3.5 Development and Production Norway (DPN) ... 16
3.5.1 DPN overview ... 16
3.5.2 Fields in production on the NCS ... 17
3.5.2.1 Operations North ... 20 3.5.2.2 Operations Mid-Norway ... 20 3.5.2.3 Operations West ... 20 3.5.2.4 Operations South... 21 3.5.2.5 Partner-operated fields ... 22 3.5.3 Exploration on the NCS ... 22
3.5.4 Fields under development on the NCS ... 23
3.5.5 Decommissioning on the NCS ... 24
3.6 Development and Production International (DPI) ... 25
3.6.1 DPI overview ... 25 3.6.2 International production ... 26 3.6.2.1 North America ... 28 3.6.2.2 South America ... 29 3.6.2.3 Sub-Saharan Africa ... 29 3.6.2.4 North Africa ... 30
3.6.2.5 Europe and Asia ... 30
3.6.3 International exploration ... 31
3.6.4 Fields under development internationally ... 33
3.6.4.1 North America ... 33
3.6.4.2 South America ... 34
3.6.4.3 Sub-Saharan Africa ... 34
3.6.4.4 North Africa ... 34
3.6.4.5 Europe and Asia ... 34
3.7 Marketing, Midstream and Processing (MMP) ... 36
3.7.1 MMP overview ... 36
3.7.2 Marketing and Trading ... 37
3.7.2.1 Marketing and trading of gas and LNG ... 37
3.7.2.2 Marketing and trading of liquids ... 38
3.7.3 Asset Management ... 38
3.7.3.1 Production plants ... 38
3.7.3.2 Terminals and storage ... 39
3.7.3.3 Pipelines ... 39
3.7.4 Processing and Manufacturing ... 40
3.8 Other Group ... 42
3.8.1 New Energy Solutions (NES) ... 42
3.8.2 Global Strategy and Business Development (GSB)... 43
3.8.3 Technology, Projects and Drilling (TPD) ... 43
3.8.4 Corporate staffs and support functions ... 44
3.9 Significant subsidiaries ... 45
3.10 Production volumes and prices ... 45
3.10.1 Entitlement production ... 45
3.10.2 Sales prices ... 47
3.11.1 Development of reserves ... 52
3.11.2 Preparations of reserves estimates ... 53
3.11.3 Operational statistics ... 53
3.11.4 Delivery commitments ... 55
3.12 Applicable laws and regulations ... 55
3.12.1 Norwegian petroleum laws and licensing system ... 55
3.12.2 Gas sales and transportation from the NCS ... 57
3.12.3 The Norwegian State's participation ... 57
3.12.4 SDFI oil and gas marketing and sale ... 57
3.12.5 HSE regulation ... 58
3.12.6 Taxation of Statoil ... 58
3.13 Property, plant and equipment ... 60
3.14 Related party transactions ... 60
3.15 Insurance ... 60
3.16 People and the group ... 61
3.16.1 Employees in Statoil ... 61
3.16.2 Equal opportunities ... 62
3.16.3 Unions and representatives ... 62
3.17 Safety, security and sustainability ... 63
4 Financial review ... 65
4.1 Operating and financial review ... 65
4.1.1 Sales volumes ... 65
4.1.2 Group profit and loss analysis ... 66
4.1.3 Segment performance and analysis ... 70
4.1.4 DPN profit and loss analysis ... 72
4.1.5 DPI profit and loss analysis ... 73
4.1.6 MMP profit and loss analysis ... 75
4.1.7 Other operations ... 77
4.2 Liquidity and capital resources ... 78
4.2.1 Review of cash flows ... 78
4.2.2 Financial assets and debt ... 79
4.2.3 Investments ... 81
4.2.4 Impact of reduced prices ... 82
4.2.5 Principal contractual obligations ... 82
4.2.6 Off balance sheet arrangements ... 83
4.3 Accounting Standards (IFRS) ... 83
4.4 Non-GAAP measures ... 83
4.4.1 Return on average capital employed (ROACE) ... 83
4.4.2 Net debt to capital employed ratio ... 85
5 Risk review ... 86
5.1 Risk factors ... 86
5.1.1 Risks related to our business ... 86
5.1.2 Legal and regulatory risks ... 92
5.1.3 Risks related to state ownership ... 94
5.2 Risk management ... 95
5.2.1 Managing operational risk ... 95
5.2.2 Managing financial risk ... 95
5.2.3 Disclosures about market risk ... 97
5.3 Legal proceedings ... 97
6 Shareholder information ... 98
6.1 Dividend policy ... 100
6.1.1 Dividends ... 100
6.2 Shares purchased by issuer ... 101
6.2.1 Statoil's share savings plan ... 101
6.3 Information and communications ... 102
6.3.1 Investor contact ... 102
6.4 Market and market prices ... 103
6.4.1 Share prices ... 103
6.4.2 Statoil ADR programme fees ... 104
6.5 Taxation ... 105
6.6 Exchange controls and limitations ... 108
6.7 Exchange rates ... 109
7.2 Code of Conduct ... 113
7.3 General meeting of shareholders... 114
7.4 Nomination committee ... 115
7.5 Corporate assembly ... 116
7.6 Board of directors ... 119
7.6.1 Audit committee ... 123
7.6.2 Compensation and executive development committee ... 124
7.6.3 Safety, sustainability and ethics committee ... 124
7.7 Compliance with NYSE listing rules ... 125
7.8 Management ... 127
7.9 Compensation to governing bodies ... 130
7.10 Share ownership ... 141
7.11 Independent auditor ... 141
7.12 Controls and procedures ... 143
8 Consolidated financial statements Statoil ... 144
8.1 Notes to the Consolidated financial statements ... 149
1 Organisation ... 149
2 Significant accounting policies ... 149
3 Segments ... 158
4 Acquisitions and disposals ... 161
5 Financial risk management ... 162
6 Remuneration... 165
7 Other expenses ... 166
8 Financial items ... 167
9 Income taxes ... 168
10 Earnings per share ... 170
11 Property, plant and equipment ... 170
12 Intangible assets ... 173
13 Financial investments and non-current prepayments ... 175
14 Inventories ... 175
15 Trade and other receivables ... 176
16 Cash and cash equivalents ... 176
17 Shareholders' equity ... 176
18 Finance debt ... 177
19 Pensions ... 178
20 Provisions ... 182
21 Trade and other payables ... 183
22 Leases ... 184
23 Other commitments, contingent liabilities and contingent assets ... 184
24 Related parties ... 186
25 Financial instruments: fair value measurement and sensitivity analysis of market risk ... 187
26 Condensed consolidated financial information related to guaranteed debt securities ... 191
27 Supplementary oil and gas information (unaudited) ... 196
28 Subsequent events ... 206
8.2 Report of Independent Registered Public Accounting firm ... 207
8.2.1 Report of Independent Registered Public Accounting firm ... 207
8.2.2 Report of KPMG on Statoil's internal control over financial reporting ... 208
10 Forward-looking statements ... 212
11 Signature page ... 213
12 Exhibits ... 214
UNITED STATES
SECURITIES AND EXCHANGE COMMISSION WASHINGTON, DC 20549
FORM
20-F
(Mark One)
REGISTRATION STATEMENT PURSUANT TO SECTION 12(b) OR 12(g) OF THE SECURITIES EXCHANGE ACT OF 1934
OR
ANNUAL REPORT PURSUANT TO SECTION 13 OR 15(d) OF THE SECURITIES EXCHANGE ACT OF 1934
For the fiscal year ended December 31, 2015
OR
TRANSITION REPORT PURSUANT TO SECTION 13 OR 15(d) OF THE SECURITIES EXCHANGE ACT OF 1934
For the transition period from _________ to _________ OR
SHELL COMPANY REPORT PURSUANT TO SECTION 13 OR 15(d) OF THE SECURITIES EXCHANGE ACT OF 1934
Date of event requiring this shell company report _________
Commission file number 1-15200
Statoil ASA
(Exact Name of Registrant as Specified in Its Charter) N/A
(Translation of Registrant’s Name Into English) Norway
(Jurisdiction of Incorporation or Organization) Forusbeen 50, N-4035, Stavanger, Norway
(Address of Principal Executive Offices) Hans Jakob Hegge
Chief Financial Officer Statoil ASA Forusbeen 50, N-4035
Stavanger, Norway Telephone No.: 011-47-5199-0000
Fax No.: 011-47-5199-0050
(Name, Telephone, E-mail and/or Facsimile number and Address of Company Contact Person) Securities registered or to be registered pursuant to Section 12(b) of the Act:
Title of Each Class Name of Each Exchange On Which Registered
American Depositary Shares New York Stock Exchange
Ordinary shares, nominal value of NOK 2.50 each New York Stock Exchange*
*Listed, not for trading, but only in connection with the registration of American Depositary Shares, pursuant to the requirements of the Securities and Exchange Commission
Securities registered or to be registered pursuant to Section 12(g) of the Act: None
Indicate the number of outstanding shares of each of the issuer’s classes of capital or common stock as of the close of the period covered by the annual report.
Ordinary shares of NOK 2.50 each 3,188,647,103
Indicate by check mark if the registrant is a well-known seasoned issuer, as defined in Rule 405 of the Securities Act.
Yes No If this report is an annual or transition report, indicate by check mark if the registrant is not required to file reports pursuant to Section 13 or 15(d) of the Securities Exchange Act of 1934.
Yes No Note – Checking the box above will not relieve any registrant required to file reports pursuant to Section 13 or 15(d) of the Securities Exchange Act of 1934 from their obligations under those Sections.
Indicate by check mark whether the registrant: (1) has filed all reports required to be filed by Section 13 or 15(d) of the Securities Exchange Act of 1934 during the preceding 12 months (or for such shorter period that the registrant was required to file such reports), and (2) has been subject to such filing requirements for the past 90 days.
Yes No Indicate by check mark whether the registrant has submitted electronically and posted on its corporate Web site, if any, every Interactive Data File required to be submitted and posted pursuant to Rule 405 of Regulation S-T (§232.405 of this chapter) during the preceding 12 months (or for such shorter period that the registrant was required to submit and post such files).**
Yes No **This requirement does not apply to the registrant in respect of this filing.
Indicate by check mark whether the registrant is a large accelerated filer, an accelerated filer, or a non-accelerated filer. See definition of “accelerated filer and large accelerated filer” in Rule 12b-2 of the Exchange Act. (Check one):
Large accelerated filer Accelerated filer Non-accelerated filer
Indicate by check mark which basis of accounting the registrant has used to prepare the financial statements included in this filing:
U.S. GAAP International Financial Reporting Standards as issued by the International Accounting Standards Board
Other
If “Other” has been checked in response to the previous question, indicate by check mark which financial statement item the registrant has elected to follow.
Item 17 Item 18
If this is an annual report, indicate by check mark whether the registrant is a shell company (as defined in Rule 12b-2 of the Exchange Act).
Yes No
1 Introduction
1.1 About the report
Statoil's Annual Report on Form 20-F for the year ended 31 December 2015 ("Annual Report on Form
20-F") is available online at www.statoil.com.
Statoil is subject to the information requirements of the US Securities Exchange Act of 1934 applicable to foreign private issuers. In accordance with these requirements, Statoil files its Annual Report on Form 20-F and other related documents with the Securities and Exchange Commission (the SEC). It is also possible to read and copy documents that have been filed with the SEC at the SEC's public reference room located at 100 F Street, N.E., Washington, D.C. 20549, US. You can also call the SEC at 1-800-SEC-0330 for further information about the public reference rooms and their copy charges, or you can log on to www.sec.gov. The report can also be downloaded from the SEC website at www.sec.gov.
Statoil discloses on its website at www.statoil.com/en/about/corporategovernance/statementofcorporategovernance/pages/default.aspx, and in its Annual Report on Form 20-F (Item 16G) significant ways (if any) in which its corporate governance practices differ from those mandated for US companies under the New York Stock Exchange (the "NYSE") listing standards.
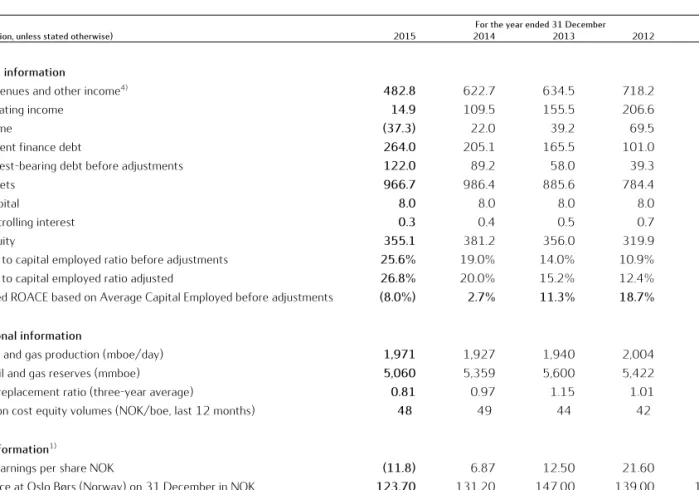
1.2 Key figures and highlights
Statoil publishes financial data in accordance with International Financial Reporting Standards (IFRS) as
issued by the International Accounting Standards Board (IASB) and as adopted by the European Union (EU).
(in NOK billion, unless stated otherwise)
For the year ended 31 December
2015 2014 2013 2012 2011
Financial information
Total revenues and other income4) 482.8 622.7 634.5 718.2 670.0
Net operating income 14.9 109.5 155.5 206.6 211.8
Net income (37.3) 22.0 39.2 69.5 78.4
Non-current finance debt 264.0 205.1 165.5 101.0 111.6
Net interest-bearing debt before adjustments 122.0 89.2 58.0 39.3 71.0
Total assets 966.7 986.4 885.6 784.4 768.6
Share capital 8.0 8.0 8.0 8.0 8.0
Non-controlling interest 0.3 0.4 0.5 0.7 6.2
Total equity 355.1 381.2 356.0 319.9 285.2
Net debt to capital employed ratio before adjustments 25.6% 19.0% 14.0% 10.9% 19.9%
Net debt to capital employed ratio adjusted 26.8% 20.0% 15.2% 12.4% 21.1%
Calculated ROACE based on Average Capital Employed before adjustments (8.0%) 2.7% 11.3% 18.7% 22.1%
Operational information
Equity oil and gas production (mboe/day) 1,971 1,927 1,940 2,004 1,850
Proved oil and gas reserves (mmboe) 5,060 5,359 5,600 5,422 5,426
Reserve replacement ratio (three-year average) 0.81 0.97 1.15 1.01 0.90
Production cost equity volumes (NOK/boe, last 12 months) 48 49 44 42 42
Share information1)
Diluted earnings per share NOK (11.8) 6.87 12.50 21.60 24.70
Share price at Oslo Børs (Norway) on 31 December in NOK 123.70 131.20 147.00 139.00 153.50
Dividend per share NOK 2)
7.62 7.20 7.00 6.75 6.50
Dividend per share USD 2),3) 1.07 0.97 1.15 1.21 1.08
Weighted average number of ordinary shares outstanding (in thousands) 3,179,443 3,179,959 3,180,684 3,181,546 3,182,113 1) See section 6 Shareholder information for a description of how dividends are determined and information on share repurchases.
The board of directors will propose the total 2015 dividend for approval at the annual general meeting scheduled for 11 May 2016.
2) Proposed cash dividend for 2015. For 2015, the NOK amount covers first quarter while the USD amount is for second, third and fourth quarter. Figure presented for 2015 using the Central Bank of Norway 2015 year end rate for Norwegian kroner, which was USD 1.00 = 8.8090 NOK. 3) Figures presented using the Central Bank of Norway year end rate for Norwegian kroner.
2 Strategy and market overview
The profitability of the oil and gas industry continues to be challenged and Statoil’s financial results in 2015
were influenced by the fall in oil prices. Stricter project prioritisation and a comprehensive efficiency
programme are showing progress and are expected to continue to improve cash flow and profitability.
Statoil proposes to the annual general meeting a scrip dividend from the fourth quarter of 2015. Statoil’s
strong financial position provides a firm basis on which to balance capital investment and dividends to
shareholders, which Statoil expects to grow in line with its long-term earnings.
Last year Statoil outlined plans to further strengthen its competitiveness, and is now reinforcing its effort and commitment to deliver on priorities of high value creation, increased efficiency and competitive shareholder returns. Through Statoil`s flexibility in its investment programme Statoil believes that it is well prepared for potential sustained market volatility and uncertainty.
Statoil’s ambition to further reduce costs and improve efficiency was presented at the capital markets update (CMU) on 6 February 2015. Then, the company announced that it was targeting annual savings of USD 1.7 billion from 2016 (pre-tax) as measured against the cost base of 2013. Having already realised $1.9 billion in savings (pre-tax), Statoil announced a new goal at the CMU on 4 February 2016. The company will step up its efficiency programme by 50% with a goal to realise USD 2.5 billion in annual savings from 2016 (pre-tax), again as measured against the cost base of 2013. The step-up of $0.8 billion is expected to be divided by two-thirds capital expenditures (capex) and one-third operational expenditures (opex).
Improvement programmes are Statoil’s response to the industrial challenges characterised by high costs and declining returns. More specifically, the ambition is to realise positive production effects and cost savings to improve Statoil’s financial results and cash-flows.
These forward-looking statements reflect current views about future events and are, by their nature, subject to significant risks and uncertainties because they relate to events and depend on circumstances that will occur in the future. See section 10 Forward-Looking Statements for more information.
2.1 Statoil’s business environment
2.1.1 Market overview
Global economic GDP growth eased in 2015, to 2.4% from 2.6% in 2014. This largely reflects weakness in
non-OECD economies where activity decelerated over the year. Growth in OECD, on the other hand, held up
relatively well at around 2%, supporting overall economic growth and energy demand.
The underlying fundamentals of the United States economy remain sound and GDP growth ticked up slightly to 2.5% in 2015 from 2.4% in 2014. GDP growth also accelerated nominally in the Eurozone to 1.5%, supported by low energy prices, reduced fiscal headwinds, more monetary stimulus and a weak euro. UK GDP growth slowed in 2015, but remains decent at 2.4%, whereas Japan barely avoided its fourth recession in five years. Growth in emerging countries slipped to 3.6% in 2015, reflecting both weakness in commodity prices and domestic challenges. Deep recessions have emerged in Brazil and Russia, whilst China continues on an intended path of gradual deceleration and consequent structural reforms. Net commodity importers such as India are doing much better, and India’s GDP growth rate outpaced China’s in 2015.
Several major forces are at play in the global economy and will continue to affect demand, including soft commodity prices and persistently low interest rates, increasingly divergent monetary policies across major economies, and weak world trade. In particular, the sharp decline in oil prices since mid-2014 has supported global economic activity and is expected to continue to do so in 2016.
Global oil demand grew by a healthy 1.6 mmbbl per day in 2015, driven by a colder than normal winter in the US and Northern Europe and the lower prices of crude oil. Demand growth in absolute terms was highest in China, despite 2015 being a challenging year for Chinese stock markets and the Chinese economy in general. Non-Opec producers have proven to be resilient to lower prices and grew production by 1.3 mmbbl per day in 2015 while Opec added 1.1 mmbbl per day to their production, mainly from Saudi Arabia and Iraq. This has postponed the rebalancing between supply and demand and has led to a continued drop in oil prices.
2015 saw moderate growth in gas supply and demand of 1.5%, which is below the growth rates of the previous years. The United States is the main driver behind the growth. Europe experienced a weather-driven increase in demand as compared to 2014. Gas consumption declined in Japan and South Korea due to weak power sector gas demand caused by the (re)start of coal and nuclear power plants. Gas demand growth slowed in China and other emerging markets, with more competitively priced oil products being one contributing factor. In the United States, a multi-year wave of gas supply growth came to an end in 2015, but demand could not keep up with supply growth, and prices fell. A strong supply of pipeline gas to Europe and an emerging oversupply of LNG have further depressed gas prices.
The global economic situation continues to be fragile, with development partly driven by uncertain political environments in key countries and regions, in addition to normal supply and demand factors. The situation at the end of 2015, with high storage levels and low prices, will continue to put pressure on international oil companies to increase efficiency and reduce costs. This will contribute to a gradual rebalancing of markets for oil and gas. The impact of this on price levels and price developments is very uncertain.
2.1.2 Oil prices and refining margins
High volatility characterised the oil market in 2015, with the price of Brent in a range between USD 66 per
barrel in May to USD 35 per barrel at the end of December. Refinery margins were well above normal levels
due to low crude prices throughout the year.
Oil prices
The average price for dated Brent crude in 2015 was USD 53/bbl, down 47% from 2014. The price was at USD 55/bbl in the beginning of 2015, on a downward trajectory. A temporary low was reached at just above USD 45/bbl in the middle of January before the prices started climbing again. A positive market sentiment drove the price of dated Brent up in the second quarter. Signs of a downturn in the Chinese economy and the nuclear deal between P5+1 and Iran contributed to a declining market sentiment and prices fell again to a new low in August. The price of dated Brent recovered somewhat again in the 3rd
quarter and in to the 4th
quarter, before the 168th
Opec meeting on the 4th
of December. No action was agreed by the Opec member countries and the price of Brent went below USD 40/bbl for the first time since the spring of 2009. The dated Brent price was USD 36/bbl on 31 December 2015, a year-end level not seen for a decade. The futures market for Brent at the Intercontinental Exchange (ICE) was in contango throughout 2015. See section 9 Terms and definitions for further details.
Although the conflict level in Syria increased further and the armed conflict in Yemen added tension in the Middle East, geopolitical events had less effect on the crude oil prices in 2015, compared with the previous year.
Opec’s decision, in late 2014, to not balance the market, marked the change of a 30-year old strategy. Subsequent to this the oil market was highly volatile throughout 2015, while the participants endeavoured to find the new price level of crude oil. Although oil demand increased by 1.6 mmbbl per day, much due to a cold winter and low prices, the market remained oversupplied throughout the whole year, with total supply growth of 2.4 mmbbl per day of production. As a consequence, the global oil stocks were at historically high levels by year-end.
2015 was an eventful year for North American (NA) crude. The price of US WTI crude, as quoted at the Cushing tank farm in Oklahoma, averaged USD 49/bbl in 2015, down 47% from 2014. The price of WTI was USD 53/bbl at the beginning of the year. On 31 December 2015 the WTI price was at USD 37/bbl, roughly at par with first month Brent. With low crude prices through 2015, rig counts have dropped and production growth has faltered. At the same time, crude inventories have continued to grow, further weighing on crude prices. New pipeline and crude distillation capacity, coupled with slower production growth, have created a tighter balance for US light crude, easing the large price discounts of inland crudes relative to Brent. The easing of discounts has challenged the economics of more expensive transport solutions such as rail relative to pipeline, such that crude by rail loadings have declined dramatically during 2015. In late 2015, the US government passed legislation allowing unrestricted export of crude oil for the first time since the 1970s. While little impact is expected in the global market short term, given the current oversupplied global crude market, unrestricted US crude exports provides producers with greater access to higher value global crude markets and could impact price differentials.
Refining margins
Refinery margins in Northwest Europe, as calculated against dated Brent crude, were well above normal in 2015. One reason for the strength was the weak crude oil market, with dated Brent priced below the first forward month at the ICE exchange throughout the year. Further, the price differentials vs. Brent for the crude oils actually used were lower than last year. The other main factor was a very strong gasoline market. Low price levels at the pump led to rising demand in the US, and gasoline demand in Europe stopped falling. Changes to the Chinese economy led to more emphasis on the consumer sector. New car sales in China almost matched that of the US, and some 80% were net additions to the fleet. Chinese gasoline demand therefore rose almost as much as in the US, and strong growth was also seen in India and Pakistan. This demand growth led to capacity constraints at refineries, in particular for high-octane components. Europe, being in net surplus on gasoline, was able to export more into these markets, with parts of it going as high-octane components at strong price premiums. For naphtha, which is a feedstock both for the petrochemical industry and for making gasoline, Asian demand for imports from Europe rose through the year and gave very strong margins here. On the other hand, new refineries in Asia and the Middle East were geared towards diesel production. New diesel volumes exported to Europe led to rising inventory levels here, despite a quite strong demand growth. The situation became dramatic in the fourth quarter of 2015, when high refinery throughputs in order to make enough gasoline and naphtha led to excess diesel production. This made diesel tanks go full and the diesel margin decreased. LPG was oversupplied due to high exports from the US. Heavy fuel oil was oversupplied due to declining demand. However, against the low Brent crude oil prices, both products still saw quite normal margins.
2.1.3 Natural gas prices
Natural gas prices fell during 2015 in most markets. European gas prices reached the lowest level since
early 2010. Reasons include weak demand, good supplies and low prices for coal, oil and other competing
fuels. Henry Hub gas prices in the United States also declined during 2015, and the prices at year-end were
at the lowest level since the 1990s.
Gas prices - Europe
European gas market prices averaged USD 6.5/mmBtu in 2015, down 20% from 2014. EU gas consumption for heating purposes recovered in 2015 as temperatures returned to more normal levels after a particularly mild winter in 2014. The use of gas for power generation increased in Southern Europe due to high summer temperatures, but declined in other parts of Europe. High availability of wind in 2015 and a steady growth in renewable generation capacity made inroads in the overall need for gas-fired and other thermal power plants in Europe.
Norwegian exports of pipeline gas reached record-levels of 108 bcm in 2015. EU indigenous gas production fell by 10% to 125 bcm as the Dutch government lowered existing production caps at the large Groningen field as a response to earthquake activity. Russia exported more than 150 bcm of pipeline gas to Europe in 2015, close to recent historical highs. Europe imported around 50 bcm LNG in 2015, more than in 2014, but still 35 bcm below the peak a few years ago.
Gas prices - North America
First quarter prices centered on USD 3/mmBtu, while second and third quarter prices fluctuated around USD 2.75/mmBtu, with weather-related ups and downs. However, in the fourth quarter prices fell and reached USD 1.50/mmBtu at the end of the year, as storage rose to new record highs and an El Niño weather event quashed demand in the winter peak season. As a result, the Henry Hub average of USD 2.6/mmBtu was the lowest annual price in over a decade, down from USD 4.4/mmBtu in 2014.
US gas producers responded to the falling prices by withdrawing rigs. Gas production peaked at the end of the summer and supply has been falling since. Demand for gas was strong in 2015, with natural gas for the first time exceeding coal use in the power sector for most of the year.
Global LNG prices
Global prices for LNG have plummeted. Prices under long-term LNG contracts to buyers in Asia are tracking oil prices with a lag, and contract prices were typically down 40% from 2014. The price assessment for spot LNG cargoes in Asia reached USD 7.5/mmBtu over the year compared to USD 14/mmBtu in 2014. LNG prices are now back to levels prior to the Fukushima nuclear disaster in March 2011. The global LNG market has entered a period where the growth of supplies from Australian, US and other liquefaction projects could exceed demand.
2.2 Statoil’s corporate strategy
Statoil creates value by accessing, exploring, developing, and producing energy sources globally, and by
enhancing the value of such production through its mid- and downstream positions.
Fundamental changes are happening in the oil and gas industry. The industry faces new challenges, such as increased pressure on margins, changing patterns of energy supply and consumption, geopolitical instability and rising climate change concerns.
Statoil's top priorities remain to conduct safe and reliable operations with zero harm to people and the environment, and to grow value through disciplined investments and prudent financial management with competitive redistribution of capital to shareholders. To succeed going forward in turning Statoil’s vision into reality, Statoil pursues a strategy that will:
Deepen and prolong Statoil’s NCS position
Grow material and profitable international positions
Pursue focused and value-adding mid- and downstream activities
Provide energy for a low carbon future
Deepen and prolong Statoil’s NCS position
For more than 40 years, Statoil has explored, developed and produced oil and gas from the Norwegian continental shelf (NCS). Statoil aims to deepen and prolong its position by accessing and maturing opportunities into valuable production. At the same time Statoil plans to improve the reliability and lifespan of fields already in production.
Exploration: Statoil has proven to be a committed NCS explorer across mature, growth, and frontier areas. In the last year, Statoil participated in 21 completed exploration wells of which 10 were discoveries. Statoil announced discoveries in the Aasta Hansteen area, the Krafla area, and the King Lear area. Statoil applied for new acreage in the Barents Sea as part of the 23rd licensing round and entered the Barents Sea Exploration Collaboration
with four other oil and gas explorers to address common operational challenges. Statoil also applied for additional NCS licenses during the 2015 Awards in Predefined Areas (APA) with the results awarded in 2016
Development: Statoil received approval from the Norwegian Ministry of Petroleum and Energy for the plan for development and operation (PDO) for Johan Sverdrup Phase I and awarded several related key contracts to suppliers. The development plan for Johan Sverdrup Phase II, along with other projects, continues to be matured. In 2015, Statoil delayed the concept selection for Johan Castberg, Snorre 2040 and Trestakk (sanctioned early 2016) to secure robust development solutions. Gina Krog’s expected start-up is now 2017 with the steel jacket having been installed and predrilling of the production wells started
Production: Statoil began production from Valemon, Oseberg Delta 2, Gullfaks South Oil, Smørbukk South Extension and the Lundin-operated Edvard Grieg field. Three major projects to increase recovery have been delivered in 2015; at Troll A two new gas compressors were installed, the Åsgard subsea compression, the world’s first subsea gas compression plant, came on stream, and the world’s first subsea wet gas compressor is nearing completion at Gullfaks
Statoil made further portfolio adjustments to improve its NCS position. Statoil increased its share in the Alfa Sentral project, which straddles the border of the NCS and UK continental shelf (UKCS). Statoil’s equity share now stands at 24% in licence P312 on the UKCS and 62% in licence PL046 on the NCS (Statoil-operated); the two licenses together comprise the Alfa Sentral field. Statoil also farmed down in the Gudrun field. Statoil remains the operator of the field.
The target to reduce CO2 emissions on the NCS was increased to 1.2 million tonnes by 2020, which is up 50% from the initial target of 800,000 tonnes.
The initial target was set in 2008 and is expected to be reached in 2016.
Grow material and profitable international positions
International oil and gas production represents approximately 37% of Statoil’s equity production and now stands at 739 kboe/d. Statoil will continue to explore, develop, and produce oil and gas opportunities outside Norway to enhance Statoil’s upstream portfolio.
Exploration: Statoil is an active international explorer for oil and gas. In the last year, Statoil participated in 18 completed exploration wells of which eight were discoveries. Statoil focused in Canada, Tanzania, Brazil, the UK and the US Gulf of Mexico. Statoil announced a gas discovery in Tanzania (Mdalasini-1). Statoil accessed new acreage in Canada, New Zealand, Indonesia, Mozambique, Russia, and the US Gulf of Mexico, and entered three new countries, Nicaragua, South Africa, and Uruguay. Government approval is pending for the newly acquired acreage in Mozambique, South Africa, and Uruguay. Statoil exited both our operated and non-operated licenses in the Chukchi Sea (Alaska). Statoil also closed its office in the Faroe Islands following the relinquishment of our exploration acreage
Development: In Europe, the partner-operated Corrib gas field in Ireland came on stream at the end of 2015; meanwhile, Statoil postponed the Mariner field’s start-up date to 2018. In the US Gulf of Mexico, the partner-operated Heidelberg project entered its final stages in 2015 as it prepared for first oil in early 2016, meanwhile Big Foot was postponed due to technical challenges in the final project stage
Production: Production has steadily increased from fields such as CLOV in Angola and Jack/St. Malo in the US Gulf of Mexico. In the US, further optimisation of the onshore portfolio targeting cost improvements has been on-going, including the reorganisation of some of the activities to extract greater synergies
Statoil made further portfolio adjustments to improve its international exploration portfolio. Statoil sees value in gaining operatorships, and in 2015 Statoil became the operator in BM-C-33 offshore Brazil, which contains the Pão de Açúcar, Seat, and Gávea discoveries. Statoil also completed an agreement to reduce Statoil’s average working interest in Statoil’s non-operated US southern Marcellus onshore asset from 29% to 23%. In another transaction, Statoil acquired an additional 13% interest in Statoil’s Eagle Ford joint venture and became its sole operator.
Pursue focused and value-adding mid- and downstream activities
The prime objective for Statoil’s mid- and downstream activities is to process and transport its oil and gas production (including the Norwegian State’s petroleum) competitively to premium markets, securing maximum value realisation. The priorities are:
High regularity in midstream operation and continuous improvement within HSE, efficiency and costs
Market Statoil’s equity production (crude oil, natural gas, related products) and the State’s Direct Financial Interest (SDFI) volumes for maximum value creation
Develop the Asset Backed Trading model across commodities
Maintain the position as a leading European gas supplier
A capital lean asset structure
Strategic focus is directed at optimising the value of Statoil’s flexible Norwegian gas production assets that supply Europe and Statoil’s midstream activities in North America, where Statoil’s onshore un-conventionals portfolio is progressing and where margin capture is important. Statoil achieved strong trading results across all commodities and robust refinery results through good margins, cost reductions and high availability.
Strategic progress in Statoil’s mid- and downstream portfolio has been made in 2015. Export pipelines for the Utsira High and the Norwegian Sea (Polarled) were installed. Statoil agreed to divest its 20% stake in the Trans Adriatic Pipeline AG in 2015 following earlier divestments in 2014.
Providing energy for a low carbon future
Statoil recognises that opportunities are increasingly available in producing low carbon energy. In 2015, Statoil created a new business area, New Energy Solutions, to further access, develop, and produce low carbon energy when and where it is deemed valuable.
Development: In the 4th quarter 2015, Statoil sanctioned Hywind Scotland Offshore Floating Test Park in Scotland; Statoil’s ownership share is
100%. The park will have a total installed capacity of 30 MW and planned production start-up is 2017. The Dudgeon Offshore Wind Park sanctioned in 2014 is progressing as planned towards start-up in 2017; Statoil’s ownership share is 35%. The park will have a total installed capacity of 402 MW. The Forewind consortium, comprising Statoil, Statkraft, RWE and SSE, all with a 25% owner stake, continues to mature projects and has received consent for four 1.2 GW projects in the Dogger Bank Area off the UK east coast
Production: Statoil is a non-operating partner in the Scira consortium (40% owner stake) which produces electricity from the Sherringham Shoal wind park in the UK. The park has an installed capacity of 317 MW
Research, development, and deployment of technology to unlock opportunities and enhance value
Statoil believes that technology is a critical success factor in the current business environment. Statoil’s technology development activities aim to reduce field development, drilling and operating costs, and CO2 and other greenhouse gas emissions. Statoil’s technology efforts focus on the following priority
areas:
Business-critical technologies: Upstream technologies are prioritised, primarily in the areas of Exploration, Reservoir, Drilling and Well and Subsea production systems. Statoil’s main focus has been on cost reduction, for example further development of the steerable drilling liner system to reduce well construction costs
Strengthening Statoil’s licence to operate: Statoil’s commitment to sustainability continues. Statoil’s ongoing “Powering collaboration” agreement with GE aims to accelerate the development of more sustainable energy solutions by addressing CO2 and methane emissions, water usage and energy
optimisation of operations. Statoil is also addressing energy efficiency of operating assets by, e.g. implementing on-line water wash systems on gas turbines
Expanding Statoil’s capabilities: Statoil’s technical capabilities are expanding to meet the challenges of the New Energy Solutions business area for renewable and low carbon energy solutions. Technology development is conducted in-house, in collaboration with suppliers and through venture activities. A key technological focus area is finding more efficient ways of producing clean energy, particularly by reducing costs in the areas of construction and maintenance for both fixed and floating offshore wind applications
2.3 Group outlook
Statoil’s plans address the current environment while continuing to invest in high-quality projects. Statoil
continues to reiterate its efforts and commitment to deliver on its priorities of high value creation, increased
efficiency and competitive shareholder return.
Organic capital expenditures for 2016 (i.e. excluding acquisitions, capital leases and other investments with significant different cash flow pattern) are estimated at around USD 13 billion
Statoil intends to continue to mature the large portfolio of exploration assets and estimates a total exploration activity level of around USD 2 billion for 2016, excluding signature bonuses
Statoil aims to deliver efficiency improvements with pre-tax cash flow effects of around USD 2.5 billion annually from 2016
Statoil’s ambition is to keep the unit of production cost in the top quartile of Statoil`s peer group
For the period 2014 – 2017, organic production growth [7] is expected to come from new projects resulting in around 1% CAGR (Compound Annual Growth Rate) from a 2014 level rebased for divestments
The equity production for 2016 is estimated to be somewhat lower than the 2015 level [7]
Scheduled maintenance activity is estimated to reduce quarterly production by approximately 25 mboe per day in the first quarter of 2016 of which the majority is liquids internationally. In total, the maintenance is estimated to reduce equity production by around 60 mboe per day for the full fiscal year 2016, which is higher than the 2015 impact
Indicative effects from Production Sharing Agreement (PSA-effect) and US royalties are estimated to be around 135 mboe per day in 2016 based on an oil price of USD 40 per barrel and 165 mboe per day based on an oil price of USD 70 per barrel [4]
Deferral of production to create future value, gas off-take, timing of new capacity coming on stream and operational regularity represent the most significant risks related to the production guidance
The board of directors proposes to the annual general meeting (AGM) maintaining a dividend of USD 0.2201 per share for the fourth quarter 2015 and to introduce a two-year scrip dividend programme for eligible shareholders starting from the fourth quarter 2015
With effect from first quarter of 2016, Statoil will change to USD as presentation currency
These forward-looking statements reflect current views about future events and are, by their nature, subject to significant risks and uncertainties because they relate to events and depend on circumstances that will occur in the future. For further information see section 10 Forward-Looking Statements.
3
Business overview
3.1 Our history
Statoil was formed in 1972 by a decision of the Norwegian parliament and listed on the stock exchanges in
Oslo and New York in 2001.
Statoil was incorporated as a limited liability company under the name Den norske stats oljeselskap AS on 18 September 1972. As a company wholly owned by the Norwegian State, Statoil's role was to be the government's commercial instrument in the development of the oil and gas industry in Norway. In 2001, the company became a public limited company listed on the Oslo and New York stock exchanges, and it changed its name to Statoil ASA. Statoil has grown in parallel with the Norwegian oil and gas industry, which dates back to the late 1960s. Initially, Statoil’s operations were primarily focused on exploration, development and production of oil and gas on the Norwegian continental shelf (NCS), as a partner.
In the 1970s, Statoil commenced its own operations, made important discoveries and began oil refining operations, which have been of great importance to the further development of the NCS.
Statoil grew substantially in the 1980s through the development of large fields on the NCS (Statfjord, Gullfaks, Oseberg, Troll and others). Statoil also became a major player in the European gas market by securing large sales contracts for the development and operation of gas transport systems and terminals. During the same decade, Statoil was involved in manufacturing and marketing in Scandinavia and established a comprehensive network of service stations.
Since 2000, our business has grown as a result of substantial investments on the NCS and internationally. Our ability to fully realise the potential of the NCS was strengthened through the merger with Hydro's oil and gas division on 1 October 2007.
In recent years, Statoil has utilised their expertise to design and manage operations in various environments in order to grow our upstream activities outside our traditional area of offshore production. This includes the development of heavy oil and shale gas projects.
In 2010, Statoil carried out an initial public offering of Statoil Fuel & Retail ASA on the Oslo Børs, partially divesting and reducing our interest in the business relating to service stations. In 2012, all of the remaining shares in Statoil Fuel & Retail ASA were divested.
Statoil also participates in projects that focus on other forms of energy, such as offshore wind and carbon capture and storage, in anticipation of the need to expand energy production, strengthen energy security and combat adverse climate change.
3.2 Our business
Statoil is a technology-driven energy company primarily engaged in oil and gas exploration and production
activities.
Statoil ASA is a public limited liability company organised under the laws of Norway and subject to the provisions of the Norwegian Public Limited Liability Companies Act. The Norwegian State is the largest shareholder in Statoil ASA, with a direct ownership interest of 67%.
Statoil's head office is located in Stavanger, Norway. Statoil has business operations in more than 30 countries and employs about 21,600 employees worldwide.
Statoil is the leading operator on the Norwegian continental shelf (NCS) and also has substantial international activities. Statoil is present in several of the most important oil and gas provinces in the world. In 2015, 37% of Statoil's equity production came from international activities and the company also holds operatorships internationally.
Our access to crude oil in the form of equity, governmental and third party volumes makes Statoil a large net crude oil seller, and Statoil is the second-largest supplier of natural gas to the European market. Processing and refining are also part of our operations. Statoil is also participating in projects that focus on other forms of energy, such as offshore wind and carbon capture and storage, in anticipation of the need to expand energy production, strengthen energy security and combat adverse climate change.
3.3 Our competitive position
There is intense competition in the oil and gas industry for customers, production licences, operatorships,
capital and experienced human resources.
Statoil competes with large integrated oil and gas companies, as well as with independent and state-owned companies, for the acquisition of assets and licences for the exploration, development and production of oil and gas, and for the refining, marketing and trading of crude oil, natural gas and related products. Key factors affecting competition in the oil and gas industry are oil and gas supply and demand, exploration and production costs, global production levels, alternative fuels, and environmental and governmental regulations. In addition, Statoil competes to develop wind energy opportunities. Statoil's ability to remain competitive will depend, among other things, on the company's management continuing to focus on reducing unit costs and improving efficiency, and maintaining long-term growth in reserves and production through continuing technological innovation. It will also depend on our ability to seize international opportunities in areas where our competitors may also be actively pursuing exploration and development opportunities. Statoil believes it is in a position to compete effectively in each of our business segments.
The information about Statoil's competitive position in the business overview and strategy, and operational review sections, is based on a number of sources. They include investment analyst reports, independent market studies, and our internal assessments of our market share based on publicly available information about the financial results and performance of market players.
Statoil has endeavoured to be accurate in our presentation of information based on other sources, but has not independently verified such information.
Improvement programmes
Statoil’s ambition to further reduce cost and improve efficiency was presented at the capital markets update (CMU) on 6 February 2015, targeting annual savings of USD 1.7 billion from 2016. At the CMU on 4 February 2016, Statoil announced that it will step up its efficiency programme by 50% with a goal to realise USD 2.5 billion in annual savings from 2016.
Improvement programmes are Statoil’s response to the industrial challenge characterised by reducing prices for our products, escalating cost and declining returns. More specifically, the ambition is to realise positive production effects and capex and operating cost savings to improve financial results and cash-flows.
3.4 Corporate structure
Statoil's operations are managed through the following business areas:
Development and Production Norway (DPN)
DPN comprises our upstream activities on the Norwegian continental shelf (NCS). DPN aims to continue its leading role and ensure maximum value creation on the NCS. Through excellent HSE and improved operational performance and cost, DPN strives to maintain and strengthen Statoil's position as a world- leading operator of producing offshore fields. DPN seeks to open new acreage and to mature improved oil recovery and exploration prospects. New and existing fields are primarily developed using an industrial approach, in which speed of delivery and cost improvements through standardisation and repeated use of proved solutions are key elements.
Development and Production International (DPI)
DPI comprises our worldwide upstream activities that are not included in the DPN and Development and Production USA (DPUSA) business areas. DPI's ambition is to build a large and profitable international production portfolio comprising activities ranging from accessing new opportunities to delivering on existing projects and managing a production portfolio. DPI endeavours to ensure the delivery of profitable projects in a range of complex technical and stakeholder environments, and it manages a broad non-operated production portfolio that will be complemented with operated positions.
Development and Production United States (DPUSA)
DPUSA comprises our upstream activities in the USA and Mexico. DPUSA's ambition is to develop a material and profitable position in the US and Mexico, including the deep water regions of the Gulf of Mexico and unconventional oil and gas in the US. In this connection, Statoil aims to further strengthen its capabilities in deep water and unconventional oil and gas operations.
Marketing, Midstream and Processing (MMP)
MMP comprises our marketing and trading of oil products and natural gas, transportation, processing and manufacturing, and the development of oil and gas value chains. MMP's ambition is to maximise value creation in Statoil's midstream, marketing and renewable energy business.
Technology, Projects and Drilling (TPD)
TPD's ambition is to provide safe, efficient and cost-competitive global well and project delivery, technological excellence, and research and development. Cost-competitive procurement is an important contributory factor, although group-wide procurement services are also expected to help to drive costs in the group down.
Exploration (EXP)
EXP's ambition is to position Statoil as one of the leading global exploration companies. This is achieved through accessing high potential new acreage in priority basins, globally prioritising and drilling more significant wells in growth and frontier basins, delivering near-field exploration on the NCS and other select areas, and achieving step-change improvements in performance.
New Energy Solutions (NES)
NES reflects Statoil’s aspirations to gradually complement its oil and gas portfolio with profitable renewable energy and other low-carbon energy solutions. NES is responsible for wind parks, carbon capture and storage as well as other renewable energy and low-carbon energy solutions.
Global Strategy and Business Development (GSB)
GSB sets the corporate strategy, business development and merger and acquisition (M&A) activities for Statoil. The ambition of the GSB business area is to closely link corporate strategy, business development and M&A activities to actively drive Statoil's corporate development.
Reporting segments
Statoil reports its business in the following reporting segments: Development and Production Norway (DPN); Development and Production International (DPI), which combines the DPI and DPUSA business areas; Marketing, Midstream and Processing (MMP); and Other.
The Other reporting segment includes activities in New Energy Solutions (NES), Technology, Projects and Drilling (TPD), Global Strategy and Business Development (GSB) and Corporate staffs and support functions. Activities relating to the Exploration (EXP) business area are allocated to, and presented in, the respective development and production segments.
Presentation
In the following sections, the operations of each reporting segment are presented. Underlying activities or business clusters are presented according to how the reporting segment organises its operations. The Exploration business area's activities, which include group discoveries and the appraisal of new exploration resources, are presented as part of the various development and production reporting segments (Development and Production Norway, and Development and Production International).
As required by the SEC, Statoil prepares its disclosures about oil and gas reserves and certain other supplementary oil and gas disclosures based on geographical areas. The geographical areas are defined by country and continent. They consist of Norway, Eurasia excluding Norway, Africa, and the Americas.
3.5 Development and Production Norway (DPN)
3.5.1 DPN overview
Development and Production Norway (DPN) is responsible for field development and operational activities
on the Norwegian continental shelf (NCS).
Statoil's equity and entitlement production on the NCS was 1,232 mboe per day in 2015. That was about 68% of Statoil's total entitlement production and 62.5% of Statoil's equity production.
DPN has organised the production operations into four business clusters: Operations North (Barents Sea) located in Harstad, Operations Mid-Norway (Norwegian Sea) located in Stjørdal near Trondheim, Operations West (North Sea) located in Bergen and Operation South (North Sea) located in Stavanger. Partner-operated fields cover the entire NCS and are internally included in the Operations South business cluster. When possible, the fields in each cluster use common infrastructure, such as production installations and oil and gas transport facilities. This reduces the investments required to develop new fields. DPN’s efforts in these core areas also focus on finding and developing smaller fields through the use of existing infrastructure and on increasing production by improving the recovery factor.
DPN is also working to extend production from our existing fields through improved reservoir management and the application of new technology.
Key events and portfolio developments in 2015:
In January 2015, Statoil announced the start-up of production at the Valemon oil and gas field in the North Sea
Statoil announced production start up on fast track projects at the Oseberg Delta in February, Gullfaks Sør Olje in July and Smørbukk Sør Extension in September
In November the start up of production at the Edvard Grieg field was announced by Lundin
The major redevelopment projects Åsgard Subsea compression and two new compressors on the Troll A platform have started up
A total of seven turnarounds were planned to be performed during 2015. Four turnarounds were carried out, and three turnarounds were deferred from 2015 to 2016 to coordinate with other activities due to reduce production losses and reduce costs
Plan for Development and Operations (PDO) for the Johan Sverdrup field and Gullfaks Rimfaksdalen Fast track project were approved by the Ministry of Petroleum and Energy (MPE) and the PDO for Oseberg Vestflanken 2 was submitted to the MPE
An extensive exploration drilling program in 2015 resulted in 21 completed wells, of which 10 were discoveries. A total of 16 wells were Statoil operated
Statoil has delivered an extensive application for the 23rd
concession round and has been awarded interest in 24 licenses on the NCS in the Awards in Predefined Areas (APA) 2015, 13 of those as operator and 11 as partner
In December Statoil announced that it farmed down to Repsol a 15% interest in the Gudrun field. Statoil remains as operator and largest equity holder with a 36% interest
The profitability of our industry continues to be challenged. Statoil’s response to the industrial challenge characterised by high costs and declining returns is addressed in the section 2 Strategy and market overview.
3.5.2 Fields in production on the NCS
Statoil’s entitlement production at NCS was about 68% of Statoil’s total entitlement production in 2015.
The following table shows DPN's average daily entitlement production of oil, including NGL and condensates, and natural gas for the years ending 31 December 2015, 2014 and 2013. Field areas are groups of fields operated as a single entity.For the year ended December 31,
2015 2014 2013 Oil and NGL Natural gas Oil and NGL Natural gas Oil and NGL Natural gas
Area production mbbl mmcm mboe/day mbbl mmcm mboe/day mbbl mmcm mboe/day
Operations North 32 7 78 36 7 80 24 5 56
Operations Mid 113 17 218 126 17 235 126 15 222
Operations West 267 51 591 264 43 535 290 48 589
Operations South 134 13 214 107 11 177 94 12 167
Partner Operated Fields 50 13 132 55 16 157 58 20 182
The following table shows the NCS production by fields and field areas in which Statoil was participating as of 31 December 2015.
Business cluster Geographical area
Statoil's equity
interest in % Operator On stream
Licence expiry date Average daily production in 2015 mboe/day Operations North
Snøhvit The Barents Sea 36.79 Statoil 2007 2035 47.1
Norne The Norwegian Sea 39.10 Statoil 1997 2026 5.9
Alve The Norwegian Sea 85.00 Statoil 2009 2029 10.6
Urd The Norwegian Sea 63.95 Statoil 2005 2026 14.2
Total Operations North 77.9
Operations Mid-Norway
Åsgard The Norwegian Sea 34.57 Statoil 1999 2027 92.1
Morvin The Norwegian Sea 64.00 Statoil 2010 2027 16.3
Mikkel The Norwegian Sea 43.97 Statoil 2003 2020 1)
14.3
Tyrihans The Norwegian Sea 58.84 Statoil 2009 2029 49.6
Kristin The Norwegian Sea 55.30 Statoil 2005 2033 2)
24.5
Heidrun The Norwegian Sea 13.04 Statoil 1995 2024 3)
8.7
Njord The Norwegian Sea 20.00 Statoil 1997 2021 4)
6.1
Hyme The Norwegian Sea 35.00 Statoil 2013 2014 5) 6.2
Total Operations Mid-Norway 217.8
Operations West
Troll Phase 1 (Gas) The North Sea 30.58 Statoil 1996 2030 185.2
Troll Phase 2 (Oil) The North Sea 30.58 Statoil 1995 2030 38.2
Fram The North Sea 45.00 Statoil 2003 2024 16.9
Fram H Nord The North Sea 49.20 Statoil 2014 2024 2.3
Oseberg The North Sea 49.30 Statoil 1988 2031 86.4
Tune The North Sea 50.00 Statoil 2002 2032 6)
1.9
Gullfaks The North Sea 51.00 Statoil 1986 2036 69.4
Gimle The North Sea 65.13 Statoil 2006 2034 7)
2.6
Kvitebjørn The North Sea 39.55 Statoil 2004 2031 64.0
Valemon The North Sea 57.76 Statoil 2015 2031 16.4
Visund The North Sea 53.20 Statoil 1999 2034 48.5
Grane The North Sea 36.66 Statoil 2003 2030 45.8
Volve The North Sea 59.60 Statoil 2008 2028 10.0
Veslefrikk The North Sea 18.00 Statoil 1989 2020 8) 3.1
Total Operation West 590.5
Operations South
Sleipner Vest The North Sea 58.35 Statoil 1996 2028 49.2
Sleipner Øst The North Sea 59.60 Statoil 1993 2028 44.4
Gungne The North Sea 62.00 Statoil 1996 2028 10.0
Gudrun The North Sea 36.00 Statoil 2014 2028 9)
6.1
Statfjord Unit The North Sea 44.34 Statoil 1979 2026 42.6
Statfjord Øst The North Sea 31.69 Statoil 1994 2026 10)
1.3
Statfjord Nord The North Sea 21.88 Statoil 1995 2026 1.2
Sygna The North Sea 30.71 Statoil 2000 2026 10) 0.8
Snorre The North Sea 33.28 Statoil 1992 2015 11) 35.6
Vigdis area The North Sea 41.50 Statoil 1997 2024 14.6
Business cluster Geographical area Statoil's equity interest in %1) Operator On stream Licence expiry date Average daily production in 2015 mboe/day
Partner Operated Fields
Ormen Lange The Norwegian Sea 25.35 Shell 2007 2041 12) 47.8
Skarv The Norwegian Sea 36.17 BP Norge AS 2013 2033 13) 46.8
Ekofisk area The North Sea 7.60 ConocoPhillips 1971 2028 14.3
Marulk The North Sea 50.00 Eni Norge AS 2012 2025 13.2
Vilje The North Sea 28.85 Marathon Oil 2008 2021 4.0
Sigyn The North Sea 60.00 ExxonMobil 2002 2022 3.8
Ringhorne Øst The North Sea 14.82 ExxonMobil 2006 2030 1.7
Edvard Grieg The North Sea 15.00 Lundin Norway AS 2015 2035 0.4
Total Partner Operated Fields 131.9
Total 1,232.0
1)
PL092 expires in 2020 and PL121 expires in 2022.
2)
PL134B expires in 2027 and PL199 expires in 2033.
3)
PL095 expires in 2024 and PL124 expires in 2025.
4)
PL107 expires in 2021 and PL132 expires in 2023.
5)
PL348 expires in 2029.
6)
PL034 expires in 2020. PL053 expires in 2031 and PL190 in 2032.
7)
PL120B expires in 2034 and PL050DS expires in 2023.
8)
PL052 expires in 2020 and PL053 in 2031.
9) The 2015 Statoil farm down transaction with Repsol completed 31 December 2015 (From ownership 51% to 36% at Gudrun field) 10)
PL037 expires in 2026 and PL089 expires in 2024.
11)
PL089 expires in 2024 and PL057 expires in 2016.
12)
PL209/250 expires in 2041 and PL208 expires in 2040.
13)
PL212/262 expires in 2033 and PL159 expires in 2029.
The following sections provide information about the main producing assets. See section 4.1.4 DPN profit and loss analysis for a discussion of results of operations for 2015, 2014 and 2013.
3.5.2.1 Operations North
The main producing fields in the Operations North area are Snøhvit and Norne.
The Norwegian Sea region is characterised by petroleum reserves located at water depths between 340 and 380 metres. In the Barents Sea the petroleum reserves are located at water depths between 310 and 340 meters. The Gulf Stream keeps the sea free of ice all year round, but winter storms can make surface installations difficult to operate.
Snøhvit was the first field developed in the Barents Sea. It is one of the first major developments using onshore production facilities. All offshore installations are subsea. The natural gas is transported to shore and then processed at our Liquefied Natural Gas (LNG) plant on Melkøya. The LNG are shipped to customers in Europe, Asia, North and South America in tankers. The CO2 in the feed-gas from Snøhvit and Albatross is removed due to freezing
constraints in the process system. To reduce carbon dioxide emissions to the air the removed CO2 is liquefied, transported through a pipeline, and then
injected into a storage reservoir in Snøhvit. The LNG plant has produced according to plan in 2015, with high production efficiency, improved HSE results and enhanced cost efficiency. As of 1 January 2016 responsibility for operation of Snøhvit onshore facilities is transferred from DPN to MMP.
Norne is an oil field in the Norwegian Sea. The field has been developed using a floating production, storage and offloading vessel (FPSO) connected to subsea templates. Alve, Marulk, Urd and Skuld are tie-in fields connected to the Norne FPSO.
3.5.2.2 Operations Mid-Norway
The main producing fields in the Operations Mid-Norway area are Åsgard, Kristin, Tyrihans and Heidrun.
Operation Mid-Norway operates in a mature part of the Norwegian Sea, and is a significant contributor to Statoil’s equity production. Main focus is to capitalise existing fields through profitable realisation of increased oil recovery and successful implementation of new developments. There is still exploration potential in the area and a targeted exploration effort is in execution.The Åsgard field includes the Åsgard A production and storage ship for oil, the Åsgard B semi-submersible floating production platform for gas, and the Åsgard C storage vessel for condensate. In September 2015 Statoil started the world first subsea gas compressor on Åsgard. The compressor increases the Åsgard recovery rate from 67% to 87% thereby extending the reservoirs’ productive lives. Mikkel and Morvin are tie ins to Åsgard.
Tyrihans is a subsea field with five templates. The well stream of oil and gas is tied back to Kristin for processing. Tyrihans receives seawater injection from Kristin and gas injection from Åsgard B.
Kristin is a gas and condensate field. The Kristin development is the first high-temperature/high-pressure (HTHP) field developed with subsea installations. The pressure and temperature in the reservoir are among the highest of all developed fields on the NCS.
Heidrun is developed with a floating concrete tension leg platform. The oil is transferred to the floating storage unit, Heidrun B, operated from June 2015. The Njord field is located in the Norwegian Sea and the field has been developed with a floating steel platform unit, Njord A, with both drilling and processing facilities. The subsea field Hyme is tied back to Njord A.
As a result of structural integrity issues Njord A was temporarily shut down and extensive reinforcement work was completed through a long turnaround period from Sept 2013 to July 2014. Since July 2014 conditional monitoring and precautionary evacuation in forecasted bad weather conditions have been applied. In addition there is no drilling activity. The Project “Njord Future” is established to secure long term production for both the Njord and Hyme fields and to act as a tie-in host candidate for discoveries in the area.
3.5.2.3 Operations West
The main producing fields in the Operations West area are Troll, Oseberg, Gullfaks, Kvitebjørn, Visund and
Grane
Operation West produces approximately half of Statoil’s equity production in Norway. Its main focus is prolonging and increasing production through increased oil recovery, exploration and new field developments.
Troll is the largest gas field on the NCS and a major oil field. The Troll field is split into three hydrocarbon-bearing regions connected to three platforms: Troll A, B and C. The Troll gas is mainly exported and produced at the Troll A platform, while oil is mainly produced at Troll B and C. Fram and Fram H Nord are tie-ins to Troll C.
In October 2015Troll A finalised thethird and fourth pre-compressor project as described in the original PDO for the Troll field. The purpose of the project is to increase gas production by installing two extra pre-compressors on the Troll A platform.