Labor contract negotiations
in the airline industry
Airline labor negotiations take 1.3 years, on average,
to conclude, and about half go into Federal mediation;
much of the variance in the duration of negotiations
can be attributed to which particular airlines and unions
are bargaining, not to economic conditions
Andrew von Nordenflycht and Thomas A. Kochan Andrew von Nordenflycht is a graduate student in the Sloan School of Management, Massachusetts Institute of Technology, Cambridge, MA; Thomas A. Kochan is George M. Bunker Professor of Management, Institute for Work and Employment
Research, Sloan School of Management.
I
n the wake of a sizable slump in demand driven by the confluence of economic downturn, terrorism, war, and disease, as well as in-creased competition from low-cost carriers, many incumbent U.S. airlines have been attempting a fun-damental restructuring of their operations. Arguably, a central element in this restructuring involves labor contract negotiations. Yet, even before the events of September 11, 2001, observers perceived strains in the industry’s labor relations system, claiming that contracts were taking longer to negotiate, rank-and-file rejections of tentative agreements were more frequent, and job actions were on the rise. Not surprisingly, then, calls for reform of the Railway Labor Act—the law that has governed airline collective bargaining since 1933— have gained momentum.Recent work has demonstrated that carrier-level differences in the duration of contract negotiations are associated with the quality of the labor-management relationship and, consequently, with airline productivity, customer service, and profit-ability.1 Although the mechanisms of cause and
effect are complex, changes in the regulatory framework could enhance the industry’s pro-ductivity and level of service. However, debate on reforming the Act has been based largely on anec-dotal evidence regarding the duration of contract negotiations and the sources of variance in that duration. To date, there has been no systematic analysis of the actual length of time required to reach agreements in airline labor negotiations and only limited published information on how airline labor disputes are actually resolved.
This article presents and analyzes data on contract negotiations between the Nation’s largest air carriers and unions from 1982 through 2002. Descriptive statistics are given on the average duration of contract negotiations and the relative frequency of mediation and work stoppages; these averages are compared against National Labor Relations Act averages; and the effect of industry-and carrier-level factors that might be expected to account for variation in the duration of negotiations across carriers and over time is analyzed.
The first finding to come out of the analysis is that airline labor negotiations do take a con-siderable amount of time, particularly in relation to contracts negotiated under the National Labor Relations Act, and that reliance on Federal inter-vention is high. Further, the duration of nego-tiations and the reliance on Federal mediation have increased over time. The second finding is that higher carrier or industry growth rates may be asso-ciated with longer negotiations, but that the financial condition of the carrier does not correlate with the duration of negotiations. The third and final finding is that much of the variance in the duration of negotiations can be attributed to the specific identity of the airlines and unions involved in bargaining. Thus, the time required to negotiate airline labor contracts is not determined by the regulatory regime or by economic conditions nearly so much as it is by the relationship between, and practices of, particular organizations.
The article begins with a background description of the regulatory framework surrounding airline labor relations.
Background
The Railway Labor Act has a number of features that distinguish negotiations and dispute resolution in airlines (and railroads) from negotiations governed by the National Labor Relations Act. The regulatory “exception” for airlines and railroads is intended to minimize the potential for disruption of the Nation’s transportation system through work stoppages. This section gives an overview of the negotiations process under the Act.
A key difference in the Railway Labor Act is that contracts do not have fixed expiration dates. Instead, they have “amendable” dates. After the amendable date, the provisions of the existing contract remain in effect until the parties reach a new agreement. New contract terms cannot be imposed unilaterally, and strikes or lockouts cannot be initiated, until the parties have progressed through several steps that are regulated by the National Mediation Board.
If the parties cannot reach a contract agreement on their own, either side may then apply for mediation services from the Board. Once mediation begins, negotiations continue until an agreement is reached or until the Board declares an impasse. At that point, the Board offers the option of voluntary binding arbitration. If either party rejects the offer, the Board “releases” the parties. Once released, the parties enter a 30-day “cooling-off period,” during which time the existing contract provisions remain in effect. At the end of the cooling-off period, if the parties still have not reached an agreement, the Board chooses whether to let the parties engage in “self-help”—that is, a strike by workers on the part of the union or a lockout or unilateral imposition of new contract terms on the part of management—or to refer the case to a Presidential Emergency Board composed of three neutral experts appointed by the President. The Presidential Emergency Board is allowed 30 days to deliberate and to formulate a recommended settlement. After the Presidential Emergency Board issues its recommendations, another 30-day cooling-off period begins. Finally, at the end of the second cooling-off period, the parties are free to engage in self-help. As a final recourse, after the expiration of the second cooling-off period, the President can refer the case to Congress, requesting that body to legislate a settlement.
In other words, once a contract becomes amendable, the parties are legally barred from self-help until the National Mediation Board releases them and the cooling-off periods expire. Theoretically, the parties could be prevented from self-help indefinitely, because the decision to release them while in mediation is at the discretion of the Board. Once the Board releases the parties, it is still a minimum of 30 days and a maximum of 90 days (the time from the beginning of the first cooling-off period, through the period during which the Presidential Emergency Board deliberates, to the end of the second cooling-off period) before the parties can strike or impose a lockout. It is generally recognized that, since deregulation, both Presidential
Emergency Boards and strikes have become relatively rare. However, providing data on the actual frequency of each step— mediation, arbitration, releases, Presidential Emergency Board deliberations, and strikes or lockouts—is one of the contri-butions of this article.
Data and methods
Sample. The data on the duration of negotiations and the resolutio n process are drawn from the Review of Collective Bargaining, a bulletin produced by the A irline Industrial R elations Conference (AIRCON). AIRCON is a nonprofit airline industry association that collects and distributes information on airline labor contracts and negotiations for its member carriers. Since 1984, AIRCON has periodically published the Review of Collective Bargaining, which updates the status of labor negotiations at member carriers. In addition to searching the AIRCON archives, archival searches of major newspapers (through Lexis/Nexis and Dow Jones Interactive) were used to fill in missing data points (for example, ratification dates) wherever possible.
The sample used in this article covers U.S. carriers that were members of AIRCON and includes contracts ratified between January 1, 1984, and December 20, 2002 (so that the sample includes contracts that became amendable as early as 1982, thus covering negotiating activity from 1982 to 2002). The sample was limited to contracts covering pilots, flight attendants, mechanics, fleet service personnel (when noted separately from mechanics), and clerical/agent personnel. Contracts for dispatchers and those in other miscellaneous occupations with relatively small employee bases were excluded. Next, contracts for which either an amendable date (for the previous contract) or a ratification date could not be identified also were excluded from the sample. This left 265 contracts. Finally, for most of the analyses that follow, initial contracts and midterm negotiations (as described shortly) were excluded. In the end, the core sample consisted of 199 contracts across 39 airlines and 17 unions.
How inclusive or representative is this sample of contracts? The original data source does not include every airline labor contract negotiated between 1982 and 2002. The Department of Transportation’s Form 41 database includes 142 U.S.-certificated airlines with positive revenue in the 1982–2002 period. Of those, 100 do not appear in the AIRCON bulletins. The average number of years during which these excluded carriers earned positive revenue was 5.5. The average number of contracts per year for the carriers in the sample used for this article was 0.5. Thus, an estimated maximum of about 275 contracts (100 × 5.5 × 0.5) are excluded from the sample. However, the actual number is probably far lower, because many of the excluded carriers were likely to have been less unionized than the carriers in the sample. The average annual revenue was $94 million (standard deviation of $105 million) for the excluded carriers and $2,016 million (standard deviation of $3,110 million) for the included carriers.
Thus, the missing carriers are considerably smaller than the carriers in the sample. As described later, a carrier’s size has a significant effect on the duration of negotiations. Hence, the mean duration reported here is almost certainly higher than the industry’s overall mean. To get a sense of the likely magnitude of this bias, the average duration of negotiations for small carriers in the sample was calculated. The maximum revenue of an excluded carrier was $2.4 billion and of an excluded passenger (as opposed to cargo) carrier was $980 million. Two-thirds of the excluded carriers had a maximum revenue of less than $500 million. The average duration of negotiations for carriers in the sample with revenues less than those three benchmarks were 10.39, 10.86, and 10.70 months, respectively. Thus, it would be fair to estimate that the excluded contracts averaged 10.5 months to negotiate, compared with 14.1 months for the overall sample.
Also, not every contract for the carriers that are in the sample is reported in the AIRCON bulletins. Nonetheless, there does not appear to be significant bias in those contracts which are selected for the bulletins.2 Finally, for data on airline characteristics and
industry economic conditions, the article relies on Form 41 filings—the quarterly reports on financial and operating results that carriers are required to submit to the Department of Transportation.3
Measurements. The central measurement, that of the duration of negotiations, is calculated in two ways. The first method, the result of which is captured in the variable duration1, counts the months elapsed between the date negotiations actually started and the date the contract was ratified. However, the actual starting date of negotiations is available only for about half of the contracts in the sample. The second method, the result of which is given in the variable duration2, counts the months elapsed between the amendable date of the previous contract and the ratification date of the contract under negotiation. The average difference between the starting date of the negotiations and the amendable date (for those contracts with an express starting date) was 1.3 months, with a standard deviation of 3.1 months. Thus, the amendable-date measure (duration2), on average, underestimates the actual negotiation time (duration1).
One concern in using the amendable-date measure is that there may be systematic patterns to the difference between the starting date of the negotiations and the amendable date. However, analysis of the data alleviates most of this concern. First, there is no systematic relationship between the overall duration of the negotiations and the differences between the two measures: longer negotiations do not systematically start earlier or later in relation to the amendable date. Second, there is no significant trend in the difference between the amendable date and the starting date of the negotiations over time, as long as the year 2000 is excluded. Interestingly, for a number of contracts that became amendable in 2000, talks began long before the amendable date, with the average starting date
being almost 6 months before the contract became amendable. Overall, however, the amendable-date measure should not exhibit any bias over time. Last, while there is variation in the average difference between the amendable date and the starting date of negotiations across carriers and unions, only one carrier (Pacific Southwest Airlines, PSA) and one union (the International Association of Machinists and Aerospace Workers, IAM) have means that are significantly different from
the overall average. Given this general absence of systematic bias in differences between amendable dates and starting dates, the analyses were conducted with the amendable dates (duration2) in order to utilize the larger sample.
Two anomalous types of contracts are worth noting: initial contracts (or “first contracts”) and midterm negotiations. An initial contract—the first contract negotiated after an em-ployee group has unionized—does not have an amendable date. For these contracts, the duration was calculated as the number of months between the first date of union repre-sentation (that is, when the National Mediation Board certifies an election victory) and the ratification date of the first contract. This tends to make initial contracts quite long in relation to the duration of negotiations for standard contracts. Midterm negotiations—negotiations begun more than a few months before the amendable date of the existing contract and with the intent of signing a new contract before the amendable date— typically end up with a very low duration of negotiations, because (by definition) they begin well before the amendable date and often are ratified before the amendable date arrives (leading to negative values, discussed in the next paragraph). Given the qualitatively different nature of these contracts and their very different average-duration measures (31.5 months for initial contracts, –10.7 months for midterm contracts; see table 1), they are excluded from the analysis, which is performed with only “standard” contracts (neither initial nor midterm contracts).
A few of the contracts in the sample have negative values (for example, –1.5 months) for the amendable-date measure. Negative values result when a new contract is ratified before the existing contract becomes amendable. This occurs primarily with midterm negotiations; hence, many of these negative values are excluded from the analysis. However, a few remain, so the reader is asked to keep in mind that such results do not represent problems or errors in the analysis.
For some analyses, we restrict the sample to “major” carriers only. Carriers identified as major in the sample are Alaska, American, America West, Continental, Delta, Eastern, Northwest, Pan American (Pan Am), Southwest, Trans World (TWA), United, and US Airways.
Descriptive results
Durations of negotiation. Table 1 summarizes the average duration of contract negotiations for various types of
con-tracts across all carriers and all years from 1982 to 2002. For “standard” contracts—all those except first contracts and those sealed through midterm negotiations—the industry average over those years was 14.1 months between the amendable date of the previous contract and the ratification date of the negotiated contract. The duration varied from as low as –11.5 months (agreements reached almost 1 year before the previous contract became amendable) to as high as 72 months (6 years). Contracts with the major carriers took 20 percent longer, with a 16.5-month average. For about half of the sample (121 standard contracts), an actual negotiation starting date, typically 1 or 2 months before the amendable date, was available. Measured from that date, contracts took an average of 16.0 months (1.3 years) to negotiate.4
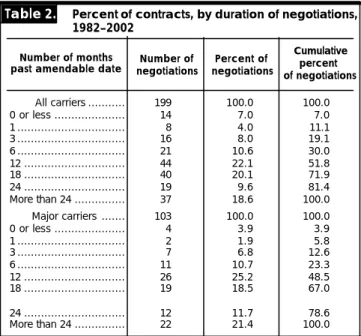
Table 2 shows the distribution of durations of negotiation relative to the amendable date. For example, 7 percent of the contracts were ratified before the amendable date of the previous contract, about half of the contracts were ratified by 1 year after the amendable date, and 81 percent of the contracts were ratified by 2 years after the amendable date, leaving 19 percent still in negotiations after 2 years. The major carriers’ distribution is shifted further out, with a smaller percentage of completed negotiations at every period. The two distributions provide a way to compare the airline industry against industries with contracts covered under the National Labor Relations Act. Comparison with other industries. Although no data are available that allow a direct comparison of the time required to reach agreements in airline negotiations with the time required to reach agreements in industries with contracts covered under the
National Labor Relations Act, a partial comparison can be made from a survey of a nationally representative sample of ne-gotiations conducted under the Act between 1994–96 and 1997– 99.5 Chart 1 compares the percentage of negotiations completed
within 1 month of the amendable date at all airlines and at major carriers against the percentage of negotiations completed within 1 month of the expiration date in the National Labor Relations Act sample. While differences in periods covered by these data, as well as differences between the legal and institutional settings in which the negotiations occur, caution against making too much of the comparisons, the differences are too large to dismiss. Under the National Labor Relations Act, 74 percent of contracts were settled before or within 1 month of their expiration date, compared with 11 percent of the airline contracts. The perception that negotiations in the airline industry take a long time is thus borne out by the data.
Frequency of occurrence of resolution processes. Table 3 presents the frequency of occurrence of the various resolution procedures administered by the National Mediation Board. The first point to note is that the system does seem to produce negotiated settlements: strikes (3 percent of cases) and even Presidential Emergency Boards (1.5 percent of cases) are rare occurrences.
However, it is not at all uncommon for these settlements to require an extended process and government intervention: half of the contracts went into mediation, and one-third of the mediated contracts (16 percent overall) were declared to be at an impasse and released into the cooling-off period. In addition, 19 percent of the contracts were initially rejected at least once by the rank and file.
These events have clear implications as regards the duration
Mean duration of negotiations, in months, by type of contract, 1982–2002
Number Minimum Maximum
Measured from amendable date: All contracts .. 265 12.1 17.6 –40.3 73.6 Midterm negotiations 40 –10.7 13.3 –40.3 34.2 Initial contracts 26 31.5 17.8 6.7 73.6 Standard contracts1... 199 14.1 13.3 –11.5 72.1 Standard contracts with major carriers ... 103 16.5 14.7 11.5 72.1 Measured from starting date of negotiations: Standard contracts1... 121 16.0 12.9 .8 52.8 Standard contracts with major carriers ... 59 19.3 13.6 .9 52.8 Standard deviation Table 1.
Percent of contracts, by duration of negotiations, 1982–2002 All carriers ... 199 100.0 100.0 0 or less ... 14 7.0 7.0 1 ... 8 4.0 11.1 3 ... 16 8.0 19.1 6 ... 21 10.6 30.0 12 ... 44 22.1 51.8 18 ... 40 20.1 71.9 24 ... 19 9.6 81.4 More than 24 ... 37 18.6 100.0 Major carriers ... 103 100.0 100.0 0 or less ... 4 3.9 3.9 1 ... 2 1.9 5.8 3 ... 7 6.8 12.6 6 ... 11 10.7 23.3 12 ... 26 25.2 48.5 18 ... 19 18.5 67.0 24 ... 12 11.7 78.6 More than 24 ... 22 21.4 100.0 Cumulative percent of negotiations Percent of negotiations Number of negotiations Number of months
past amendable date
Table 2.
Mean number of months Type of
contract
of negotiations. Table 3 indicates that mediated contracts take more than twice as long to reach agreement as those which settle without mediation (19.2 months, compared with 9.0 months), and a rejected tentative agreement adds about 6 months to negotiations (18.5 months, as opposed to 13.0 months, a 45-percent increase). (Of course, the negotiations that went into mediation could have taken even longer—or had a much higher probability of ending in a strike—without the availability of mediation.) Interestingly, voluntary arbitration is a rare event (3.5 percent of contracts). Clearly, the parties prefer to seek negotiated settlements.
Trends. Table 4 shows the average duration of all nego-tiations that began in a given year. (That is, the amendable date was in that year.) Chart 2 displays these annual averages graphically. The chart seems to indicate an increase in the duration of negotiations over time, but certainly not at a steady rate. To test whether there has been a statistically significant trend in the duration of negotiations over time, the method of ordinary least squares was used to regress duration2 on a time trend variable (equal to unity in 1981 and proceeding by increments to 20 in 2000). The resulting coefficient of 0.574 on the time trend variable was significant at the 99-percent
con-fidence level. This suggests that, on average, negotiations took about 19 days longer each successive year. Of course, as chart 2 indicates, the trend was by no means a smooth increase. When the sample is restricted to major carriers only, the trend loses its statistical significance altogether (and decreases in magnitude). Apparently, then, the temporally increasing trend is actually the result of the changing composition of carriers in the industry (or at least in the
Frequency of occurrence of resolution procedures administered by the National Mediation Board, 1982–2002 Mediation ... 99 49.8 19.2 14.0 Arbitration ... 7 3.5 5.2 14.6 Release ... 31 15.6 25.5 16.5 Presidential Emergency Board ... 3 1.5 36.2 18.3 Strike ... 6 3.0 20.2 11.6 Rejected tentative agreement ... 38 19.1 18.5 15.6 Procedure Duration of negotiations, in months Frequency (percent) Number Standard deviation Mean Table 3.
Chart 1.
Percent of contracts ratified more than 1 month past their expiration date, National
Labor Relations Act (NLRA) and airlines
0 20 40 60 80 100 0 20 40 60 80 100 Percent Private sector, 1994–96 (NLRA) Private sector, 1997–99 (NLRA) Public sector, 1997–99 (NLRA) All airlines, 1982–2002 Major airlines, 1982–2002 Percent
SOURCES: Airline Industrial Relations Conference, 1984–2001; Federal Mediation and Conciliation Service National Performance Review Surveys, 1994–96 and 1997–99.
All airlines, 1997–99
sample). Smaller carriers that also had shorter negotiation times were more prevalent in the early years of the sample and dropped out in the later years.
Table 5 displays the frequencies of resolution procedures
in different periods. The sample time frame is broken into five periods: 1982–85, 1986–89, 1990–93, 1994–97, and 1998–2000. The table shows a much higher reliance on National Mediation Board processes after 1997: in 1998–2000, the percentage of contracts that went into mediation jumped to 73 percent after averaging close to 50 percent for the previous four periods. Arbitration, always rare, did not occur at all in the latest period. No Presidential Emergency Boards were invoked until after 1993, and there have been three since. Curiously, the per-centage of released contracts is much lower in the most recent period, after having jumped up slightly in period 4. To some degree, this diminution may result from the fact that not all contracts that became amendable in 2000 had been re-negotiated by the end of the study; hence, those contracts were not included in the sample and were certainly likely to be in mediation and perhaps more likely to be released. Overall, table 5 lends more support to the belief that the labor relations system is taking longer and relying more heavily on gov-ernment intervention in the most recent period, relative to previous periods.
Carrier, occupation, and union averages. Tables 6 and 7 summarize the mean durations of negotiations by carrier,
Mean duration of negotiations, in months, 1983–2000
Number
of negotiations Mean number of months deviation Standard Year 1983 ... 17 13.5 6.9 Table 4. 1984 ... 19 6.4 6.9 1985 ... 26 10.0 17.3 1986 ... 8 10.5 15.1 1987 ... 15 10.9 13.2 1988 ... 10 18.0 15.8 1989 ... 17 14.1 14.7 1990 ... 14 20.1 13.6 1991 ... 4 5.2 3.8 1992 ... 8 19.9 9.8 1993 ... 8 11.7 13.4 1994 ... 6 18.0 12.5 1995 ... 8 19.3 14.0 1996 ... 12 25.3 16.0 1997 ... 11 16.5 8.4 1998 ... 3 21.1 11.7 1999 ... 4 8.3 6.6 2000 ... 8 13.7 5.5
Chart 2.
Average duration of contract negotiations, by starting year, 1983–2000
1983 1984 1985 1986 1987 1988 1989 1990 1991 1992 1993 1994 1995 1996 1997 1998 1999 2000 0 5 10 15 20 25 30 0 5 10 15 20 25 30 Number of months Number of months
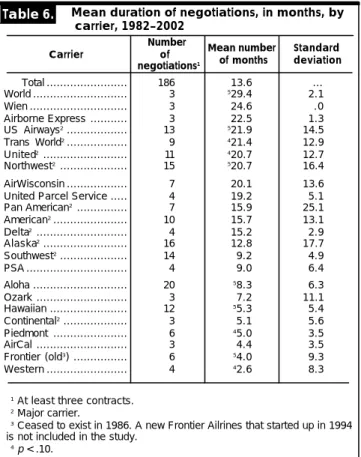
occupation, and union, sorted from longest to shortest. In table 6, only carriers with three or more contracts are included, and in table 7, only unions with two or more contracts are included.6 Table 6
indicates that there was substantial variation across carriers in the average duration of negotiations. World Airways had the longest average duration, 29.4 months, Western the shortest, 2.6 months. The major carriers can be relatively naturally divided into three groups: (1) those who took more than 20 months, on average (US Airways, TWA, United, and Northwest); (2) those who took about the average time of 14.1 months (Pan Am, American, Delta, and Alaska); and (3) those who took less than 12 months (Southwest and Continental). However, the variation within individual carriers across contracts is rather high. Thus, only US Airways and Northwest have means that are statistically different from the overall mean at greater than 95-percent probability. Note that Continental’s small number of contracts makes its very low mean not statistically significantly different from the average.
Table 7 reveals that the differences across occupations are not as large as those across carriers. When not joined with related ground crews, mechanics have a very high average, significantly different from the overall mean despite only four observations. Pilots have a slightly lower average (11.9 months) than the mean, one that is significant at the 90-percent confidence level.
There is more variation across unions. The highest average belongs to the combined International Association of Ma-chinists and Aerospace Workers and Aircraft Mechanics Fraternal Association, or “IAM-AMFA,” a designation which indicates that negotiations were begun by the IAM, but were concluded by the AMFA after it replaced the IAM. Not surprisingly, given the change in union representation, these negotiations took a long time. The International Brotherhood of Teamsters, at 20.6 months, is significantly above the average. The IAM and the Association of Flight Attendants are close to the average, while the Air Line Pilots Association International (ALPA) and the Transport Workers Union of America, at 10.4 months and 8.2 months, respectively, are below the average, but only ALPA’s average is statistically significantly different from the overall mean.
Procedure 1982–85 1986–89 1990–93 1994–97 1998–2002 Contracts (number) ... 63 50 34 37 15 Mediation ... 54 46 41 46 73 Arbitration ... 3 4 6 3 0 Release ... 16 14 15 22 7 Presidential Emergency Board ... 0 0 0 5 7 Strike ... 5 0 6 3 0 Rejected tentative agreement ... 14 16 15 35 20
Table 5. Frequency of resolution procedure, by period, 1982–2002
[In percent]
The wide range in the duration of negotiations suggests that there is nothing inherent in the framework of the Railway Labor Act that makes long negotiations inevitable. While some carriers and unions average almost 2 years, others have been able to average under 1 year. Of particular interest is the fact that the two major carriers with low averages for the duration of negotiations are also the two with reputations for the best labor relations among the majors.7 (The Continental contracts are all post-1991,
and four of the five were ratified after 1994). This fact adds evidence to the idea that contract negotiation durations and overall labor relations are connected.
Still, many observers would suggest that the duration of negotiations is driven by factors that are somewhat out of the control of carrier managements and union leaderships. In particular, a common notion is that negotiations will be shortest in bad times, when the survival of the carrier is more likely to be at stake. The next section tests explicitly whether the duration of negotiations can be partially explained by economic conditions.
Carrier size and economic conditions
Variables and model sp ecification. In order to analyze the effect of carrier size, carrier-level economic conditions, and industry economic conditions on the duration of contract negotiations, detailed financial and operational data from the carriers’ Form 41
Mean duration of negotiations, in months, by carrier, 1982–2002 Total ... 186 13.6 ... World ... 3 529.4 2.1 Wien ... 3 24.6 .0 Airborne Express ... 3 22.5 1.3 US Airways2... 13 521.9 14.5 Trans World2... 9 421.4 12.9 United2... 11 420.7 12.7 Northwest2... 15 520.7 16.4 AirWisconsin ... 7 20.1 13.6 United Parcel Service ... 4 19.2 5.1 Pan American2... 7 15.9 25.1 American2... 10 15.7 13.1 Delta2... 4 15.2 2.9 Alaska2... 16 12.8 17.7 Southwest2... 14 9.2 4.9 PSA ... 4 9.0 6.4 Aloha ... 20 58.3 6.3 Ozark ... 3 7.2 11.1 Hawaiian ... 12 55.3 5.4 Continental2... 3 5.1 5.6 Piedmont ... 6 45.0 3.5 AirCal ... 3 4.4 3.5 Frontier (old3) ... 6 54.0 9.3 Western ... 4 42.6 8.3 Standard deviation Number of negotiations1 Mean number of months Carrier Table 6.
1 At least three contracts. 2 Major carrier.
3 Ceased to exist in 1986. A new Frontier Ailrines that started up in 1994
is not included in the study.
4p < .10. 5p < .05.
filings to the Department of Transportation were used. From this database, a number of variables were constructed:
1. Organization size. To measure carrier size, the carrier’s annual revenue is used. To measure the number of employees covered by the negotiations, the number of employees in a given occupation (as reported in the Form 41 filings) at a given carrier in a year is calculated. (For example, this number might be the number of pilots at United in 1984.)
2. C a rrier economic conditions. A carrier’s economic condition is measured in three ways: by its profit rates (operating margin), debt levels, and revenue growth rates. The carrier’s operating margin is calculated as operating income (earnings before interest and taxes) divided by revenue. Both the current-period margin and a 3-year average margin (over times t, t – 1, and t – 2) were used. A carrier’s leverage is calculated as its total debt divided by total assets. Higher levels of debt relative to assets should provide some indication of how great the threat of bankruptcy is. Finally, a carrier’s growth rate is calculated as the percent change in revenue from t – 1 to t. As with margin, both a 1-year and a 3-year growth rate are posited.
In addition, the square of the operating margin was employed to test whether there is a nonmonotonic relationship between
Mean duration of negotiations, in months, by occupation and union, 1982–2002
Occupation Total ... 199 14.1 ... Mechanics only ... 4 533.5 23.0 Fleet service ... 6 19.0 9.6 Flight attendants ... 50 15.5 14.0 Agents ... 30 13.9 15.1 Mechanics and related .. 40 13.6 11.1 Pilots ... 69 311.9 11.9 Union1 Total ... 193 13.9 ... IAM-AMFA ... 2 539.0 24.1 APFA ... 3 327.4 11.7 IPA ... 2 21.8 7.2 IBT2... 26 520.6 14.8 APA ... 3 19.0 11.9 IAM2... 54 15.2 12.4 AFA2... 30 13.6 13.6 ALPA2... 54 410.4 12.2 ALEA ... 3 8.7 12.3 TWU2... 11 8.2 6.1 SAPA ... 3 7.3 1.3 IUFA ... 2 5.4 3.8 1 At least two contracts.
2 Major union. 3p < .10. 4p < .05. 5p < .01. Number of negotiations Standard deviation Mean number of months Occupation or union Table 7.
profitability and duration of negotiations. (That is, an answer was sought to the question, “ Do extremes of profitability in either direction have the same impact on negotiations?”)
Finally, anecdotal evidence from the industry suggests that negotiations become particularly difficult—and hence lengthy— if the economic conditions facing the bargaining parties change significantly once bargaining has started. In particular, for negotiations that start near a peak in profits, but extend into the beginning of bust years, unions looking back and expecting wage raises are pitted against managements looking forward and hoping for wage freezes (or cuts). To test whether changes in conditions after the start of negotiations had a significant effect on the duration of the negotiations, the change in operating margin from the year negotiations began to the next year was calculated.
3. Industry economic conditions. Economic measures similar to those calculated for the carrier were also calculated for the industry as a whole. Industry-level totals are computed by summing revenue and operating income for all carriers in the Form 41 database. With these totals, the various ratios are calculated. For the industry, operating margin and revenue growth were measured, and, again, the 1-year and 3-year average measures were calculated for both. Also, industry margin is squared, to test for nonmonotonic effects. Finally, a change in margin was computed to test the “change-in-conditions” hypothesis.
Results. Summary statistics on the economic variables are presented in table 8. The method of ordinary least squares was used to regress the duration of negotiations (duration2) on the variables just described, as well as on dummy variables for the year, airline, occupation, and union. A number of the variables had no significant coefficients, either alone or in various combinations. Carrier size and some measures of growth yielded some significant results, but neither the profitability measures nor the change-in-profitability measures generated any significant coefficients.8 The results presented use only those
measures which had significant coefficients in some specifications. Table 9 gives the results of the ordinary least-squares regressions. Columns 1 through 5 do not include carrier dummies, whereas columns 6 through 12 do.
The coefficient on the time trend is positive and significant in every model, except when year dummies are included. This is true even when carrier dummies are included (columns 6, 7, 9, 10, and 11), suggesting that the duration of negotiations has increased significantly over time, even after controlling for changes in the composition of the sample. However, adding year dummies to control for idiosyncratic year effects renders the trend insignificant.
and highly significant in columns 1 through 5, which take into account cross-airline size variation. The revenue coefficient is insignificant, however, in each model with carrier fixed effects, implying that the duration of negotiations for a given carrier does not increase significantly as the carrier grows larger. Nonetheless, in the cross section, in which size differences among airlines can be quite large, larger airlines do take longer to negotiate contracts than smaller airlines
take. The coefficient on carrier size, when it is significant, is approximately 0.7, implying that a $1 billion size differential between carriers entails about a 22-day differential in the duration of negotiations. The difference between the smallest and largest revenue values is $19.3 billion, which translates into a maximum 14-month difference in the duration of negotiations.
There is some evidence that higher carrier growth rates
Summary statistics, economic variables used in analysis
Year ... 199 ... ... 1982 2000 Trend ... 199 9.6 5.14 2 20 duration2 (amendable) ... 199 14.10 13.27 –11.53 72.06 Employees (thousands) ... 137 4.0 5.0 .0 26.8 Revenue ($billions) ... 192 3.2 4.2 .02 19.3 Margin ... 192 .03 .08 –.29 .18 Three-year margin ... 174 .03 .06 –.17 .16 Margin squared ... 192 .006 .010 .000 .084 Debts/assets ... 192 .34 .17 .001 1.32 Growth ... 191 .10 .14 –.64 .54 Three-year growth ... 152 .10 .10 –.29 .43 Margin change (t + 1) ... 181 –.01 .07 –.27 .17 Margin change squared ... 181 .005 .012 .000 .0075 Industry margin ... 199 .03 .03 –.02 .08 Three-year industry margin ... 181 .03 .02 –.02 .07 Industry growth ... 198 .08 .03 –.01 .14 Three-year industry growth ... 162 .08 .02 .03 .11 Industry margin change (t + 1) ... 191 .001 .025 –.051 .045 Industry margin change squared .... 191 .001 .001 .000 .002
Number of observations
Standard
deviation Minimum Maximum
Mean Variable
Table 8.
Ordinary least-squares regressions of duration of negotiations on carrier and industry financial conditions, with and without fixed effects
1 2 3 4 5 6 7 8 9 10 11 12
Time trend ... 10.336 20.376 20.571 10.535 –0.464 30.795 20.671 0.013 20.963 20.971 20.702 0.446
(.196) (.198) (.308) (.308) (.275) (.206) (.304) (.508) (.403) (.403) (.294) (.509) Revenue (billions of dollars) . 3.700 3.683 3.703 3.683 3.698 – .332 .261 .162 .142 .198 –.205
(.240) (.239) (.590) (.259) (.222) – (.574) (.663) (.677) (.678) (.542) (.639) One-year carrier growth ... – 7.25 – 10.96 6.18 218.86 218.36 14.77 – 9.77 218.05 115.60
– (6.82) – (8.35) (9.26) (8.43) (8.49) (9.80) – (10.33) (8.01) (9.33) Three-year industry growth
(average, t – 3 to t) ... – – 81.5 56.3 – – – – 2128.7 1108.0 – –
– – (59.5) (62.4) – – – – (60.4) (64.3) – – Fixed effects ... – – – – year – – year – – – year – – – – – carrier carrier carrier carrier carrier carrier carrier – – – – – – – – – – union union Adjusted R2... .082 .085 .075 .079 .206 .225 .221 .249 .215 .214 .329 .350 N... 192 191 155 155 191 191 191 191 155 155 191 191
Independent variable With carrier fixed effects
Table 9.
Without carrier fixed effects
1p < .10. 2p < .05. 3p < .01.
NOTE: Dash indicates variable not included in regression reported in column. Numbers in parentheses are estimated standard errors.
lead to longer negotiations, but these results are not robust, because they depend strongly on the measurement and model chosen. Both a carrier’s 1-year growth rate and the industry’s 3-year average growth rate have positive coefficients in all models. However, the significance of those coefficients is not consistent. For example, a carrier’s 1-year growth rate has a significant positive coefficient in several of the models with carrier fixed effects, implying that, as carriers register higher growth rates, the duration of their contract negotiations gets longer. However, the coefficient is not significant in the cross section (without the carrier fixed effects). The same is true for the 3-year average of industry growth. Furthermore, neither the carrier-level 3-year average growth nor the industry-level 1-year growth has significant coefficients in any model. (These results are not shown in table 9). Hence, there is some evidence that higher growth may lead to a longer duration of negotiations, but the finding is not robust. Adding fixed effects for unions (columns 11 and 12) enhances the precision of the estimated coefficients of the other independent variables, but does not alter any of the basic patterns.
Overall, table 9 indicates that (1) over time, contracts are taking longer to negotiate, even after controlling for the composition of the sample and for increasing carrier size; (2) larger carriers are associated with a longer duration of negotiations; and (3) higher growth rates, too, may correlate with a longer duration of negotiations. Surprisingly, none of the profitability measures, nor the leverage measure, had any important effect on the duration of negotiations. Neither did any of the measures of changing economic conditions after negotiations. These various measures of a carrier’s financial health are not significantly correlated with the duration of a carrier’s negotiations.
Looking directly at the fixed effects indicates that the identities of the bargaining parties help explain much more of the significance than do objective economic conditions. Table 10 reports the R2 statistics when duration of negotiation is
regressed on various combinations of fixed effects. For example, fixed effects for years by themselves account for 16 percent of the variation in the duration of negotiations across
contracts (column 1). Including fixed effects for the year, airline, occupation, and union accounts for more than 60 percent of the variation in duration (column 11). Controlling only for the identity of the bargaining parties—airline and union—accounts for 48 percent of the variation (column 6). Thus, the identity of the bargaining parties provides more predictive power than does any of the other variables.
DATA ON A LARGE SAMPLE OF AIRLINE LABOR CONTRACTS
indicate that the industry’s labor negotiations take 1.3 years, on average, to conclude. Only 11 percent of contracts are concluded by 1 month after the amendable date, in contrast to 74 percent of contracts negotiated under the National Labor Relations Act. Half of airline negotiations go into Federal mediation.
The data presented in this article broadly support the notion that the industry’s negotiations are lasting longer in recent years, although the trend over time is not at all monotonic and results partly from the fact that carriers which survived longer tended to have longer average negotiations. (That is, carriers with shorter negotiation times exited the sample over time.) The reliance on Federal intervention is clearly higher than ever in recent years, with almost 75 percent of the negotiations begun in 1998 through 2000 going into mediation and with several Presidential Emergency Boards being invoked, whereas there had been none from deregulation until 1994.
Not surprisingly, negotiations take longer at larger airlines. The average duration of negotiations for major carriers was 20 percent higher than the overall sample average. However, the data support neither the hypothesis that a carrier’s financial health affects the duration of negotiations nor the hypothesis that a significant change in economic conditions after the start of negotiations adds to the expected duration. There is limited (but not robust) support for the idea that negotiations take longer while the carrier or industry is experiencing high growth rates.
Most interesting is the fact that the identities of the bargaining parties are the major predictors of the duration of negotiations. There is noticeable variation across carriers and unions in the average negotiation time. While one tier of major carriers
Dependent variable
Table 10. Ordinary least-squares regressions of duration of negotiations on dummy variables for year, airline,
1 2 3 4 5 6 7 8 9 10 11
Year effects ... Year – – – – – – – Year Year Year Carrier effects ... – Carrier – – Carrier Carrier – Carrier Carrier Carrier Carrier Occupation effects – – Occupation – Occupation – Occuption Occupation Occupation – Occupation Union effects ... – – – Union – Union Union Union – Union Union Adjusted R2... .16 .337 .059 .177 .404 .484 .203 .504 .516 .597 .608
N... 199 199 199 199 199 199 199 199 199 199 199
Number of months between ratification and amendable dates
occupation, and union
averages almost 2 years to complete negotiations, another tier averages under 1 year. The examples of Southwest Airlines and Continental Airlines are the strongest indications that ne-gotiations conducted under the Railway Labor Act are neither “destined” nor “doomed” to last more than a year.
As participants in, and observers of, the airline’s labor re-lations system discuss proposals to reform the system, the analysis presented in this article provides useful data-driven input into that process. It does seem to be the case that the system is experiencing increasing strains, as is evidenced in long
nego-tiation times and heavy reliance on mediation. However, the source of those strains is not necessarily solely the industry’s economic conditions nor the regulatory framework. Some parties are able to agree on and stick to principles and processes that generate noticeably shorter negotiation times, which also helps match their contracts to prevailing economic circumstances. Future research on the comparative practices of carriers with long durations of negotiation and those with short durations of negotiation would be valuable in improving the effectiveness of the industry’s overall labor relations system.
Notes
ACKNOWLEDGMENTS: The authors thank Rob DeLucia at the Airline Industrial Relations Conference for his insights and generous coop-eration, as well as for access to the data. Robert McKersie and Jody Hoffer Gittell offered helpful comments, and Matthew Brooks provided valuable research assistance. We especially thank the Alfred P. Sloan
Foundation and the MIT Global Airline Industry Program for financial
slightly less time (1.9 – 1.3 = 0.6 month) to negotiate than the set of contracts for which negotiation starting dates were known. The difference is small enough that one should be comfortable comparing the two samples.
5 For a description of the data and the sample, see Joel
Cutcher-Gershenfeld, Thomas A. Kochan, and John Calhoun Wells, “How do
labor and management view collective bargaining?” Monthly Labor
Review, October 1998, pp. 23–31.
6 For reasons of spaces, only the abbreviations of the names of the
unions are listed in the table. The abbreviations and the names they
stand for are as follows: IAM—International Association of Machinists
and Aerospace Workers; AMFA—Aircraft Mechanics Fraternal
Association; APFA—Association of Professional Flight Attendants;
IPA—Independent Pilots Association; IBT—International Brotherhood
of Teamsters; APA—Allied Pilots Association; AFA—Association of
Flight Attendants; ALPA—Air Line Pilots Association; TWU—Transport
Workers Union; SAPA—Southwest Airlines Pilots Association; ALEA—
Airborne Law Enforcement Association; IUFA—Independent Union of
Flight Attendants.
7 Hoffer Gittell, von Nordenflycht, and Kochan, “Mutual Gains or
Zero Sum,”; see also Jody Hoffer Gittell, The Southwest Airlines Way
(New York: McGraw-Hill, 2003).
8 The coefficient on margin squared comes up significantly negative
in the non-fixed-effects model, but the result is driven by three observations on small carriers with short negotiation times and large operating losses (for example, less than –20 percent). The significance o f t h i s c o e f f i c i e n t d i s a p p e a r s c o m p l e t e l y w h e n t h e s e t h r e e observations are dropped from the analysis.
support.
1 See Jody Hoffer Gittell, Andrew von Nordenflycht, and Thomas A.
Kochan, “Mutual Gains or Zero Sum? Labor Relations and Firm
Performance in the Airline Industry, “Industrial and Labor Relations
Review, in press; and Thomas A. Kochan, Andrew von Nordenflycht, Robert B. McKersie, and Jody Hoffer Gittell, “Out of the Ashes: Options for Rebuilding Airline Labor Relations, “ Massachusetts Institute of Technology, Sloan School of Management Working Paper, 2003.
2 An investigation of the average nunber of contracts per
occu-pation suggests that the coverage is reasonably complete and the exclusions are not systematic. (It does seem, howe ver, that, except for pilots’ contracts, contracts at Southwest began appearing only after 1989.)
3 The Form 41 data were accessed through a database compiled by
Data Base Products, Inc., of Dallas, Texas.
4 For the 121-contract sample, the mean difference between the
negotiation starting date and the amendable date was 1.3 months. However, the 16.0-month average duration of the 121-contract sample was 2.1 months longer than the 14.1-month average of the 199-contract sample. This difference implies that the set of 199-contracts for