NBER WORKING PAPER SERIES
STRATEGIC ENTRY DETERRENCE AND THE BEHAVIOR OF PHARMACEUTICAL
INCUMBENTS PRIOR TO PATENT EXPIRATION
Glenn Ellison
Sara Fisher Ellison
Working Paper 13069
http://www.nber.org/papers/w13069
NATIONAL BUREAU OF ECONOMIC RESEARCH
1050 Massachusetts Avenue
Cambridge, MA 02138
April 2007
This work was supported by the National Science Foundation (grants SES-9818534, SES-0219205,
and SES-0550897), the Sloan Foundation, and the Hoover Institute. We thank Emek Basker, Tom
Chang, David Hwang, and Alan Sorensen for excellent research assistance, Gillian Currie for help
in constructing the data set, Katie MacFarlane for guidance on institutional details, and Ditas Riad
and Rhea Mihalison for their assistance on data issues. We also thank Fiona Scott Morton for her
part in our joint data collection efforts and for providing other data to us. Finally, we thank Marcus
Asplund, Ernie Berndt, Steve Berry, Richard Blundell, Judy Chevalier, Paul Joskow, Nancy Rose,
Otto Toivanen, and seminar participants at various schools for helpful comments. The views expressed
herein are those of the author(s) and do not necessarily reflect the views of the National Bureau of
Economic Research.
© 2007 by Glenn Ellison and Sara Fisher Ellison. All rights reserved. Short sections of text, not to
exceed two paragraphs, may be quoted without explicit permission provided that full credit, including
© notice, is given to the source.
Strategic Entry Deterrence and the Behavior of Pharmaceutical Incumbents Prior to Patent
Expiration
Glenn Ellison and Sara Fisher Ellison
NBER Working Paper No. 13069
April 2007
JEL No. L13,L65
ABSTRACT
This paper develops a new approach to testing for strategic entry deterrence and applies it to the behavior
of pharmaceutical incumbents just before they lose patent protection. The approach involves looking
at a cross-section of markets and examining whether behavior is nonmonotonic in the size of the market.
Under certain conditions, investment levels will be monotone in market size if firms are not influenced
by a desire to deter entry. Strategic investments, however, may be nonmonotone because entry deterrence
is unnecessary in very small markets and impossible in very large ones, resulting in overall nonmonotonic
investment. The pharmaceutical data contain advertising, product proliferation, and pricing information
for a sample of drugs which lost patent protection between 1986 and 1992. Among the findings consistent
with an entry deterrence motivation are that incumbents in markets of intermediate size have lower
levels of advertising and are more likely to reduce advertising immediately prior to patent expiration.
Glenn Ellison
Department of Economics
Massachusetts Institute of Technology
50 Memorial Drive, E52-380A
Cambridge, MA 02142-1347
and NBER
gellison@mit.edu
Sara Fisher Ellison
Department of Economics
Massachusetts Institute of Technology
50 Memorial Drive, E52-274B
Cambridge, MA 02142-1347
sellison@mit.edu
1
Introduction
The insight that firms may make “strategic investments” to alter future competitive con-ditions is one of the most fundamental ideas in industrial organization. The chapter on “Entry, Accomodation, and Exit” is easily the longest in Tirole’s (1988) text. In it, Tirole reviews arguments about how excess capacity, capital structure, advertising, contractual practices, learning-by-doing, and long-run decisions can be used to deter entry.1 Strategic investment models are difficult to test directly, however, and the vast majority of this lit-erature is theoretical. In this paper, we propose a new empirical approach for examining strategic entry deterrence.
Our applied focus is on the pharmaceutical industry. Using a panel of drugs that lost their U.S. patent protection between 1986 and 1992, we explore how pharmaceutical incumbents have dealt with the threat of generic entry. We examine incumbents’ advertis-ing, product proliferation, and pricing decisions as patent expiration approached, and ask whether the behaviors appear to be influenced by an entry-deterrence motive.
We begin in Section 2 with a discussion of strategic entry deterrence and some moti-vation for our approach. We modify the textbook model to bring it closer to empirical applications: we assume that entry costs are random and unknown to the incumbent so that it is impossible to perfectly forecast whether entry will occur. We review what is meant by “strategic entry deterrence” in this setting. We note that the incentive to deter entry will be stronger in intermediate-sized markets than in very small or very large markets. In the former, no investments are needed to deter entry. In the latter, deterring entry is often impossible. A simple numerical example illustrates how the nonmonotonicity of the entry-deterrence incentive can lead to a nonmonotonic relationship between equilibrium investment levels and market size.
Our approach to testing whether firms are actively trying to deter entry is a classic reduced-form approach: we identify a prediction of the strategic investment model that dif-fers depending on whether firms take entry-deterrence benefits into account when choosing
1
Some of the classic papers in this literature are Bulow, Geanakoplos, and Klemperer (1985), Fudenberg and Tirole (1983a, 1983b, 1984), Dixit (1980), Schmalensee (1978, 1981), Gelman and Salop (1983), Judd (1985), Aghion and Bolton (1987), and Cooper (1986).
their actions; and then test this prediction. The formal results underlying the approach are presented in Section 3. Our main IO theory result is a demonstration that, under specified conditions, actions will be monotonically related to a market size parameterif firms are not influenced by an entry deterrence motive. Several examples are used to provide intuition for the required conditions. The important implication of the theoretical result is that one can reject the null hypothesis that firms are not actively trying to deter entry by testing and rejecting the hypothesis that there is a monotonic relationship between firms’ actions and market size in a cross-section of markets.
Several recent papers have discussed ways of performing statistical hypothesis tests that a relationship is monotonically increasing.2 Section 4 contains a brief discussion of this lit-erature, a description of the tests we will use, and some additional monotonicity theorems relating to models with measurement error and endogenous right-hand side variables. Ro-bustness to such factors is a potential advantage of an approach focusing on monotonicity. In Section 5 we turn our attention to the pharmaceutical industry. The pharmaceutical industry is an important industry that has attracted a great deal of attention in policy circles. It also has several features that make it a nice environment in which to study strategic entry deterrence. One of these is that one can obtain a sizable sample of similarly situated incumbents facing a threat of entry by looking at manufacturers of branded drugs whose patent protection is about to expire. Another is that there are several potential tools that incumbents might use to deter entry, and we were able to obtain data on several of the most important: advertising, product proliferation, and pricing. A third is that there is a change in entry conditions within each market—entry is prohibited until a known date. Our approach to testing for strategic entry deterrence only requires a single cross-section, but having data both on actions immediately prior to patent expiration and actions in earlier years when patent expiration was less salient allows us to also implement a difference-in-differences version of our test.
The first thing we do in our analysis is to identify a proxy for “market size” and note that our dataset contains sufficient heterogeneity in market size to make it plausible that
2
These include Hall and Heckman (2000), Ghosal, Sen and van der Vaart (2000), and Gijbels, Hall, Jones and Koch (2000).
we could find nonmonotonicities. Specifically, revenue received in the U.S. in the years immediately prior to patent expiration can serve as a proxy for market size because it is a strong predictor of whether generic entry will occur.3 The lowest-revenue drugs in our dataset are unlikely to ever face generic competition. For high-revenue drugs generic entry is a near certainty.
We then examine four incumbent behaviors that might plausibly be involved in an entry deterrence strategy. “Detail advertising” is the practice of sending representatives to doctors’ offices to promote a drug via one-on-one conversations. “Journal advertising” is the placement of advertisements for a drug in medical journals. We use the term “presentation proliferation” to refer to firms’ decisions about whether to sell a drug in small or large number of presentations, e.g. should it be offered just in a 100mg tablets or should the firm also produce a 50mg tablet, a 200mg tablet, a gelcap, an oral liquid, etc. Finally, we examine pricing. The literature on “limit pricing” is one of earliest and best known parts of the entry deterrence literature.4
We look for evidence that each of these behaviors is influenced by the entry-deterrence motive in two ways. First, we take a pure cross-sectional approach: we look at the relation-ship between each behavior and pre-expiration revenues in the cross-section of drugs and test whether the relationship is nonmonotonic. We find some evidence of nonmonotonicity in the journal advertising data. The form of the nonmonotonicity is that journal adver-tising is unusually low for drugs in intermediate-sized markets. This is what one would expect under a strategic-entry deterrence theory: firms in intermediate-sized markets have an incentive to let their market languish to make it less attractive to generic entrants.
Second, we examine how incumbents change their behavior as patent expiration nears. We find some evidence of a nonmonotonic relationship between behavior changes and mar-ket size in detail advertising and (less strongly) in product proliferation. The changes in detail advertising have a similar pattern to that noted above: it is most likely to be reduced in the intermediate-sized markets.
We conclude that there appears to be some evidence of strategic entry-deterrence by 3
Grabowski and Vernon (1992), Bae (1997), and Scott Morton (2000) previously reported similar results.
4
See, for example, Gaskins (1971), Milgrom and Roberts (1982), Fudenberg and Tirole (1986), and Klemperer (1987).
pharmaceutical incumbents. More broadly, we hope that our results also suggest that monotonicity tests may be a useful way to provide evidence on “strategic investment” theories in industrial organization and other fields.
Our paper can be seen as related to two empirical literatures in industrial organization. First, a number of papers have previously explored pricing, advertising, and entry in the pharmaceutical industry.5 Most closely related to our work is Caves, Whinston and Hurwitz (1991), a descriptive study based on thirty drugs with patents expiring between 1976 and 1987. They look mostly at the average behavior of incumbents before and after expiration and also separate drugs into low and high revenue categories and see if incumbent adver-tising behavior differs. Scott Morton (2000) focuses on the determinants of generic entry in a data set that overlaps substantially with ours. In addition to looking at exogenous market characteristics, she also looks for effects of incumbents’ advertising expenditures on the probability of generic entry. Grabowski and Vernon (1992) also study a panel of drugs with expiring patents and focus on post-entry behavior of both incumbents and generic entrants. Ellison and Wolfram (2006) examine pricing as a potentially strategic investment to forestall future regulation. They find that price increases by pharmaceutical firms during the Clinton health care reform debate were related to measures of firms’ potential losses from drug price regulation.
A second literature to which we contribute is the empirical literature on strategic entry deterrence (and entry accommodation). Developing structural tests of whether particular investments are strategic has been seen as difficult. The one paper we are aware of that has attempted this approach is Kadiyali’s (1996) study of the market for film. Kadiyali estimates price and advertising elasticites and argues that observed levels of price and advertising by Eastman Kodak were inconsistent with static monopoly profit maximization but consistent with entry deterring behavior. It has been more common to provide indirect evidence that investments are chosen strategically by showing that investments do affect
5
Some notable papers are, for instance, Masson and Steiner (1985), Comanor (1986), Grabowski and Vernon (1990), Caves, Whinston and Hurwitz (1991), Frank and Salkever (1992), Scherer (1993), Berndt, Griliches and Rosett (1993), Griliches and Cockburn (1994), Berndt, Cockburn and Griliches (1996), Frank and Salkever (1997), Ellison, Cockburn, Griliches and Hausman (1997), Lu and Comanor (1998), Ellison (1998), Scott Morton (1999), and Ellison and Wolfram (2006). There are a number of books of interest about the economics of pharmaceuticals including Walker (1971), Schwartzman (1976), Temin (1980), and Schweitzer (1997).
future competition (which will lead us to conclude that investments must be strategic if we believe that firms are rational and aware of the effect on competition). One can think of Chevalier’s (1995a, 1995b) studies of the effect of capital restructuring on entry and exit and supermarket pricing, Lieberman’s (1987) discussion of the responses by incumbents in chemical industries to rivals’ additions of capacity, and Scott Morton’s (2000) discussion of the effects of advertising on entry as providing evidence of this sort. Lieberman also looks for evidence of entry deterring behavior in cross-sectional patterns in examining whether there is more excess capacity in markets which are more concentrated. A third approach taken by Goolsbee and Syverson (2004) in the airline industry is to examine how incumbent behavior changes in response to exogenous changes in potential entry that otherwise have no effect on current competitive conditions.6
2
Strategic entry deterrence
In this section we develop a simple model to review the idea of strategic entry deterrence and bring out its implications in a framework suited to empirical applications. We use a numerical example to illustrate how nonmonotonic patterns can arise in cross-section data.
2.1 A model
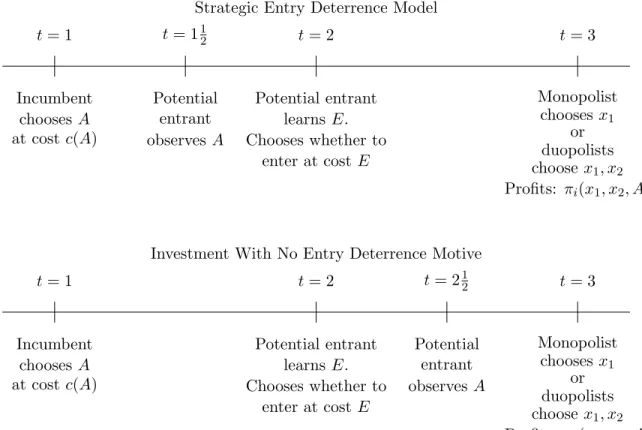
The prototypical model of strategic entry deterrence is a three-stage game like the first one in Figure 1. In the first stage, the incumbent firm 1 chooses an investment level A at a cost ofc(A). Assume thatc0(A)>0 and c00(A)≥0. Before the second stage, the potential entrant (firm 2) observes the incumbent’s choice of A. Firm 2 then chooses whether to enter the market, which requires paying a sunk cost of E. In the third stage, either the incumbent is a monopolist or the incumbent and entrant compete as duopolists. If the incumbent is a monopolist, assume that it chooses some action xm1 (A) in the third period and as a result earns profits, πm∗
1 (A) ≡ π1(xm1 (A), A). If entry occurs, assume that the unique Nash equilibrium of the third stage game involves the firms choosing actionsx∗1(A) and x∗2(A) and receiving profits πid∗(A) ≡ πid(x1∗(A), x∗2(A), A). Assume that πm1 ∗(A) and
6
Other approaches have also been taken in a few papers. Smiley (1988) reports evidence from surveys of firms about what strategies they use to deter entry. Cooper, Garvin and Kagel (1997) examines a limit-pricing model experimentally. Dafny (2005) applies our approach in studying hospital markets.
πid∗(A) are concave, and that the firms’ best responses are always interior and given by the unique solution to the first-order conditions.
Tirole (1988) describes how a large number of classic papers in industrial organization (and corporate finance and international trade) can be fit within this framework. The key insight is that the “investment”Acan be any action that is not easily undone. The could be a standard investment like building a new plant that will have a lower marginal production cost. It could also, however, be something like a lobbying expenditure, choosing a product design that makes the product less (or more) similar to other products, building up goodwill through an advertising campaign, or taking on debt. Entry deterring investments can be welfare-reducing, but this need not be the case.
The one departure we have made from the way strategic investment models are presented in Tirole (1988) (and in most papers) is that we assume that the entry costE is stochastic with CDF F(E) and that Firm 2 learns the entry cost before making its entry decision. The primary consequence is that Firm 1 will not know for sure whether entry will occur when making its investment decision. We think that this is a more realistic depiction of the situation firms face in the real-world and as well as a necessary modification for empirical applications.
2.2 The strategic entry deterrence incentive
In this model, the incumbent firm 1 is said to practice “strategic entry deterrence” in that it “distorts”A away from the level that maximizes profits (holding firm 2’s entry probability fixed) in hopes of deterring entry by firm 2. More precisely, let A∗ED be the sequential equilibrium choice of A in this model. What IO economists mean when they say that investment is “distorted” is that A∗ED differs from the investment level, A∗N D, that would be chosen in the second game pictured in Figure 1.7 In the second game, firm 2 does not observe firm 1’s investment level until after the entry decision has been made. Hence, investment can not have a causal effect on the entry decision. The nonstrategic investment
7
To avoid confusing people who know the literature we should note that we have simplified the standard presentation to omit any mention of strategic entry accomodation. Our assumption thatA is observed at t= 212 in the model “with no strategic entry deterrence motive” implies that bothA∗N Dand A
∗
ED reflect
strategic entry accomodation effects. Hence, any differences between A∗ED and A
∗
N D are entirely due to
Strategic Entry Deterrence Model t= 1 t= 2 t= 3 Incumbent chooses A at costc(A) Potential entrant learnsE. Chooses whether to enter at costE Monopolist chooses x1 or duopolists choose x1, x2 Profits: πi(x1, x2, A) t= 112 Potential entrant observes A
Investment With No Entry Deterrence Motive
t= 1 t= 2 t= 3 Incumbent chooses A at costc(A) Potential entrant learnsE. Chooses whether to enter at costE Monopolist chooses x1 or duopolists choose x1, x2 Profits: πi(x1, x2, A) t= 212 Potential entrant observes A
levelA∗N D can be thought of either as reflecting what would happen if there was no entry deterrence motive or as reflecting what would happen if there was an entry deterrence motive but the incumbent ignored it. Whether incumbents behave in this manner can be of interest for several reasons. For example, antitrust authorities may insist that firms do not take actions that serve only to eliminate future competition, and economists may want to know whether firms are sufficiently rational and forward looking to invest strategically (and whether the long-run consequences of an investment are what we think they are).
Aspects of the strategic entry deterrence motive are most apparent in the first-order conditions that describe A∗ED and A∗N D. In the strategic entry deterrence model, firm 1’s expected profit is a function of its first period investment:
E(π1(A)) =F(π2d∗(A))πd ∗ 1 (A) + (1−F(πd ∗ 2 (A)))πm ∗ 1 (A)−c(A).
In the model with no strategic entry deterrence motive, firm 1’s expected profit depends both on the actual value ofAand on firm 2’s belief about the value ofAthat was chosen in the first period. In equilibrium, firm 2 will assign probablility one to firm 1 having chosen
A∗N D, so firm 1’s profit function is
E(π1(A, A∗N D)) =F(π2d∗(A∗N D))π1d∗(A) + (1−F(π2d∗(A∗N D)))π1m∗(A)−c(A).
The first-order conditions for the equilibrium investment levels in the two models are thus c0(A∗N D) = F(πd2∗(A∗N D))∂π d∗ 1 ∂A (A ∗ N D) + (1−F(πd ∗ 2 (A ∗ N D))) ∂π1m∗ ∂A (A ∗ N D) c0(A∗ED) = F(πd2∗(A∗ED))∂π d∗ 1 ∂A (A ∗ ED) + (1−F(π2d∗(A∗ED))) ∂π1m∗ ∂A (A ∗ ED) +(πd1∗(A∗ED)−πm1 ∗(A∗ED))dπ d∗ 2 dA (A ∗ ED)f(π2d∗(A∗ED)).
The difference between the two first order conditions is the presence of the final term in the first-order condition for A∗ED. This term is the “strategic entry deterrence” incentive. Because firm 1’s profit is higher when it is a monopolist, it has an incentive to distort its investment to reduce firm 2’s profit (which reduces the likelihood of firm 2 entering).
The main observation about the strategic entry deterrence incentive we would like to highlight is that it may be larger in intermediate-sized markets than in very small or very
large markets. The incentive is a product of three terms. The third of these,f(π2d∗(A∗ED)), is the likelihood that firm 2’s fixed entry costs are exactly equal to the equilibrium profits firm 2 would earn at the post-entry stage, making firm 2 indifferent between entering and not entering. In very small markets this likelihood will be small because the fixed entry costs will almost surely be much larger than the duopoly profits. In very large markets it will be small because the fixed entry costs will almost surely be much smaller than the duopoly profits. In intermediate-sized markets there is a greater chance that the investment will have a pivotal effect on entry.
2.3 An example of entry-deterrence in a cross-section of markets
In this section, we present a concrete example of a strategic investment model and discuss cross-sectional implications.
Example 1 Consider a cross-section of markets. Suppose that the ith market has a mass
zi of potential consumers, but that the markets are otherwise identical. LetAreflect
expen-ditures on a form of advertising that raises potential consumers’ valuations for all products in the product class. More specifically, assume that each market contains consumers with heterogeneous types,θ, distributed uniformly uniformly on [0,1], and that if the monopolist spends ziA2/2 on advertising in market i, a consumer of type θ receives utility θA−p1 if he buys the (branded) good from firm 1 at price p1, 12θA−p2 if he buys the (generic) good from firm 2 at price p2, and zero if he buys neither good.
In the final period of this model it is easy to check that a monopolist sets p1 = A2 and receives profit zA4 . The duopoly equilibrium prices are p∗1 = 27A and p∗2 = 141A. Duopoly profits are 498zAand 491 zA.
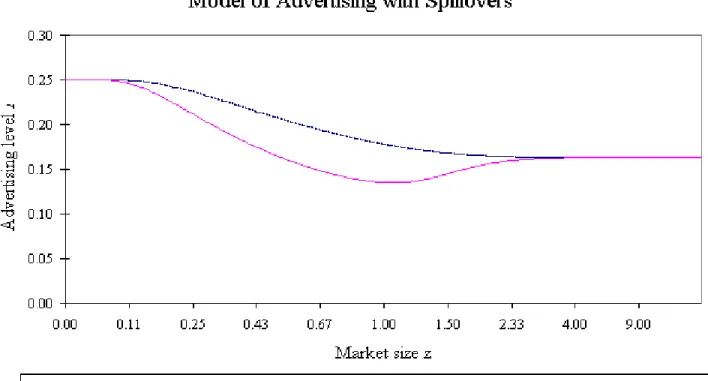
Figure 2 contains a graph of the equilibrium advertising levels in this model when the distribution F of entry costs is log normal with mean 0.0025 and variance 0.0015. In the model without entry deterrence motives,A declines smoothly from 14 atz= 0 to 498 in the limit as z → ∞.8 When there is also an entry deterrence motive, advertising levels are similar when z is small, but substantially lower in markets of small to intermediate size
8
Note that in order to show what happens aszgoes from zero to infinity we have rescaled the x-axis on the graph usingx=z/(z+ 1).
as firm 1 distorts its advertising downward to deter entry. In larger markets firm 1 begins to give up on entry deterrence, and the advertising levels in the strategic entry deterrence model approach the equilibrium values of the model without entry deterrence.
A notable feature of this example is that the relationship between advertising and market size is monotonic in the model without the entry deterrence incentive and nonmonotonic in the model with the entry deterrence incentive. In the section that follows we discuss the generality of this observation and the possibility of basing tests of strategic intent on it.
2.4 An aside on structural estimation
Few empirical papers have attempted to provide evidence on strategic entry deterrrence via structural methods. At first, one might think that this is surprising: in theory a structural test is as simple as testing which of the competing first-order conditions for A
best fits the data. In practice, however, such an approach can be very difficult. By the very nature of these models, entry deterrence can only occur when investments have long term consequences, which is a case when econometric estimates are more difficult. Also, to compute the terms in the first order conditions, one needs estimates of the incumbent’s prior on the likelihood of entry, and what the long run benefit of the investment would have been in the counterfactual state of the world in which entry did or did not occur. Each of these can also be a challenge to estimate.9
3
Some Results on Monotonicity and Entry Deterrence
Mo-tives
In the classic reduced-form approach to empirical industrial organization, one identifies where competing models make different predictions and then tests those differences. The null hypothesis for the test we have in mind is that investments are not influenced by the strategic entry deterrence motive. In this section we discuss conditions under which invest-ments that are not influenced by the strategic entry deterrence motive will be monotone in the market size. Under those conditions, if the data are nonmonotone, one can conclude
9
See Kadiyali (1996) for one structural estimation. Recent advances in the estimation of dynamic struc-tural models,e.g. Aguirregabiria and Mira (2007), Bajari, Benkard, and Levin (2006), and Berry, Ostrovsky, and Pakes (2005), should provide additional opportunities for work along these lines.
that investments are influenced by the strategic entry deterrence motive (or that auxilliary assumptions of our propositions are violated).
3.1 A basic monotonicity result: the direct and competition effects
Consider the model of investment without an entry deterrence motivation. Suppose that the profit and cost functions also depend on a characteristicz of the market. Our leading example will be the number of potential consumers in the market. Assume that the variable
z is ordered so that larger values of z correspond to markets that are more profitable for firm 2,i.e., ∂z∂π2d∗(A, z)>0.
In the nonstrategic investment model, investments will covary withz for two reasons.
Definition 1 The “direct effect” of z onA is F(π2∗)∂2π1d∗
∂z∂A + (1−F(π ∗ 2)) ∂2πm∗ 1 ∂z∂A − ∂2c ∂z∂A.
The direct effect is positive if increasingz raises the marginal benefit from the investment more than it raises the marginal cost of the investment (holding entry probabilities fixed). When the direct effect is positive, it gives the incumbent an incentive to invest more when
zis larger. A negative direct effect gives the opposite incentive.
Definition 2 The “competition effect” of z onA is ∂π1d∗
∂A −
∂πm∗ 1
∂A .
The competition effect is positive if the marginal benefit of the investment is larger when firm 1 is engaged in duopoly competition than it is when firm 1 is a monopolist. A larger value of z makes it more likely that firm 2 will enter. When the competition effect is positive, it provides an incentive for firm 1 to invest more whenz is larger.
The following simple proposition identifies a set of circumstances in which investment levels will be monotone inz.
Proposition 1 Let A∗N D(z)be the equilibrium investment level in the model of investment absent entry deterrence motivations described above. Suppose dπd2∗
dz > 0.
10 Then A∗
N D(z)
10Note that this does involve an additional assumption. We had earlier assumed just thatz was ordered
so that ∂πd ∗ 2 ∂z >0. Because dπd2∗ dz = ∂πd2∗ ∂z + ∂πd2∗ ∂A dA
dz, the added assumption can be thought of as a requirement
that the direct effect ofzon firm 2’s profits is greater than the indirect effect that comes from firm 1 changing its investment level in response to changing market conditions. While this assumption is often satisfied, it is stronger than is necessary. By expanding dπ
d∗
2
dz before solving for dA
is monotone increasing if the direct and competition effects are positive and A∗N D(z) is monotone decreasing if the direct and competition effects are negative.11
The proof of this proposition is given in the Appendix.
Remark 1: Proposition 1 is not a result that says that investment without an entry
deterrence motive is monotone in z provided some minor technical conclusions hold. We get monotonicityifthe direct and competition effects work in the same direction. In some applications, the two effects go in the same direction. In others they would not. One must think about whether an application is of the former or latter type before interpreting a violation of monotonicity as evidence that investments reflect strategic entry deterrence concerns.
Remark 2: When examining the relationship between investment levels and
mar-ket sizes, one has substantial latitude in defining the left- and right-hand-side variables. Monotone transformations of either variable (like taking the log ofA) will not affect whether a relationship is monotonic, but other choices one makes in defining variables clearly can. For example, a graph of total advertising expenditure vs. population could look very differ-ent from a graph of per capita advertising expenditure vs. population. Appropriate choices for variable definitions will reflect two concerns: the variables should be chosen so that one would expect the direct and competition effects to be of the same sign; and one should define them so that the direct effects are not so strong so as to make it implausible that strategic entry deterrence motives will be strong enough to lead to nonmonotonicities. For exam-ple, in many applications total advertising expenditures will be approximately proportional
instead add the assumption that ∂2c ∂A2 −F(π ∗ 2) ∂2πd1∗ ∂A2 −(1−F(π ∗ 2)) ∂2π1m∗ ∂A2 > f(π ∗ 2) ∂πd2∗ ∂A ∂π1d∗ ∂A − ∂π1m∗ ∂A .
This will always hold if the direction in which firm 1 changesAas competition becomes more likely reduces firm 2’s profits (so that the right hand side is negative). For example, this would be the case for an investment in a form of norivalrous advertising which raised consumer awareness of or valuation for all products in a product class. Otherwise, it will be necessary that the term on the right hand side not be too large, which will hold, for example, if the distribution of entry costs is sufficiently diffuse so that the density term is sufficiently small.
11
To make the propositions easier to read, we have written them using words like increasing and positive rather than nondecreasing and nonnegative. The results extend in all of the obvious ways,e.g. investment is monotone nondecreasing if the direct and competition effects are both nonnegative, and investment is monotone increasing if the direct and competition effects are both nonnegative and one is strictly positive.
to the market size and strategic entry deterrence motives would need to be tremendously strong to make total advertising expenditures decreasing in market size over any range. It is more plausible that there might be nonmonotonicities in per capita expenditures.
Remark 3: The proposition says nothing about what happens if the direct and
com-petition effects go in opposite directions. Investment absent entry deterrence motives can be nonmonotone in z in such applications, but there is no strong reason to think this will usually be the case, e.g. it is not true that one effect tends to dominate at small z and the other at large z. It would not be unreasonable to look for evidence of strategic entry deterrence by looking for nonmonotonicities even in the absence of a convincing argument that the direct and competition effects went in the same direction. One would, however, need to recognize that one could fashion an alternate expanation for the nonmonotonicity by having different nonstrategic effects dominate in different regions, and one would want to consider whether such an explanation is plausible.
One noteworthy special case in which the monotonicity argument is particularly simple is when z is the number of potential consumers in the market and the profit and cost functions are directly proportional toz. In this case we have the following corollary.
Corollary 1 In the model above, supposec(A, z) =zc(A,1)andπij∗(A, z) =zπij∗(A,1)for
i= 1,2 and j=d, m. Then, the direct effect is zero. Hence A∗N D(z) will be monotone in-creasing if the competition effect is always positive andA∗N D(z) will be monotone decreasing if the competition effect is always negative.
3.2 Examples of direct and competition effects
In this section we discuss the direct and competition effects in a few examples. The examples are related to our pharmaceutical application, and are also intended to help build intuition for the two effects.
We already saw one numerical example of a situation in which investment absent entry deterrence motives was monotone decreasing in the market size. Why the pattern of invest-ment is as it is in this example is straightforward: The profit and cost functions in example 1 satisfy the hypotheses of Corollary 1. The competition effect is negative because the
benefit of the advertising is greater for a monopolist than for a duopolist. (The duopolist gains less both because advertising has a smaller impact on consumers’ incremental prefer-ence for the incumbent’s product relative to the entrant’s and because the incumbent has a smaller market share in duopoly.)
Another useful example to think about is advertising that increases perceived differen-tiation between the incumbent’s product and the entrant’s. With proportional advertising costs we would again expect advertising levels in such models to be monotone. This time, however, we would expect advertising to be monotone increasing: differentiating advertis-ing is more valuable to a duopolist (which relies on differentiation to maintain markups) than to a monopolist. Here is formal version:
Example 2 Differentiating advertising.
Consider a mass z of potential consumers with unit demands differentiated by a taste parameter θ which is uniformly distributed on [−1,1]. Suppose that after firm 1 spends
zA2/2 on advertising, a consumer of type θ receives utility 1−p1 if he buys the good from firm 1 at price p1, 1 +θt(1 +A)−p2 if he buys from firm 2 at p2, and zero if he makes no purchase.
With this specification duopoly profits are proportional to 1 +A and monopoly profits are independent of A. Hence, the competition effect is positive. Again, there is no direct effect. Hence,A∗N D(z) will be monotone increasing.
In this example, we would get the same result with another reasonable specification for advertising costs.
Example 3 Differentiating advertising via broadcast media.
Suppose thatArepresented total advertising expenditure in a model where the advertising technology (perhaps like direct-to-consumer television advertising) is such that all potential consumers see any ad, i.e., wherec(A, z) =c(A,1)and πij∗(A, z) =zπji∗(A,1).
In this case the direct effect ofz on A is positive so the direct and competition effects of differentiating advertising would work in the same direction.
Another type of investment we will think about in the pharmaceutical application is investments in product proliferation.
Example 4 Product proliferation.
Let z be the mass of potential consumers and let A be a fixed expenditure on developing new versions of the product to be located at various points of a horizontal taste space a la Hotelling. Suppose that costs of developing these new varieties are independent of size of the consumer population,c(A, z) =c(A,1). Suppose also that second stage monopoly profits are only slightly increasing in A (because idiosyncratic taste variation is small relative to the value of the good), whereas duopoly profits are more steeply increasing in A (because product proliferation leads firm 2 upon entry to choose to compete directly with only a subset of firm 1’s products).
In this example,A∗N D(z) will again be monotone increasing. The direct effect is positive: the benefits of an investmentAare increasing inz whereas the costs are independent ofz. The competition effect is positive because the marginal value of the investment is greater for a duopolist.
4
Econometric issues
The theoretical results above illustrate a general idea: one could seek evidence that in-vestment levels reflect a strategic entry-deterrence motive by first arguing that inin-vestment levelsAshould be monotone is a market size measurezabsent entry-deterrence motives and then showing that they are actually nonmonotone. To develop this idea into one on which econometric tests can be based, the model obviously needs to be augmented to contain an error term that can can account for measurement error inA, unobserved heterogeneity across markets, etc. In this section, we review the existing literature on monotonicity tests, describe the specific tests we will carry out on our data, and discuss additional econometric issues relevant when one moves from the theory to applications.
4.1 Standard tests of monotonicity
Several recent papers have proposed tests of the hypothesis that data{Ai, zi}are generated
by a process
with A∗(z) being monotone increasing in z and the i being independent of zi. These
include Gijbels et al. (2000), Ghosal et al. (2000), and Hall and Heckman (2000). Hall and Heckman’s approach is simple and intuitive: if the trueA∗(z) is monotone increasing, then it is unlikely that there will be large ranges of z over which the relationship between
Ai and zi appears to be decreasing. This motivates forming a test statistic by looking at
how strong of a downward relationship one can find by considering all rangesR = [r1, r2] containing at least m datapoints. Specifically, they propose estimating a linear regression on the subset of the data withzi ∈Rfor each suchRand using the product of the regression
coefficient ˆβR and the sample standard deviation of the z’s in the range σRz as a measure of the strength of any decreasing relationship,i.e. they set
THH = max
|R∩{z1,...,zn}|≥m
−βˆRσZR.
They show that critical values can be obtained by a bootstrap with normal errors or by a nonparametic bootstrap provided thatm increases sufficiently quickly in n.
4.2 Our implementation
In this paper we will test for monotonicity in two ways: one uses a slight modification of Hall and Heckman’s test statistic; the other uses a new statistic we propose.
Our modification of Hall and Heckman’s test statistic is necessitated by the fact that we want the null hypothesis to be thatA∗(z) is monotone rather than monotone increasing. To this end, we set
THH = min{ max |R∩{z1,...,zn}|≥m −βˆRσZR, max |R∩{z1,...,zn}|≥m ˆ βRσZR}.
Intuitively, this will be large if there are both ranges over which the data are increasing and ranges over which the data are decreasing.
The second test statistic we try assesses how well the data can be fit by a monotone function. Specifically, we use isotone regression to determine the monotone function ˆf(z) that best fits the data, form the residuals ˆi ≡Ai−fˆ(zi), and use a test statistic like that in
Ellison and Ellison (2000) to test whether the residuals appear to come from a misspecified model: TEE = ˆ 0Wˆ √ 2ˆσ2P ijw2ij ,
whereW is a kernel weight matrix reflecting differences in thez’s and W = (W +W0)/2. Intuitively, if the trueA∗(z) is nonmonotone, then there will be regions whereA∗(z)>fˆ(z) and other regions whereA∗(z)<fˆ(z). This test looks for such regions by looking at whether the residuals from nearby observations are positively correlated.
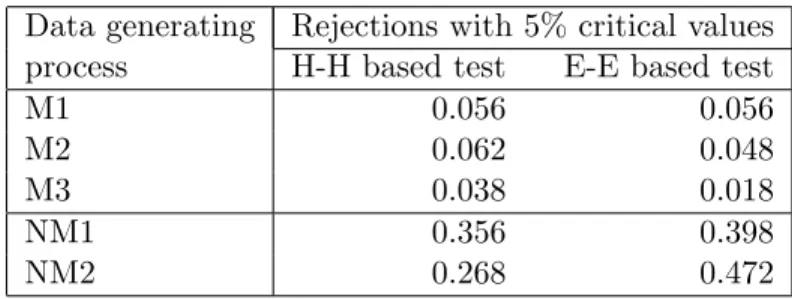
We obtained critical values for each of these tests via bootstrap methods. We have not tried to extend the existing results to obtain formal proofs that that this procedure is valid in our setting.12 We, therefore, conduct simulations to help assess the validity of the procedure and the power of the tests. We discuss these briefly in the appendix.13
4.3 Measurement error
A second issue that will come up in many applications is that one may have only an imperfect proxy for “market size”z. For example, in a dataset examining a cross-section of cities or countries, one would typically use population as a proxy for market size, which would not allow for taste differences across markets.14 We note here that this is often not a problem for our approach.
Suppose z is unobserved, but the data contain a proxy r correlated with z. Given a dataset containing observations {Ai, ri} satisfying Ai = A∗(zi) +i and appropriate
regularity conditions, one can estimate the function A(r) defined by A(r) ≡ E(A∗(z)|r). Whether looking for nonmonotonicity remains an appropriate way to look for evidence of strategic entry deterrence depends on whetherA(r) inherits the monotonicity ofA∗(z) under the null.
Obviously, we can only hope that A(r) will be monotone in r if the joint distribution of r and z is such that higher values of r are associated with higher values of z. It is a standard result in incentive theory that the appropriate meaning of association for many such problems is having the monotone likelihood ratio property (MLRP). The conditional
12
The theoretical results of Hall and Heckman (2000) cannot be applied directly for a couple reasons: we have modified the test statistic to make it two-sided, and in some of our applications theAvariable is discrete, which does not fit with their assumption that thei are i.i.d. The theoretical results in Ellison
and Ellison (2000) are inapplicable because it is assumed there that the function ˆf(z) is obtained via a parametric method, whereas the ˆf(z) in this paper is a nonparametric estimate.
13In unreported simulations we also examined the power of the Ghosalet al. (2000) and Gijbelset al.
(2000) tests. We chose to use the two statistics we use because they were quicker to compute and/or more powerful in these simulations.
density f(x|θ) of a random variable is said to have the MLRP in x if f(x|θ)/f(x|θ) is monotone increasing inx wheneverθ > θ. Under this assumption we have
Proposition 2 Suppose A∗(z) is monotone in z. Suppose distribution ofr conditional on
z has the MLRP in r. Then, A(r) is monotone in r. Proof
MLRP implies that the distribution of zconditional onr is increasing in the first order stochastic dominance sense. (See Milgrom (1981).) This implies that the expectation conditional on r of any increasing function ofz is increasing in r. A(r) is the expectation ofA∗(z).
QED.
In the classic measurement error model, ri = zi +i, the MLRP holds provided that
the density g of has g(−δ)/g() increasing in for any δ > 0. This property, called monotone likelihood ratio, holds for most standard distributions including the normal. We therefore think of Proposition 2 as indicating that measurement error is not a significant obstacle to our approach.15
4.4 Endogeneity
In some applications, one may also worry that the available proxies for market size are en-dogenous. For example, in our pharmaceutical application, our best proxy for the potential market for a drug is the total revenue that the incumbent monopolist has been receiving prior to patent expiration. This will be correlated with the number of potential consumers and their aggregate willingness to pay for the drug, but one would also expect that it would be influenced by the investments, e.g. revenue will be higher if the incumbent advertises more.
Endogeneity is a more serious concern than measurement error. However, because we are only interested in monotonicity (as opposed to obtaining consistent parameter estimates) endogeneity can be less of a problem for our approach than it would be for structural
15The textbook example of a situation in which the property fails is when the distribution of
iis extremely
bimodal. For example, ifzis standard normal andis always either -10 or 10, then observingr=−9 likely indicates thatz= 1, whereas observingr= 9 likely indicates thatz=−1.
estimation. One can easily envision two situations in which the use of an endogenous proxy without an instrument would not be a problem. First, if the endogeneity bias in estimating ∂A/∂z is of the same sign as ∂A/∂z, then investments will still be estimated to be monotone in the endogenous variable under the null. The power of our test may be reduced, but a rejection of monotonicity would still be evidence of strategic entry deterrence motives. Second, if the endogeneity bias is of the opposite sign as∂A/∂z but is sufficiently small, then the estimated investment function would also still be monotone under the null. Formally, consider again a cross-section dataset containing investment levels Ai and a
proxy ri for the market size. Suppose the data generating process is
Ai = A∗(zi) +i
ri = r(zi, Ai) +ηi,
wherezi,i, andηi are unobserved independent random variables and r(z, A) is a function
that is monotone increasing in both arguements. Again, the function one can hope to estimate from the data isA(r)≡E(A∗(z) +|r).
Define ˜r(z, ) ≡ r(z, A∗(z) +). One result showing that endogeneity need not be a problem is straightforward.
Proposition 3 Suppose A∗(z) is monotone increasing. Suppose the distribution of η has a monotone likelihood ratio, and that the distributions of˜r(z, ) conditional onz andboth have the MLRP inr˜. Then, A(r) is monotone increasing in r.
Proof
When η has a monotone likelihood ratio, the distribution of ˜r(z, ) is increasing in r
in the sense of first order stochastic dominance (FOSD). When the distributions of ˜r(z, ) conditioned on each argument both have the MLRP, this in turn implies that the distri-butions of z and are both increasing in r in the FOSD sense. When A∗(z) is monotone increasing, this implies that the distribution of A∗(z) + is increasing in r in the FOSD sense, which implies thatA(r) is increasing.
Proposition 3 has two primary limitations. The most important limitation for applied work is that it only covers the case in whichA∗(z) is monotone increasing, not to the case whenA∗(z) is monotone decreasing.
A second limitation is that we have assumed that ˜r(z, ) has the MLRP in both argu-ments. If r(z, A) is linear in its arguments, then one of these assumptions is simply that the distribution ofhas a monotone likelihood ratio. The other is that the distribution of
z+βA∗(z) has a monotone likelihood ratio. Even if z is normally distributed, one could find monotone functions A∗(z) for which z+βA∗(z) has a bimodal distribution (choose a function with two broad flat portions separated by a steeper portion). This seems less important as a practical concern.
IfA∗(z) is monotone decreasing the argument in the proof of Proposition 3 goes through until the very last step.16 It does not go all the way through because we end up with
E(A∗(z)|r) decreasing inr andE(|r) increasing inr, leaving the sumE(A∗(z) +|r) inde-terminate. In some applications withA∗(z) monotone decreasing it will still be appropriate to interpret a test of whetherA∗(r) is nonmonotonic as a test for strategic entry deterrence. This would be justified in applications for which theA∗(z) decreasing effect should outweigh theE(|r) increasing effect. The former effect will be stronger than the latter whenr(z, A) is more dependent onz thanA, when the variance of z is large relative to the variance in
, and when A∗(z) is more steeply downward sloping.
5
The Pharmaceutical Industry
In this section we provide some background on the U.S. pharmaceutical industry, discuss strategic instruments that firms might try to use to deter generic entry, describe our dataset, and note that the dataset has the type of heterogeneity in “market size” required for our approach.
16The assumption that ˜r(z, ) has the MLRP in both arguments may also be more difficult to justify. For
larger values of ˜rto be associated with larger values ofz we will needdr/dz˜ to be positive, which requires that the direct effectdr/dz is larger than the indirect effect through investment levelsdr/dA dA∗/dz.
5.1 Industry background
Prior to 1984 all but the most popular drugs tended to retain their monopoly position in the U.S. market long after their patent protection expired. FDA reguations required any firm wanting to produce a generic substitute to repeat the lengthy process of tests and clinical trials to which the incumbent had been subjected. Things changed dramatically in the mid-1980’s: the Waxman-Hatch Act (1984) reduced regulatory barriers to generic entry; and state laws mandating/allowing generic substitution by pharmacists boosted the market share of generic drugs.17
When a blockbuster drug like Prozac loses patent protection, generic entry is swift and sure—within 18 months Prozac faced 21 generic competitors and had lost more than 80% of its market. Most drugs, however, are not blockbusters. Many FDA-approved drugs never achieve much commercial success. Others have been largely supplanted by the time they lose protection. In this paper, we study a set of 63 drugs that lost patent or FDA exclusivity protection between 1986 and 1992.18 Whereas Prozac had annual revenues of about $3 billion prior to patent expiration, the median drug in our sample only had annual revenue of around $20 million. For such a drug, generic entry is much less certain: only thirty seven of the sixty three drugs in our sample faced generic competitors within three years of the expiration of their patents.
There are a number of “investments” that one could imagine pharmaceutical incum-bent distorting in order to deter entry. The most obvious is advertising, which plays an extremely important role in pharmaceutical markets—an oft-cited statistic by critics of the
17
See Grabowski and Vernon (1996).
18These drugs are a subset of those used in Scott Morton (2000). The sample is intended to be an
as-complete-as-possible list of the drugs that lost patent protection in this period, although we were con-servative in constructing the sample and only included drugs when we were sufficiently confident about the identification of the relevant patent and exclusivity restrictions. This can be difficult even though drug manufacturers are required by the FDA to report all relevant patents with expiration dates and the FDA publishes this information in theApproved Product List(“The Orange Book”). The reason is that which patents are truly relevant is not something the FDA can sort out, and it is clearly in the interests of the man-ufacturers to list patents even if their relevance is questionable. For the high revenue drugs, potential entry dates are often listed in trade publications and are, therefore, fairly easy to track down, absent court battles over expiration. Information is more difficult to come by for the smaller revenue drugs because potential entry into those drugs is usually not an important event. For those we relied more on FDA publications. Additional sources we used were lists of patent expiration dates published by the Generic Pharmaceutical Industry Association and Arthur D. Little, Caves, Whinston, and Hurwitz (1991), lists of ANDAs, and information on generics being produced in various issues ofDrug Facts and Comparisons.
pharmaceutical industry is that more money is spent by the industry on marketing than on research and development.19 In the period we study, there were two main advertising channels: “detail” and journal advertising.20 Detail advertising is the practice of having sales representatives visit doctors’ offices to inform them about studies assessing a drug’s effectiveness and otherwise promote the product in one-on-one conversations. Journal ad-vertising means placing advertisements in medical journals and other publications read by doctors. Expenditures on detail advertising are typically much larger than expenditures on journal advertising. An important aspect of both of these advertising technologies is that increases in demand they generate will in part be captured by generic competitors: doctors will know that generic versions of a drug can provide the same benefits; and pharmacists may dispense a generic even when the doctor has written a prescription for a brand name. A second potential instrument for strategic entry deterrence that has received much less attention is presentation proliferation. Many prescription drugs are sold in a large number of “presentations”. The tranquilizer Haldol, for example, is sold in 12, 1, 2, 5, 10 and 20 milligram tablets, as a concentrated liquid in bottles, and as a solution for intravenous use in vials, ampules and disposable syringes. Increasing the variety of presentations could be a strategy for deterring entry. It makes it more costly for an entrant to reproduce the incumbent’s complete product line, and reduces the revenues of an entrant that avoids the cost increase by only producing some presentations.
An additional instrument that firms might use to deter entry is pricing. The theoretical literature has identified a number of ways in which pricing decisions may affect subsequent entry: prices may signal something about the incumbent or the market to the entrant, they may be be distorted for signal jamming reasons, or there may be some more direct link between periods due to switching costs, learning by doing, etc.21 In the pharmaceutical 19See U.S. Congress, Office of Technology Assessment (1993). Bill Clinton, in a 1993 speech, said that
the pharmaceutical industry spends “$1 billion more each year on advertising and lobbying than it does on developing new and better drugs . . . . We cannot have profits at the expense of our children.” (The Wall Street Journal,February 16, 1993) Schweitzer (1997) provides a thorough discussion of research and marketing expenditures of pharmaceutical firms. See Caves, Whinston, and Hurwitz (1991), Hurwitz and Caves (1988), Leffler (1981), Berndt, Bui, Reiley, and Urban (1995) and Rizzo (1999) for discussions of other aspects of pharmaceutical advertising.
20
Direct-to-consumer advertising via mass media did not begin in earnest until the mid 1990’s. See Rosenthalet al. (2002) for a description of the practice and some documentation of its prevalence.
industry it is plausible that generic entrants have some uncertainty about the slope of the demand curve, and also plausible that prices may have some commitment value due to the scrutiny directed at price increases. Hence, several of the mechanisms by which prices could be a strategic investment seem potentially relevant.
5.2 Data
Our basic data set includes 63 distinct chemical compounds that faced potential generic entry as the result of a patent or FDA exclusivity expiration between 1986 and 1992.22
We collected the data on revenues, prices, and advertising from historical IMS audits of the pharmaceutical industry. Like all IMS sales data, the prices and revenues are those paid by the retail or hospital sector, in other words, essentially at the wholesale level. Our revenue data contain annual presentation-level wholesale revenues for all presentations of each drug in both the hospital and drugstore submarkets for five years: three years prior to patent expiration, the year of patent expiration and the year following patent expiration. We construct two variables from this data which we use to help measure the attractiveness of the market to potential entrants: Revenue3 is the average annual revenue (in thousands of dollars) from hospital and drugstore sales in the three calendar years before but not including the year of patent expiration; and HospF racis the fraction of total revenues in the calendar year prior to patent expiration which were due to hospital sales. All prices and revenues are in constant 1982-1984 dollars.
Our advertising data on each drug consist of two variables, Detail and J ournal. The former is the number of minutes that pharmaceutical company “detailers” spent promoting the drug in direct conversations with physicians. The latter is an estimate of dollars spent on journal advertisements promoting the drug based on audits of medical journals. The advertising data is at a monthly frequency and includes 48 observations per drug covering the thirty six months prior to patent expiration, the month of patent expiration and the eleven subsequent months.
1986), Harrington (1986), and Klemperer (1987).
22
Our data set contains 71 drugs, where a drug is defined as a brand-name product sold by the patent-holder or licensee prior to expiration. Seven of our chemical compounds were sold under multiple brand-names, accounting for the discrepency.
Our primary measure of the degree to which an incumbent has engaged in presentation proliferation, P resHerf, is a Herfindahl-style measure that is also constructed from the presentation-level revenue data. Specifically, we define P resHerfit = wiPkzidkt2 + (1−
wi)Pkzihkt2 , where wi is the fraction of the sales of drug iwhich are made through
drug-stores and zidkt and zihkt are the fractions of drug i’s revenues in year t in the drugstore
and hospital markets, respectively, which are accounted for by presentationk.23 P resHerf
will be large in markets where a small number of presentations account for most of the rev-enues and smaller in markets where sales are more evenly divided among a larger number of presentations.
Because of the different presentations, a drug’s price is difficult to define. (Prices for different presentations are clearly not set to equalize the total cost of a duration of treatment or in proportion to the quantity of the active ingredient.) In our study of pricing patterns, we look at changes in the drugstore and hospital prices of each drug using variables,HP rice
and DP rice, which give the price of one particular presentation of each drug in the five year window around the year of patent expiration.24
We obtained information on drug characteristics and whether generic entry did in fact occur from several other sources.25 The primary variable we will use to study entry,
Entry3Y r, is a dummy variable equal to one if at least one firm had an Abbreviated New Drug Application (ANDA) approved (allowing it to produce a generic version of the drug) within three years of the date at which a patent expires.26 Chronicis set to zero for drugs 23Defining presentations by differences at the wholesale level will in some cases be a poor reflection of how
proliferation affects the costs of entry. For example, 100mg tablets sold to pharmacies in a 100 tablet bottle will be treated as different from 100mg tablets sold in bubble packs and as different from 100mg tablets sold to pharmacies in a 500 tablet bottle. The descriptors in our data at times do not make it clear how similar/different wholesale presentations are, but it did not appear that problems like those described above are very important in the aggregate.We would also have preferred to sum the presentation-by-presentation revenues across hospitals and drugstores before computing the sum of squares, but given the form of our data, this would have entailed a laborious manual matching. Given that 70 percent of the drugs have at least 90 percent of their sales in one submarket or the other, we felt that just taking weighted averages was a reasonable compromise.
24
We usually chose the presentation that had the highest revenue in the first year of our data.
25These includeDrug Facts and Comparisons, Physician’s Desk Reference, the FDA’s Approved Drug
Products with Therapeutic Equivalence Evaluations, and discussions with physicians.
26
Caves, Whinston and Hurwicz (1991) and Scott Morton (1999) note that entry in pharmaceutical markets often does not occur immediately upon patent expiration, and that only part of the delay in attributable to uncertainties in the length of time necessary for ANDA approval.
which treat an acute condition and to one for drugs which treat a chronic condition.27
P sych is an indicator for whether the drug primarily treats a psychological condition.
T opical is an indicator for whether the drug is usually applied topically. T herSubsis the number of other chemical compounds in a drug’s therapeutic class, where we used therapeu-tic categories defined byDrug Facts and Comparisons. Specialistis a proxy for the extent to which the drug tends to be prescribed by specialists. It is obtained by computing the GINI coefficient for each therapeutic class of drugs from a table of frequency of prescription by various specialties. Cardiovascular drugs, for instance, have a GINI coefficient of 0.18 whereas ophthalmic drugs have a value of 0.35, indicating that prescriptions for cardiovas-culars are more spread out across specialties than are prescriptions for ophthalmics. (Those two categories represent the minimum and maximum values.) Each drug is categorized in therapeutic class and assigned the GINI coefficient for its therapeutic class as its value of
Specialist.
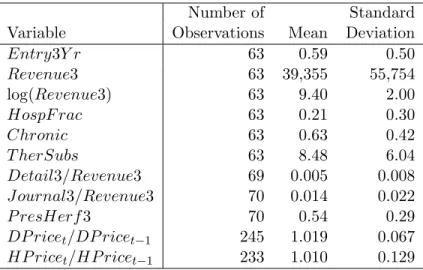
Summary statistics are presented in Table 3. The first five variables in the table are defined at the drug level. The mean of the Entry3Y r variable reflects that 37 of the 63 drugs experienced generic entry in the three year window. The mean of the Revenue3 variable indicates that the average drug had annual revenues of $39.4 million.
Detail3 and J ournal3 are average annual values of the advertising variables over the same three-year pre-expiration period for which Revenue3 was computed. The values for the mean advertising ratios in Table 3 indicate that 1.4% of sales were spent on journal advertising and approximately 5% on detail advertising.28 P resHerf3 is an average of the
P resHerf variable over the same three year period.29 Although the average number of presentations per drug is greater than six, the mean value of 0.54 indicates that one or two presentations usually account for a large portion of revenues.30 TheDetail3,J ournal3, and
P resHerf3 variables have 69 or 70 observations rather than 63 because we have defined 27The variable is set to one-half for a few drugs which were judged to be intermediate on this dimension. 28
Our detailing data are in minutes. This calculation assumes a cost of $10 a minute.
29For seven of the drugs we are missing data for one of the three years. In these cases, the average was
taken over the two years for which data was available.
30
Recall that the scale of a Herfindahl index is such that the index would be equal to 1/nif a drug is sold innpresentations and each receives equal revenues. Ten of our drugs are sold in a single presentation and hence haveP resHerf3 equal to one. The mean ofP resHerf3 for the remaining drugs is still 0.46.
them at the level of the brand-name rather than at the level of the drug.31
The DP ricetand HP ricet variables are yearly observations of the price of one
presen-tation of each drug deflated by the Consumer Price Index. The summary statistics indicate that the average price increases in the drugstore and hospital markets are 1% and 1.9% above the rate of inflation.
The data on theHospF racvariable reflect that drugstore revenues are usually substan-tially larger than hospital revenues.
5.3 Revenue as a proxy for market size
Our approach to studying stategic investment requires that we have a proxy for “market size”. and that there be sufficient heterogeneity in this variable. In this section, we note that pre-expiration revenues should be a good market-size proxy.
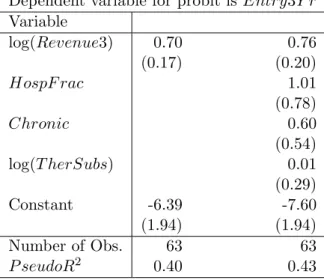
Previous work by Grabowski and Vernon (1992), Bae (1987), and Scott Morton (2000) has established that pre-expiration revenues are a significant predictor of generic entry. This should not be surprising: there is tremendous variation in revenues across drugs and no obvious reason why the fixed costs of developing drugs should be comparably heterogeneous and correlated. The first column of Table 5 reports estimates from a probit regression of
Entry3Y r on Revenue3 to verify that such a relationship exists in our data as well. The second column adds several other covariates to the regression. None exceptRevenue3 have a statistically significant effect on the likelihood of generic entry.32
One can only expect to be able to find a nonmonotonic investment pattern in the cross-section due to strategic investment if the heterogeneity in market sizes is sufficiently large so that a dataset contains markets where the likelihood of entry is small, intermediate, and 31Hence, the seven drugs that are sold under multiple brand names contribute multiple observations to
these regressions. The small number of missing observations are due to cases where we judged the data to be unreliable. Drugs for which no detail or journal advertising was performed are included and coded as zeros.
32The point estimates are that drugs treating chronic conditions and drugs sold mostly through hospitals
were more likely to face generic entry, although neither estimate is significant even at the 10% level. We would also find such estimates a bit surprising as they do not conform with intuitive findings in the previous literature about where markups are greatest: Sorensen’s (2000) study of dispersion in retail drug prices in New York State indicates that drugs treating acute conditions have higher retail markups (and less dispersion), and Ellison and Snyder (2001) and others report that hospitals pay lower wholesale prices for antibiotics than do drugstores. Scott Morton (2000) does report that entry is significantly more likely for drugs treating chronic conditions and for drugs where the hospital share of sales is larger in her analysis of a larger dataset which overlaps substantially with ours.
large. To give some feel for the degree of heterogeneity in our data, we divide our sample into five revenue-based subsamples. Table 4 reports the range of revenues in each group and the fraction of drugs in each group that experienced entry within three years of patent expiration.33 The main observation to be taken away from this table is that one can think of the lowest quintile, Q1, as containing drugs that face a low probability of generic entry, those in the next quintile, Q2, as having an intermediate probability of generic entry, and those in the top three quintiles, Q3, Q4 and Q5, as having a high probability of generic entry. The strategic entry-deterrence motive will vary continuously with revenues (and other unobservables), but one can roughly regard it as being most salient for drugs in the second-lowest revenue quintile.
6
Evidence on Strategic Investment in Pharmaceuticals
In this section we examine our data on detail advertising, journal advertising, presentation proliferation, and pricing for evidence that the incumbents’ actions reflect a strategic entry deterrence motive. We will do this in two ways. First, in the most straightforward appli-cation of the framework developed in this paper we look for evidence of nonmonotonicity in the cross-section. Second, we conduct a similar analysis using behavior in the early part of our data (when entry deterrence was less salient) as an additional control variable.
6.1 Cross-sectional patterns in incumbent behavior
In our theory section we presented conditions under which investment would be monotone in market size if firms are not influenced by an entry-deterrence motive, and noted that a strong entry-deterrence motive might be expected to produce a nonmonotone pattern. We now discuss the potentially strategic actions one by one. In each case, we discuss what might be expected absent entry deterrence motives, how behavior would be distorted to deter entry, and what patterns are observed in our dataset. We find some evidence in favor of the entry-deterrence hypothesis in the journal advertising data.
33
Note that the five “quintiles” in this table contain uneven numbers of drugs. Recall that we are sometimes treating our sample as 63 drugs and sometimes as 69 brand names/drug combinations. We do the latter more frequently, and hence chose to define the quintiles to have the same number of brand names in each. Note that the quintiles are only being used to provide a feel for the data and our nonparametric monotonicity tests do not involve any arbitrary cutoffs.
6.1.1 Detail advertising
Detail advertising is extremely important in the development of the market for a prescrip-tion drug. Our cross-secprescrip-tional analysis will examine advertising-to-sales ratios.34 What patterns might be indicative of strategic entry deterrence? Absent entry-deterrence mo-tives we would expect to see these ratios decline slightly with market size. The “compe-tition effect” is that there are reduced long-run benefits to advertising high-revenue drugs approaching patent expiration (because a substantial share of future prescriptions will in-stead go to generics). There is little “direct effect” because the fact that detailing efforts are focused on doctors who write a substantial number of prescriptions for a condition means that they are not particularly less productive for drugs that treat less common conditions. In a strategic-entry-deterrence model the strategic effect is that an incumbent might reduce detail advertising levels in intermediate sized markets. This reduction in advertising would reduce the attractiveness of the market to potential entrants, and entry could thereby be deterred.
For a first look at how the detailing-to-sales ratio varies with revenues, we estimate the regression
Detail3i
Revenue3i
=β0+β1log(Revenue3i) +β2(log(Revenue3i)−R)2+β3Specialisti+i,
where R is the mean of log(Revenue3). We include Specialisti because detailing is more
cost-effective for drugs prescribed by specialists than for drugs prescribed by nonspecialists (each of whom will only have a small number of patients who could benefit from the drug). Coefficient estimates are reported in the first column of Table 6. The regression does not provide any evidence for a nonmonotonic pattern. Indeed, it provides little evidence of any patterns at all. The R2 of the regression is low. The coefficient estimates on the revenue variables and the coefficient estimate on theSpecialistvariable are all statistically insignificant.
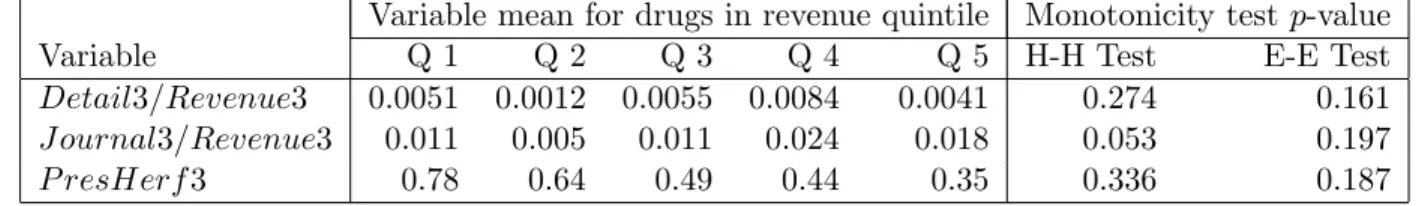
Table 7 presents additional descriptive evidence and formal tests for nonmonotonicity. The first five columns of the first row of the table give the mean values ofDetail3/Revenue3 34For drugs sold under multiple brand names our advertising data is at the level of the brand rather than
within each of the revenue quintiles. The most noteworthy value is the low value for the second quintile, which, as noted earlier, can be thought of as drugs facing an intermediate probability of generic entry. To provide formal tests of nonmonotonicity we carried out the tests described in section 4.2. We used a parameter for the Hall-Heckman test corresponding to subregressions of fifteen observations. We set the smoothing parameter for the Ellison-Ellison style test to be equal to one-fifth of the support of the regressor. The sixth and seventh columns of the Table report estimated p-values for these two tests, neither of which rejects monotonicity at standard levels of significance. Apparently, the level of noise is sufficiently high and/or the pattern is sufficiently sensitive to the cutoffs so that the nonmonotonic pattern in the quintile means is not significant in our nonparametric tests.
6.1.2 Journal advertising
The second potential instrument for strategic entry deterrence available to us is journal advertising. What patterns might be expected here with and without strategic entry de-terrence?
The direct effect should tend to make advertising-to-sales ratios increasing in revenues: many medical journals reach a fairly wide audience, so the cost per potential patient of journal advertising is probably decreasing in the size of the pool of potential patients. The competition effect should go in the other direction for the same reason as it did with detail advertising. The fact that the two effects go in opposit