Determinants for using visible reserves
in German banks – an empirical study
Sven Bornemann
(University of Münster)Susanne Homölle
(University of Rostock)Carsten Hubensack
(University of Münster)Thomas Kick
(Deutsche Bundesbank)Andreas Pfingsten
(University of Münster)Discussion Paper
Series 2: Banking and Financial Studies
No 11/2009
Editorial Board: Heinz Herrmann
Thilo Liebig
Karl-Heinz Tödter
Deutsche Bundesbank, Wilhelm-Epstein-Strasse 14, 60431 Frankfurt am Main, Postfach 10 06 02, 60006 Frankfurt am Main
Tel +49 69 9566-0
Telex within Germany 41227, telex from abroad 414431
Please address all orders in writing to: Deutsche Bundesbank,
Press and Public Relations Division, at the above address or via fax +49 69 9566-3077
Internet http://www.bundesbank.de
Reproduction permitted only if source is stated.
ISBN 978-3–86558–562–2 (Printversion) ISBN 978-3–86558–563–9 (Internetversion)
Determinants for Using Visible Reserves in German Banks –
An Empirical Study
∗Sven Bornemann†
University of M¨unster
Susanne Hom¨olle‡
University of Rostock Carsten Hubensack†† University of M¨unster Thomas Kick‡‡ Deutsche Bundesbank Andreas Pfingsten†† University of M¨unster
∗ We are deeply indebted to the participants of the M¨unster Banking Research Workshop 2008, the Rostock
Conference on Service Research 2008, the 15th Annual Meeting of the German Finance Association (DGF) 2008, the EIASM Workshop on Accounting and Economics 2008, the 12th Conference of the Swiss Society for Financial Markets Research 2009, the Bundesbank Seminar on Banking and Finance, and those of the 32nd EAA Annual Congress 2009 for providing valuable comments that have led to a considerable improvement of a previous version of this paper. Not having incorporated all suggestions in the present work is our own responsibility, as are remaining errors and omissions. The paper represents the authors’ personal opinions and not necessarily those of the Deutsche Bundesbank.
† Corresponding author, Finance Center M¨unster, University of M¨unster, Universit¨atsstr. 14-16, 48143 M¨unster,
Germany, phone +492518329948, fax +492518322882, [email protected].
‡ Chair of Banking and Finance, University of Rostock, Ulmenstrasse 69, 18057 Rostock, Germany. †† Finance Center M¨unster, University of M¨unster, Universit¨atsstr. 14-16, 48143 M¨unster, Germany.
The German Commercial Code (’HGB’) allows banks to build visible reserves for general banking risks according to section 340g HGB. These ’GBR reserves’ may, in addition to their risk provisioning function, be used to enhance capital endowment, for internal financing, signaling or earnings management purposes. We analyze fi-nancial statements of German banks for the period from 1995 through 2007 to reveal specific patterns in the use of GBR reserves. Our empirical investigation is based on a large, unbalanced panel of German banks including 32,023 bank-year observations. We see an increase in the use of GBR reserves over time. Furthermore, we can say that GBR reserves are primarily used by large banks, banks with comparatively low regulatory capital endowment, as well as those with lower risks. Furthermore, GBR reserves are used by fairly profitable banks, those reporting according to interna-tional financial reporting standards in addition to HGB, and banks which are not thrifts or cooperative banks. Finally, we find that banks which make use of hidden reserves according to section 340f HGB also tend to hold GBR reserves. We explain our findings with regulatory factors and existing information asymmetries as well as banks’ size and ownership structure.
Key Words:Bank regulation, informational asymmetries, risk provisioning, visible reserves, hidden reserves.
JEL Classification: G21, G32, M41.
Non- echnical ummary
Section 340g of the German Commercial Code (’HGB’) allows banks to build visi-ble reserves for general banking risks (henceforth: GBR reserves). Obviously, these visible reserves are meant to take account of any kind of general risks banks may be exposed to. They have to be disclosed as a separate item on the liability side of the balance sheet and their allocation is clearly visible from the profit and loss account. They are acknowledged as tier 1 capital and the decision to set them aside is taken by the bank’s management. In addition to their risk provisioning function, these visible reserves may also be used to enhance capital endowment, for internal financing and for signaling purposes.
We analyze the financial statements of German banks for the period from 1995 through 2007 to reveal specific patterns in the use of GBR reserves. We explain our findings with regulatory aspects and existing information asymmetries as well as the size and the ownership structure of banks. Our results are as follows:
• Larger banks are more likely to use visible GBR reserves, and they also hold
a higher percentage of these reserves relative to their total assets. The same holds for banks with low regulatory capital endowment and for banks which are already using hidden reserves according to section 340f HGB.
• Banks subject to public law make use of GBR reserves less often and to a
smaller extent. The same relationship is found for banks with higher risks in their loan portfolios, i.e. for banks with relatively high non-performing loan ratios.
• Banks with a higher return on assets and banks under IFRS tend to build GBR
reserves more often and to a greater extent.
• Both the share of banks making use of GBR reserves and the ratio of these
reserves to total assets increase over time. This almost monotonic trend is con-firmed even when controlling for all other relevant factors in panel regressions.
Nichttechnische Zusammenfassung
Das deutsche Handelsgesetzbuch (HGB) erlaubt Kreditinstituten die Bildung eines
Fonds f¨ur allgemeine Bankrisiken nach§340g. Sowohl die Bildung als auch die H¨ohe
dieser Reserven m¨ussen in der Gewinn- und Verlustrechnung bzw. in der Bilanz eines
Instituts klar ausgewiesen werden. Sie werden als Kernkapital anerkannt und die
Entscheidung ¨uber ihre Bildung wird vom Bankmanagement getroffen. Zus¨atzlich
zur Risikoabsicherung k¨onnen diese Reserven auch zur Erh¨ohung der
Kapitalaus-stattung, zur internen Finanzierung und zu Signalisierungszwecken genutzt werden. Wir untersuchen Bilanzdaten deutscher Banken im Zeitraum 1995 bis 2007, wobei
wir spezifische Verhaltensmuster in der Nutzung des Fonds f¨ur allgemeine Bankrisiken
aufzeigen. Wir erkl¨aren unsere Erkenntnisse mit regulatorischen Gegebenheiten,
existierenden Informationsasymmetrien, sowie durch die Gr¨oße und die Eigent¨
umer-struktur von Banken. Unsere Ergebnisse sind wie folgt:
• Gr¨oßere Banken weisen eine h¨ohere Wahrscheinlichkeit zur Bildung von
340g-Reserven und auch einen h¨oheren Anteil dieser Reserven an der Bilanzsumme
auf. Gleiches gilt f¨ur Banken mit einer niedrigen regulatorischen
Eigenkapital-ausstattung und Institute, die bereits stille 340f-Reserven nutzen.
• Offentlich-rechtliche Banken nutzen 340g-Reserven weniger h¨¨ aufig und in
gerin-gerem Maße als andere Institute. Gleiches gilt f¨ur Banken mit hohen Risiken
im Kreditportfolio, d. h. f¨ur Banken mit einem relativ hohen Anteil an
notlei-denden Krediten.
• Banken mit einem h¨oheren ROA (operatives Ergebnis als Anteil an der
Bi-lanzsumme) bilden 340g-Reserven mit einer h¨oheren Wahrscheinlichkeit und
in einem h¨oheren Maße. Gleiches gilt f¨ur Institute, die zus¨atzlich nach IFRS
bilanzieren.
• Es kann gezeigt werden, dass sowohl die Wahrscheinlichkeit zur Bildung von
340g-Reserven als auch deren Anteil an der Bilanzsumme im Zeitablauf ansteigen.
Diese Aussage gilt auch dann, wenn in Regressionsanalysen f¨ur s¨amtliche
Contents
1 Introduction 1
2 Related Literature 3
3 Legal Framework 5
4 Theoretical Background 7
4.1 Motives for (Not) Using GBR Reserves . . . 7
4.2 Hypotheses . . . 12
5 Empirical Analysis 15 5.1 Data and Variables . . . 15
5.2 Results . . . 19
5.2.1 Descriptive Statistics . . . 19
5.2.2 Regression Models . . . 22
List of Tables
1 Evaluation of GBR reserves and the alternatives. . . 12
2 Coverage by bank groups for selected years (in %). . . 16
3 Number of observations in the panel by bank categories over time. . . 16
4 Number of banks and mean of observations in the panel by category. 18 5 Pairwise correlations. . . 18
6 Number of activities involving GBR reserves over time. . . 21
7 Results of pooled regression models. . . 24
8 Coefficients of random effects models. . . 27
List of Figures
1 Share of banks using GBR reserves per bank category over time. . . . 201
Introduction
Banks are considered to be fairly opaque and intransparent institutions compared
to many other industries.1 Insight into and understanding of the banking business is
not widespread among the public. Existing bank-specific accounting rules certainly do much to add to this image. These special norms and the consequent lack of trans-parency in banks’ financial reporting are justified by the particular kinds and levels of risk banks are exposed to. Confidence in and the stability of the banking sector are deemed to be vital for the well-being of the world’s economies. This becomes even more evident when looking at the turmoil caused by the recent financial crisis. To achieve financial stability and to foster confidence, on the one hand, regulatory bodies impose certain restrictions on the amount of risky assets held by banks in
relation to their capital resources.2 On the other hand, legal bodies generally allow
the building of reserves and loss provisions within banks’ financial statements. The German Commercial Code (’HGB’) in particular contains two unique but very different instruments permitting banks to build reserves. Firstly, section 340f HGB allows specified financial assets to be deliberately undervalued within certain
lim-its. This is often referred to as creating hidden reserves (for simplicity called ’340f
reserves’ hereinafter). Secondly, a bank may increase its visible reserves, so called ’Reserves for General Banking Risks’ in accordance with section 340g HGB (for sim-plicity called ’GBR reserves’ hereinafter). These two types of reserves differ greatly with respect to their visibility on the balance sheet. Thus, banks may use them for very different reasons. Whereas the creation of hidden reserves has a very long tradition for German banks, GBR reserves, which are the main focus of this paper, were not introduced into German law until 1993.
340f reserves certainly contribute to the perceived opaqueness of banks, as they
un-dermine the pre- and post-decision information functions of accounting regulations.3
To some extent, this also holds for GBR reserves. They are visible, but to external observers it is not obvious whether they represent existing risks or whether they were just built as part of the bank’s earnings management or as a signaling device. Furthermore, they may also have been built to enhance capital endowment and for internal financing purposes. However, these aims can also partly be achieved by other means, for instance (hidden) 340f reserves, retaining earnings, or by raising new equity.
1 Cf. Morgan (2002), Flannery et al. (2004), or Ianotta (2006), for example.
2 In this context we refer to the rules of BCBS (2006) (henceforthBasel II) which, for instance, have been
transformed into German law via theGerman Solvency Regulationsince 2007/01/01.
It is especially interesting to examine the use of GBR reserves, since they were not introduced into German banking legislation voluntarily. Rather, the legislator was forced to do so during adoption of the EC Bank Accounts Directive in 1986, since Germany continued to allow the creation of hidden reserves according to section 340f HGB. We are therefore mainly addressing two research questions in this paper. Firstly, we examine what factors determine the probability of a bank making use of GBR reserves. For this analysis, the level of GBR reserves is therefore irrelevant as long as it exceeds zero. In a second step, we identify key factors that account for the amount of GBR reserves that have been built. To this end, we analyze the evolution of the precise level of this balance sheet item at bank level over time, controlling for the influence of variables such as the category a bank belongs to, its size and other characteristics such as regulatory capital endowment and the level of risk a bank is exposed to. Regulatory constraints as well as concepts focusing on informational asymmetries (such as the Pecking Order Theory) help to provide explanations for our findings and enable us to identify key factors responsible for the use of GBR reserves.
Our empirical analysis is based on a large, unbalanced panel of 4,916 German banks derived from the Deutsche Bundesbank’s BAKIS database. It covers the period from 1995 through 2007, yielding a considerable number of bank-year observations (32,023). Our findings are clearly consistent with the predictions implied by informa-tion asymmetry outlined above. We see an increase in the use of GBR reserves over time. Furthermore, we can say that GBR reserves are primarily used by large banks, banks with comparatively low regulatory capital endowment, as well as those with lower risks. Furthermore, GBR reserves are used by fairly profitable banks, those reporting according to international financial reporting standards in addition to HGB, and banks which are neither thrifts nor cooperative banks. Finally, we find that banks that make use of hidden reserves according to section 340f HGB also tend to hold GBR reserves.
The remainder of this paper is organized as follows: In Section 2 we review related literature. Section 3 introduces the legal framework, whereas Section 4 presents motives for (not) using GBR reserves. Moreover, the informational perspective on the use of those reserves is evaluated and some practical issues surrounding the decision-making process for building GBR reserves are discussed. Section 5 presents the data set and the results of our empirical analysis. Finally, Section 6 provides some concluding remarks.
2
Related Literature
To the best of our knowledge, no empirical analysis of GBR reserves has been con-ducted from the perspective of the economics of information. However, risk provi-sioning in general as well as bank loan-loss accounting in particular have been widely discussed in the past.
Despite major differences between GBR reserves and loan-loss accruals (namely the fact that GBR reserves are, unlike loan-loss accruals, not associated with credit risk), literature on loan-loss provisioning is still most closely related to our analysis. At an international level, several papers examine loan-loss provisioning empirically. Madura/McDaniel (1989) as well as Grammatikos/Saunders (1990) analyze the ef-fects of the announcement by Citicorp and other U.S. money-center banks that they would increase loan-loss reserves for third world loans on the stock prices of those banks. They find heterogeneous evidence among the banks. Docking et al. (1997) study differences in the contagion effects of bank loan-loss reserve announcements between money-center and regional banks in the USA for the period from 1985 to 1990. Surprisingly, they find negative announcement effects as well as contagion ef-fects between regional banks. Ahmed et al. (1999) find strong support for loan-loss provisions being used for capital management only. Wall/Koch (2000) review theo-retical and empirical evidence on bank loan-loss accounting. To do so, they take very different perspectives on bank regulation and capital management. Laeven/Majnoni (2003) fathom the relationship between loan-loss provisioning and overall economic slowdowns. Recently, Anandarajan et al. (2007) found that Australian banks use loan-loss provisions for capital management.
Another important strand of literature mainly focuses on earnings management
and its ties to bank loan-loss provisioning. Scheiner (1981) uses data from 107 U.S. banks for the period from 1969 through 1976 but does not detect a correlation be-tween provision allowances and proxies for a bank’s good or bad years. By contrast, Greenawalt/Sinkey (1988) find significant evidence for earnings management among U.S. banks. More recently, Bhat (1996), by analyzing a panel of U.S. banks from 1981 through 1991, finds that low-growth banks with a high loans to deposits ratio and high leverage are more likely to carry out income smoothing. Lobo/Yang (2001) analyze bank managers’ decisions on discretionary loan-loss provisions to smooth in-come and to manage capital requirements. Shrieves/Dahl (2003) take a closer look at the use of loan-loss provisions by Japanese banks during a period of financial duress and find evidence for earnings and regulatory capital management. Subse-quently, Kanagaretnam et al. (2004) find bank managers using loan-loss provisions as a means of communicating private information about the bank’s future prospects. Furthermore, they find this propensity to be greater if a bank is performing badly
and if it is undervalued. Last but not least, Fonseca/Gonz´alez (2008) examine loan-loss provisions as a tool for income smoothing in a cross-country study and find the extent of income smoothing to be lower in countries with effective supervision. Since sections 340f and 340g HGB are specific German rules, most of the existing pa-pers that deal with these sections merely discuss institutional and legal issues related
to the German banking market and the underlying accounting system. Shortly
after their integration into German banking legislation in 1993, Waschbusch (1994) illustrated the main features of visible reserves. He argues that particularly inter-nationally operating German banks will increasingly use GBR reserves to improve their standing. Following up, Emmerich/Reus (1995) are the first to discuss visible and hidden reserves from a mainly informational perspective, while also showing accounting implications for banks’ management in Germany.
Looking at the German banking market, so far only Wagener et al. (1995) have taken an empirical perspective, but that is limited to the year 1993. They study 125 financial statements and 35 group financial statements. However, they do not focus on the use of risk provisions but rather analyze all positions on the banks’ balance sheets and profit and loss accounts. With respect to GBR reserves, their focus is on describing how many banks already held such reserves in the year they were first implemented (1993). They do not try to explain their findings using informational aspects as we shall do in the following.
Our paper contributes to the literature in several ways. Firstly, we analyze the financial statements of a panel of 4,739 German banks, the largest sample examined so far. The analysis covers the period from 1995 through 2007, yielding a considerable time series of up to 13 accounting years for each bank. Most importantly, by relating our empirical results to accounting and regulatory properties as well as informational aspects of GBR reserves, we are able to test a number of hypotheses which shed light on some serious agency issues.
3
Legal Framework
The item on the liability side of banks’ balance sheets called ’Reserves for General Banking Risks’ is a direct consequence of the EC Bank Accounts Directive of 1986, introduced into German law by section 340g HGB in 1993. According to Art. 38 of this directive, members of the EC that continued to allow their banks to build hidden reserves (e.g. Germany through section 340f HGB) had to enable disclosure
of GBR reserves as well.4 The aim was to create a counterweight to the permission
to create hidden reserves and thus to increase pressure on banks to turn away from
a policy of minimum disclosure.5
The creation of hidden reserves has a long tradition in Germany. Though this type of reserves is not the main focus of our paper, an awareness of the major differences as compared to GBR reserves is important for understanding the central arguments set out in the rest of the paper. 340f reserves are formed by deliberately undervaluing loans and certain securities designated the so-called ‘liquidity reserve’ according to HGB. 340f reserves are referred to as hidden because their use is not apparent from the balance sheet or income statement. The decision to undervalue these assets is in the hands of the bank’s management alone. However, 340f reserves are limited to 4% of the overall value of the relevant financial assets before the undervaluation takes place. They have to be eliminated when filing the tax statement, hence they do not influence the bank’s tax payments.
Under the leading international financial accounting regimes IAS/IFRS and
US-GAAP6, there is no corresponding rule, i.e. hidden reserves cannot be created in
the same way. However, IAS 30.50 - which was still effective until the end of 2006 – allowed the disclosure of reserves for general banking risks.
The funding and release of GBR reserves have to be shown in separate items of banks’ income statements. Their variation within one year is visible from the balance sheets
and the amount built during a year is shown in the income statement.7 According to
section 340g HGB, the amount of reserves must be ’reasonable’. It is not restricted to any particular level as long as it does not yield negative net income after raising GBR reserves. Similar to 340f reserves, the funding of GBR reserves does not influence tax payments. In a regulatory context, they are treated as tier 1 capital according
4 For details cf. European Commission (1986).
5 Cf. for example Bauer (1987), p. 864, and Krumnow et al. (2004), pp. 604f.
6 For the sake of simplicity, we will, from now on, talk of ’IFRS accounting’ when referring to IAS/IFRS or
US-GAAP, since if a bank in our sample uses these accounting rules in addition to HGB, the vast majority does so by means of IAS/IFRS accounting.
7 However, if a bank chooses to convert hidden reserves into visible ones, the conversion does not affect the income
statement. In such a case, the level of GBR reserves increases on the balance sheet, while the corresponding item on the income statement remains unchanged.
to section 10 Section 2a of the German Banking Act (’KWG’), while, by contrast, 340f reserves are merely recognized as tier 2 capital. The higher quality of regulatory capital assigned to visible reserves can be regarded as another incentive to increase
corporate disclosure.8
The decision on whether or not to fund or release GBR reserves is entirely at the discretion of the bank’s management. Approval by shareholders is not needed to build GBR reserves. These reserves must not be dedicated to covering the risks arising from certain specified assets. GBR reserves display key features of equity (economically speaking). However, from a purely legal point of view, they have to be reported separately on a bank’s balance sheet.
4
Theoretical Background
4.1 Motives for (Not) Using GBR Reserves
Since the aim of financial accounting is to provide information, we adopt the
in-formation content approach in this paper.9 Clearly, information given via financial
statements can be useful in a pre- and a post-decision manner. On the one hand, dis-closure of accounting information will help potential investors and depositors when coming to an investment decision (pre-decision information function). On the other hand, financial accounting helps mitigate agency problems between bank managers and existing investors (post-decision information function). Informational aspects play a leading role in understanding why management may prefer to build GBR re-serves rather than using other instruments that fulfill similar functions. Since bank managers are the ones to choose, we will predominantly take their perspective as the basis for our evaluation.
Most intuitively, GBR reserves are a means of risk provisioningandinternal
cap-ital accumulation to cover general banking risks. German banks can also achieve these aims by creating hidden 340f reserves or by retaining earnings. At least theo-retically, raising new equity may be a third alternative to cover unforeseen risks. As they are hidden, 340f reserves may help hide a bad signal from potential
in-vestors.10As a result of informational asymmetries between investors and the bank’s
management, increasing visible GBR reserves may be regarded as evidence of a risen risk level at the bank. For short, we will refer to this as the ’bad risk signal’ below. In other words, building visible reserves may lead to a loss of confidence in the bank’s economic prosperity. Hence, potential capital suppliers may refrain from investing in the company. However, this bad signaling effect is likely to vanish over time as more and more banks use GBR reserves.
In addition, it is important to note that the bad risk signal is of different relevance for different types of institution. Firstly, money-center banks are not exposed to this signaling effect to the same extent as smaller ones. This is because the economic well-being of large banks is assumed to have a huge impact on the stability of the whole financial system. Bankruptcy or illiquidity of such an institution is likely to cause severe uncertainty regarding the safety of bank deposits. Therefore, money-center banks are often held to be ’Too Big To Fail’ (TBTF), since governmental
9 Cf. Christensen/Demski (2003), pp. 3-6.
10 Disregarding all informational considerations for a moment, the existing limit on the amount of 340f reserves
(to 4% of the valuation basis) may present a material drawback with respect to all functions. Confidential statements from practitioners, however, suggest that this is not really a binding restriction.
institutions are supposed to support ailing banks to avoid financial instability.11 Secondly, banks subject to public law (for simplicity also called ’public banks’ here-inafter), e.g. thrifts as well as federal and state banks, may also not be exposed to this bad signal to the same extent as privately owned banks. Maintenance obliga-tion (’Anstaltslast’) and guarantee obligaobliga-tion (’Gewaehrtraegerhaftung’) formerly in place in Germany basically eliminated all likelihood of such banks becoming bankrupt or illiquid. Maintenance and guarantee obligations, which had been an important characteristic of the German banking market for a long time, had to be abolished in 2005 because they did not comply with European competition regula-tions. However, the consequences for the risk provisioning signal effects are still in place, especially because debt issued before 2005 is still protected.
Retaining earnings also serves the risk provisioning function. In terms of the decision-making process within the bank, managers may, however, prefer to increase GBR reserves. Shareholders’ or owners’ approval is essential for retaining earnings and also for releasing them. Managers intending to use earnings to cover general banking risks cannot be certain that the owners will not choose to distribute them. Consequently, they may prefer to use their discretionary powers to build visible or hidden reserves instead. In other words, building these reserves deprives owners of their right to decide on the appropriation of what would otherwise become the bank’s equity. Since investors may anticipate this behavior, increasing GBR reserves may represent a bad signal stemming from informational asymmetries. Building reserves may indicate that bank managers are uncertain of obtaining shareholders’ approval for retaining earnings, since there may be more profitable investment alternatives (with a similar risk level). If so, the owners will try to extract money by claiming a higher dividend. Due to their informational head start, the insiders’ conceivable skepticism about the bank’s prospects can be seen as a bad signal to outside investors. In the following, we will refer to this as a bad ’management signal’ for short. Based on insiders’ behavior, other capital market participants may be reluctant to invest money in the company. Nevertheless, this bad signal may also disappear over time with the increasing use of GBR reserves. Like the bad risk signal outlined above, this bad signal is also much less relevant for banks subject to public law. Their specific ownership structure, with municipal and state authorities as owners, makes them virtually independent of equity markets. There is no need to attract new shareholders and mechanisms of stock market valuation do not apply to this type of bank. Their owners, too, may prefer to have more rather than less profits available for redistribution.
11 For more details on first evidence for TBTF policy used by the Federal Deposit Insurance Corporation (FDIC) in
the 1980s, cf. FDIC (1997), pp. 235-257. The more recent failure of Lehman Brothers may have been intended to demonstrate that TBTF does not hold. The disruptions following the default, however, were such that governments all over the world officially acknowledged TBTF by assuring they would rescue any bank relevant to the financial system.
The theory of corporate control comes into play here. It is well proven that com-panies with only a few (possibly large and influential) owners are monitored more
closely than companies featuring a disperse ownership structure.12Monitoring helps
to reduce informational asymmetries between a bank’s management and its share-holders. In Germany, banks subject to public law (mainly thrifts and federal state banks) are usually owned by a small number of cities or municipalities, whereas ownership of private and especially incorporated banks is usually widespread. Man-agers of closely monitored banks may prefer to make use of hidden 340f reserves rather than the visible alternative to avoid the bad management signal and pre-vent shareholders from demanding the distribution of profits. Combining this line of argument with the ones for the risk and the management signal yields conflicting predictions in terms of the choice between visible and hidden reserves for banks subject to public law. On the one hand, they may not be exposed to the bad risk and the bad management signal and therefore make use of GBR reserves. On the other hand, their managers may be closely monitored, resulting in the primary use of hidden 340f reserves. The question as to which of these two effects outweighs the other will be the subject of our empirical analysis in Section 5.
In terms of raising new equity as a means of risk provisioning, the main conclusions of the Pecking Order Theory developed by Myers (1984) and Myers/Majluf (1984) have to be taken into account. In short, companies prefer internal finance to debt and equity issuance. Once more, the basis for this theory are informational asymme-tries between the management of and potential investors in a company. If managers believe a company to be undervalued, they will not raise new equity for financing purposes because investors will need to pay less than the company is worth. Con-versely, managers who believe that their company is overvalued will likely issue stock since investors will pay more than the company’s value. Thus, the attempt to sell stock typically shows that a company is overvalued. Therefore issuing equity sends a worse signal about the managers’ beliefs to capital markets than raising funds inter-nally. This may result in managers’ preference for increasing GBR or 340f reserves or retaining earnings rather than issuing equity.
Besides risk provisioning, increasing GBR reserves can also be used as a way of
internal financing and cash flow management. The level of earnings available
for distribution to owners (dividends, say) is lowered by building reserves. Thus, free cash flow does not leave the bank but is instead at management’s disposal for
financing new projects.13 Creating 340f reserves may again be a wise alternative to
using GBR reserves from the management’s point of view, since doing so will not
12 Cf. Levine (2004), who comments on special features of corporate governance in banks.
13 Cf. Christensen/Demski (2003), pp. 125-126 for the information content of cash flows and pp. 35-45 for their
send a bad risk or management signal to capital markets. This line of argument also holds for retaining earnings, which likewise avoids conflicts in closely monitored banks. However, in this case, management cannot decide about the development of retained earnings and therefore has to convince shareholders to supply funds.
A bank’s management may also decide to deliberately use GBR reserves as a
sig-naling device to reduce any informational asymmetries between themselves and the bank’s owners or depositors. Building these reserves shows that the bank is in a economically strong position and that it is generating sufficient profits to build GBR reserves. We will from now on refer to this as the ’signal of strength’ for short. This interpretation of course runs counter to the effect, outlined above, whereby GBR reserves act as a bad risk signal. Which of the two effects outweighs the other is the subject of our empirical analysis. The signal of strength may even be intensified by achieving a constant rise in GBR reserves as shown on the balance sheet over time. Confidential statements from practitioners indeed prove this to be an important motive for which the profitability of a bank is certainly a key factor.
In terms of use as a signaling device, retaining earnings is the only valuable alterna-tive to building GBR reserves. It shows that the bank is generating sufficient profits and is in good shape. Boosting the equity ratio by retaining earnings avoids the bad risk signal incurred by funding GBR reserves.
Creating hidden 340f reserves is not an alternative in this context, since their level is not visible to external observers and capital markets. Banks are, of course, free to disclose the volume of hidden reserves they hold within the notes to the financial statement. However, hardly any bank does so. Issuing new equity – if deemed to have any signaling effect at all in this context – is fairly counterproductive. According to Pecking Order Theory, issuing new equity is a clear sign that management believes the company to be overvalued. Such an overvaluation may stem from capital markets overestimating the bank’s future earnings potential. Therefore, the wish to raise new equity will certainly reveal this error of judgment.
Any kind of reserves may be used as a tool forearnings management. Bank
man-agers often aim at assuring their stockholders a stable or – preferably – a slightly growing annual dividend. An increase in the regular annual dividend is usually interpreted by investors as a sign of management’s confidence in future earnings prospects. Therefore, stock prices and the company’s value are likely to rise
follow-ing an increase in dividends.14 Obviously, this motive is closely connected to the
aforementioned use of GBR reserves as a signaling device.
14 For further details, cf. the basic dividend model developed by Lintner (1956) and further research by
In terms of earnings management, the only reasonable alternative to creating GBR reserves is to use hidden 340f reserves. In years of economic well-being, profits will suffice to distribute stable or slightly growing dividends. At the same time, bank management may deliberately undervalue assets within the given limits (accord-ing to section 340f HGB). These undervaluations can be reversed in economically bad periods to achieve dividend stability. Again, the bad management signal may be avoided by using 340f rather than GBR reserves. Using retained earnings influ-ences declared profits rather than net income and is thus inappropriate for earnings management purposes. Raising new equity does not have any impact at all in this context.
Having introduced some aspects that are mainly driven by informational asymme-tries, some practical issues potentially driving the use of GBR reserves must not be disregarded. Most closely connected to the aforementioned risk provisioning is a
bank’s need to enhance its regulatory capital endowment. Under Basel II and
the German Solvency Regulation, banks have to hold a certain amount of capital in relation to their risk-weighted assets. GBR reserves are acknowledged as tier 1 capital and can therefore help eliminate regulatory capital shortages.
With respect to boosting the tier 1 capital endowment, retaining earnings and raising new equity are equivalent options to an increase in GBR reserves. A bank may also influence its regulatory capital endowment by reducing its risk-weighted assets, of course. However, we ignore this because it is related to changes on the asset side of the balance sheet, which we are not looking at. With respect to tier 1 capital endowment, 340f reserves are not equivalent because they are recognized as tier 2 capital only.
Achieving an increase in a bank’s tier 1 capital endowment by retaining earnings avoids both bad signals described above stemming from a rise in GBR reserves. Another alternative is to raise new equity. However, the line of argument concerning the Pecking Order Theory (as mentioned before) holds here, too.
Moreover, the obligation to disclose hidden 340f reserves when preparing financial
statements according to IFRSin addition to HGB (we will henceforth simply call such banks ’IFRS banks’) may be another motive for using GBR reserves. Whereas building hidden reserves is explicitly allowed under HGB accounting, IFRS prohibit this. Consequently, if a German bank wishes or has to prepare its (group) financial statements according to IFRS, it must disclose its former 340f reserves. Doing so in its HGB unconsolidated financial statements as well may then be beneficial for two reasons. Hidden reserves are revealed within the IFRS accounts, so they partly lose their latent characteristics anyway. However, it is unclear whether the extent of hidden reserves becomes fully evident when transferring HGB accounts to IFRS
due to the different categories of financial instruments and the different valuation rules. Nevertheless, we deem this aspect to be important. Furthermore, getting rid of hidden reserves is one step towards eliminating costly parallel book keeping. The bank may also decide to disclose hidden reserves by putting these funds into retained earnings rather than increasing GBR reserves. Showing these disclosed re-serves as profits and distributing them to the owners of the bank is another option for management. Since this distribution serves neither financing nor risk provisioning purposes, it will not be discussed in any further detail.
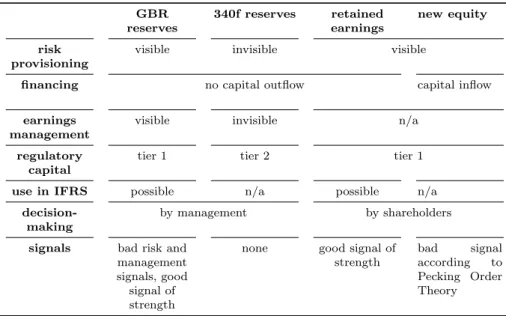
Table 1 summarizes the most important results of our theoretical considerations. GBR reserves 340f reserves retained earnings new equity risk provisioning
visible invisible visible
financing no capital outflow capital inflow
earnings management
visible invisible n/a
regulatory capital
tier 1 tier 2 tier 1
use in IFRS possible n/a possible n/a
decision-making
by management by shareholders
signals bad risk and
management signals, good signal of strength
none good signal of strength
bad signal according to Pecking Order Theory
Table 1: Evaluation of GBR reserves and the alternatives.
4.2 Hypotheses
Starting from theoretical considerations, we arrive at the following hypotheses. To simplify and enhance understandability, we will phrase the hypotheses in an eco-nomically rather than a statistically correct manner.
H 1: The size of a bank has a positive impact on the management’s decision to use GBR reserves.
This hypothesis refers to the fact that the bad risk signal from using GBR reserves may not be as important for money-center banks as for smaller institutions. When a large bank experiences financial distress, intervention by government authorities is very likely according to the TBTF theory.
H 2: Being a banksubject to public lawhas an impact on the use of GBR reserves. The particular ownership structure of public banks makes them less vulnerable to either of the two bad signals caused by GBR reserves. However, the fact that banks subject to public law are usually owned by a small number of cities or municipalities means these banks are subject to a higher level of monitoring. Consequently, their management may decide to use hidden 340f rather than GBR reserves as outlined above. Which of those two effects outweighs the other is the subject of our empirical analysis.
H 3: The use of GBR reserves increases over time.
The more banks use visible reserves, the more the bad risk signal as well as the bad management signal will diminish. So we expect to see a continuous rise in the number of banks using GBR reserves as well as in the aggregate size of GBR reserves for all banks from 1995 through 2007.
H 4: The risk level of a bank has an impact on the decision to use GBR reserves. Since GBR reserves are meant to prevent general banking risks, a bank’s risk level will presumably have an impact on their use. Hence, we expect to see a positive correlation. By contrast, high-risk banks may be in such financial distress that they cannot fund reserves. Accordingly, we cannot hypothesize in advance whether a high risk level has a positive or a negative impact on the management’s decision to fund GBR reserves.
H 5: The regulatory capital endowment has a negative impact on the use of GBR reserves.
Under the German Banking Act, GBR reserves are recognized as tier 1 capital. Therefore, banks that are short of regulatory capital may prefer to build GBR rather than 340f reserves.
H 6: Being a bank that publishes its statements according to IFRS as well as HGB (’IFRS banks’) has a positive impact on the use of GBR reserves.
IFRS accounting does not allow for hidden reserves to be built as under section 340f HGB. Therefore, we would expect IFRS banks to convert hidden reserves into the visible alternative upfront, and we anticipate a strong correlation between the use of GBR reserves and preparing financial statements according to IFRS.
H 7: The profitability of a bank has a positive impact on the decision to use GBR reserves.
This hypothesis is closely connected to the use of GBR reserves as a signal of strength. To be able to fund GBR reserves, a bank has to be fairly profitable.
There-fore, we should see a bank’s profitability having a positive influence on its likelihood of using GBR reserves and the extent to which it does so. One is tempted to interpret this hypothesis in a way that assumes that GBR reserves will be used for earnings management purposes. Since the corresponding coefficient in our regressions would have the same sign if this were the case, it is not clear which of the two effects is responsible. However, the analysis of earnings management behavior is the subject of further research.
5
Empirical Analysis
5.1 Data and Variables
For our empirical analysis, we use data from the Bundesbank’s prudential database BAKIS (BAKred Information System) for the years 1995 through 2007. BAKIS is the information system on bank-specific data which is jointly operated by the Deutsche Bundesbank and the German Financial Supervisory Authority (BaFin). The database contains information on the financial statements and supervisory re-ports of individual German banks. Therefore, our analysis is based on a micro panel
of annual supervisory bank-level data for 4,916 German banks.15We merely analyze
unconsolidated accounts prepared according to HGB, since building GBR reserves is not allowed within financial statements prepared according to any international accounting regime.
In some parts of our analyses, we divide the German banking market into four
dif-ferent categories according to bank size and legal status: Savings banks (henceforth:
Thrifts), cooperative banks (Coops), small private banks (henceforth: Small
Cred-its), and large banks (Large Banks). The latter category contains the five largest
German private banks as well as the federal state banks and the central institutions of the cooperative banking sector. We are aware of the fact that this categorization is somewhat unusual since German banks are commonly grouped merely according to their legal status into savings banks, cooperative banks and private banks. However, we assume that much of banking institutions’ behavior is mainly driven by their size rather than their legal status.
We deliberately excluded other types of financial institutions like home loan banks, mortgage banks or securities trading banks since they either do not fulfill the defi-nition of a bank according to section 1 KWG or they do not conduct core banking businesses such as lending and borrowing. Owing to a lack of data and mergers during the observed time period, the panel is unbalanced and consists of 32,023 bank-year observations.
It is noteworthy that coverage (meaning the proportion of banks included in our panel in relation to the overall number of banks in Germany) is always close to
and mostly exceeds 90% for each bank category in each year. ForThrifts and Small
Credits, we do achieve coverage of 100% at least for 2005, as shown in Table 2.
15 Due to our treatment of mergers, this figure is higher than the actual number of existing banks. In case of a
merger, we, technically speaking, created a new bank that is independent of the merging ones. This new bank starts operating in the year of the merger. For the purposes of our analysis, there is no need to distinguish between mergers, takeovers or any other kind of acquisition.
Year Thrifts Coops Small Credits Large Banks 1995 98.9 97.2 94.9 90.9 2000 99.5 98.2 89.0 86.4 2005 100.0 98.4 89.9 89.5
Table 2: Coverage by bank groups for selected years (in %).
Thrifts Coops Small Credits Large Banks Total Year No. row% No. row% No. row% No. row% No. row% 1995 619 18.5 2,519 75.3 188 5.6 20 0.6 3,346 100.0 1996 606 18.6 2,448 75.3 178 5.5 21 0.7 3,253 100.0 1997 594 18.7 2,364 74.6 191 6.0 20 0.6 3,169 100.0 1998 589 19.7 2,197 73.5 183 6.1 20 0.7 2,989 100.0 1999 575 20.8 1,992 72.1 177 6.4 20 0.7 2,764 100.0 2000 559 22.2 1,760 69.9 178 7.1 20 0.8 2,517 100.0 2001 535 23.0 1,597 68.8 171 7.4 19 0.8 2,322 100.0 2002 517 23.9 1,462 67.5 167 7.7 20 0.9 2,166 100.0 2003 488 23.9 1,375 67.4 159 7.8 19 0.9 2,041 100.0 2004 476 24.2 1,317 67.0 154 7.8 18 0.9 1,965 100.0 2005 463 24.4 1,273 67.2 142 7.5 17 0.9 1,895 100.0 2006 454 24.7 1,234 67.0 135 7.3 18 1.0 1,841 100.0 2007 427 24.3 1,189 67.8 122 7.0 17 1.0 1,755 100.0 Total 6,902 21.6 22,727 71.0 2,145 6.7 249 0.8 32,023 100.0
Table 3: Number of observations in the panel by bank categories over time.
Table 3 gives detailed information on the number of banks observed in our panel and the split between the bank categories over time. The share of each bank category is fairly constant over time, whereas the absolute number of banks decreases (almost) steadily, reflecting mergers that have occurred in the German banking sector in the
last decade.Coopsdominate our sample. They have a share of roughly 71%, followed
byThrifts (22%), Small Credits (7%), and Large Banks with about 1%.
We apply the following variables to measure the use of GBR reserves: GBRi,t is
the amount of GBR reserves of bank i in year t and GBRTA
i,t is the share of GBR
reserves in relation to total assets of bankiin yeart. The binary variableD GBRi,t
takes the value 1 if banki shows a positive amount of GBR reserves in yeart (thus
GBRi,t >0) and 0 otherwise.
RegardingH1, we useSIZEi,t as a proxy for thesizeof the bank, which is measured
as the natural logarithm of total assets of banki in yeart. To prevent endogeneity,
we exclude the amount of GBR reserves included in a bank’s total assets.
With respect to H2, D PUBLICi is 1 if bank i is subject to public law and 0
otherwise. This variable is constant over time because changes in legal status did not occur.
Referring to H3, we are including time dummy variables τt. Hence, we can control
for changes in GBR reserves during the course of our analysis and find time-fixed effects.
To account for banks’ individualrisk levels (corresponding toH4), we use the
non-performing loan ratio of a bank i in year t and name it NPLi,t. The choice of this
proxy is based on the assumption that banks with a high NPL ratio are also exposed to generally high risk levels. It is calculated as the ratio of non-performing to total customer loans. Loans are non-performing if the bank is waiting for payments which
are overdue by at least 90 days.16
To somehow control for banks using GBR reserves as a signal of strength, we finally
include D 340fi,t, a dummy variable which takes the value 1 if a bank is using any
hidden 340f reserves and 0 otherwise. If a bank is able to fund both types of
reserves, it is likely in a strong economic position, and one way of showing this is by means of GBR reserves.
To analyze the endowment with regulatory capital (relevant toH5), we use the level
of tier 1 capital a bank has in relation to its risk-weighted assets. Once more to prevent endogeneity when examining the influence of the tier 1 capital endowment, we exclude the volume of GBR reserves inherent in tier 1 capital. The corresponding
variable is named TIER1i,t.
The dummy D IFRSi,t is used for H6, t. It takes the value 1 if bank i in year
t prepares its (group) financial statements according toIFRS in addition to HGB
and 0 otherwise. Note that this dummy is time-variant because many banks changed their status from ’non-IFRS’ to ’IFRS’ (but not the other way round) during the period of our analysis.
Finally, we use ROAi,t, which is the return on assets (ROA) of bank i in year t,
as a proxy for the profitability of a bank. With respect to H7, it is calculated as
the ratio of operating income (income before risk provisioning) to total assets of
banki in year t. Using operating income rather than net income or declared profits
eliminates any effects stemming from legal accounting policy on the one hand or manipulation on the other hand.
A relatively moderate outlier treatment is applied to the dataset, in which we trun-cate explanatory variables (except for dummy variables) at the 0.5% and 99.5% quantile. To account for the heterogeneity of the capital adequacy ratio (tier 1
16 For technical reasons, the numerator of this ratio, on top of troubled customer loans also comprises
non-performing interbank lending, whereas the denominator merely contains the sum of a bank’s customer loans. Thus, the NPL ratios may be overstated to a certain extent. However, since the volume of troubled interbank loans has generally been low, at least before the start of the financial crisis, this should be negligible.
No. of TA in D PUBLIC D IFRS D 340f TIER1 NPL ROA Category banks EUR 1,000 (in %) (in %) (in %) (in %) (in %) (in %)
Thrifts 762 1,745,338 98.7 0.1 98.6 7.8 3.9 0.7 Coops 3,633 303,811 0.0 0.0 95.2 8.5 5.2 0.7 Small Credits 311 2,863,477 0.0 5.3 42.4 11.2 6.5 0.7 Large Banks 33 70,512,546 60.6 28.5 91.2 7.5 2.6 0.22 Total 4,916 1,331,881 21.7 0.6 92.4 8.5 5.0 0.7
Table 4: Number of banks and mean of observations in the panel by category.
capital of a bank in relation to its risk-weighted assets), we use an upper-bound truncation of this variable at the 97% quantile.
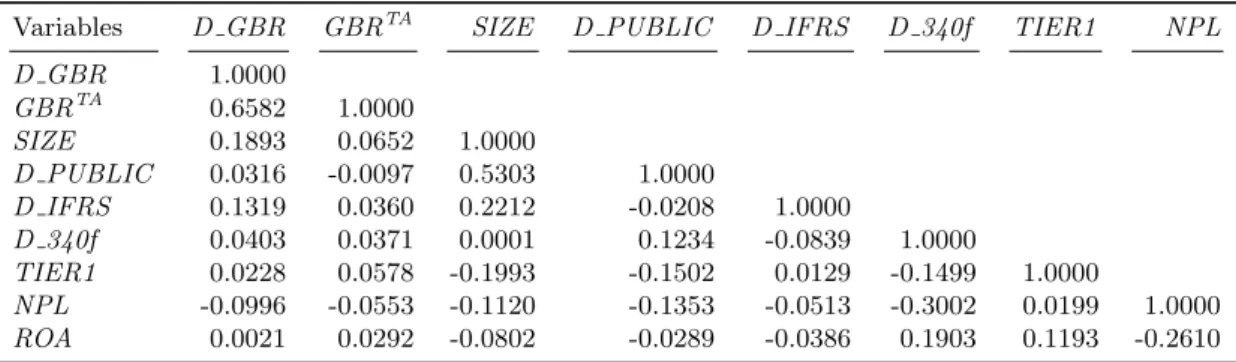
Table 4 shows the number of banks per category as well as averages per category and across all banks for these variables. Since the table shows the mean of observations and not the mean of banks, those banks with many observations in the panel have a higher weight than banks which contribute only a few observations. The quite low average of total assets for all banks is the result of the dominance of Coops in the sample. Generally speaking, correlation is low and multicollinearity is therefore not a serious problem. Table 5 reports the correlation coefficients for the variables in our analysis.
Variables D GBR GBRTA SIZE D PUBLIC D IFRS D 340f TIER1 NPL
D GBR 1.0000 GBRTA 0.6582 1.0000 SIZE 0.1893 0.0652 1.0000 D PUBLIC 0.0316 -0.0097 0.5303 1.0000 D IFRS 0.1319 0.0360 0.2212 -0.0208 1.0000 D 340f 0.0403 0.0371 0.0001 0.1234 -0.0839 1.0000 TIER1 0.0228 0.0578 -0.1993 -0.1502 0.0129 -0.1499 1.0000 NPL -0.0996 -0.0553 -0.1120 -0.1353 -0.0513 -0.3002 0.0199 1.0000 ROA 0.0021 0.0292 -0.0802 -0.0289 -0.0386 0.1903 0.1193 -0.2610
5.2 Results
5.2.1 Descriptive Statistics
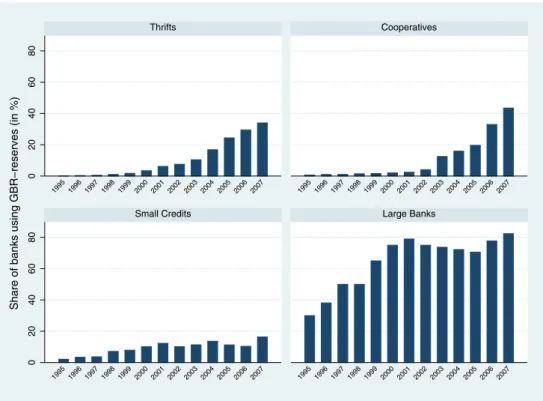
First of all, we compute the share of banks holding a positive volume of GBR reserves
with the help of the mean of D GBR17. For Thrifts, Figure 1 shows that this share
slowly increased until 2000, followed by a steeper rise in recent years (reaching 34%
in 2007). For Coops, a similar, even more pronounced development is characterized
by a rapid increase in 2003, 2006 and 2007. The share ofCoops using GBR reserves
has doubled from 2005 to 2007, ultimately reaching 43%. The share ofSmall Credits
showing GBR reserves increased slightly in the years from 1995 through 2001 and fluctuated between 10% and 17% until 2007.
The Large Banks take the lead in the use of GBR reserves, starting at a share of about 30% in 1995, and fluctuating between 70% and 83% until 2007. When looking at these numbers, it has to be considered that the overall number of banks within this category is fairly small. Since federal or state banks (being large and public) as well as large cooperative central and the largest German private banks are included
in this category, our findings are in line with hypothesis H1 (size). This is true for
the initially hesitant use of GBR reserves within Thrifts and Coops and the low
share of usage within Small Credits as well, since these groups primarily consist of
smaller banks. Further confirmation is provided by the correlation coefficients for
D GBR and SIZE in Table 5.
With respect toH2 (public), our findings indicate that the extent of monitoring and
corporate control lowers the use of GBR reserves, since almost all banks subject to
public law areThrifts and largely did not make use of GBR reserves, at least in the
early years of our analysis. The conflicting (since positive) sign of the correlation
coefficient of D PUBLIC with D GBR (as given in Table 5) calls for a deeper
analysis regarding the dummy for banks subject to public law, as we outline in the next section.
The share of banks using GBR reserves within the banking sector as a whole rose
steadily from 0.8% in 1995 to 39.2% in 2007. Bearing in mind that Thrifts and
Coops dominate our sample, Figure 1 clearly exhibits this rise. This confirms our
hypothesis regarding time, H3.
To gain deeper insight into the use of GBR reserves, we counted the number of
activ-ities involving these reserves over time (cf. Table 6). The second column First year
0 20 40 60 80 0 20 40 60 80 1995 1996 1997 1998 1999 2000 2001 2002 2003 2004 2005 2006 2007 1995 1996 1997 1998 1999 2000 2001 2002 2003 2004 2005 2006 2007 1995 1996 1997 1998 1999 2000 2001 2002 2003 2004 2005 2006 2007 1995 1996 1997 1998 1999 2000 2001 2002 2003 2004 2005 2006 2007 Small Credits Thrifts Cooperatives Large Banks
Share of banks using GBR−reserves (in %)
Figure 1: Share of banks using GBR reserves per bank category over time.
is a fairly technical one listing observations for which we cannot clearly identify the activity as data for the previous period is lacking. Furthermore, we distinguished
be-tween first-time implementation (Implement), an increase (Raise), a constant level
of zero (Hold at zero), a constant level above zero (Hold above zero), a decrease to
a still positive level (Reduce), and a termination of the whole balance sheet item
(Terminate). Apparently, an existing level is increased much more often than low-ered. Similarly, we observed substantially more implementations than terminations.
Supporting H3 (time), the number of implementations clearly increases over time,
including a sudden rise in 2003.
In this paragraph, we will exclusively focus on those observations where banks use
GBR reserves and on the question of what level of reserves those banks hold.18
To eliminate size effects, we use the ratio of GBR reserves to total assets GBRTA.
Figure 2 shows how this ratio has evolved over time, broken down by bank category.
It reveals startling results especially for Small Credits. The ratio of GBR reserves
to total assets is remarkably high in 1995 and falls to a lower level afterwards. Once more, a steep rise is visible during 2001 and 2002 followed by a sharp decline to a fairly constant level of roughly 0.5% of total assets. When interpreting these findings, the small number of banks showing these reserves within this group has to
18 Technically speaking, we are neglecting all observations withD GBRi
,t=0, i.e. we take a bank into account only in those years in which its level of GBR reserves is positive.
Year First Imple- Raise Hold Hold Reduce Terminate Total year ment (= 0) (>0) 1995 3,346 0 0 0 0 0 0 3,346 1996 153 12 13 3,062 12 0 1 3,253 1997 125 6 8 2,974 25 1 30 3,169 1998 179 20 12 2,727 23 1 27 2,989 1999 205 14 17 2,473 26 0 29 2,764 2000 228 24 28 2,193 24 2 18 2,517 2001 185 31 28 2,013 43 1 21 2,322 2002 140 27 51 1,887 43 4 14 2,166 2003 134 120 64 1,659 46 3 15 2,041 2004 75 70 117 1,571 119 3 10 1,965 2005 65 76 170 1,447 120 4 13 1,895 2006 45 176 234 1,239 134 7 6 1,841 2007 36 154 345 1,028 171 5 16 1,755 Total 4,916 730 1,087 24,273 786 31 200 32,023
Table 6: Number of activities involving GBR reserves over time.
be considered. Thus, the results are driven by very few institutions. For Thrifts, a
steady increase is visible for the years from 1997 onwards. This is generally true for Large Banks as well as Coops. However, the latter display sudden rises in 2000 and 2006. 0 1.5 0.5 1.0 0 1.5 0.5 1.0 1995 1996 1997 1998 1999 2000 2001 2002 2003 2004 2005 2006 2007 1995 1996 1997 1998 1999 2000 2001 2002 2003 2004 2005 2006 2007 1995 1996 1997 1998 1999 2000 2001 2002 2003 2004 2005 2006 2007 1995 1996 1997 1998 1999 2000 2001 2002 2003 2004 2005 2006 2007 Small Credits Thrifts Cooperatives Large Banks
GBR / Total Assets (in %)
5.2.2 Regression Models
Addressing the first of our research questions, relating to the factors driving the probability of a bank making use of GBR reserves, it is helpful to estimate probit
models using D GBR as the dependent variable. This is done in Model A.1, where
we examine the influence of the independent variablesSIZE (referring to hypothesis
H1),D PUBLIC (H2),NPL(H4),D 340f (indirectly related toH7),TIER1 (H5), D IFRS (H6) andROA (H7) on the probability that a bank will use GBR reserves.
Moreover, we include the time dummies (τt) to find time-fixed effects (referring to
H3). Since we do not control for any unobservable random or bank-fixed effects, it
is simply a pooled time-fixed effects estimation. The formal design of Model A.1 is
given in equation (1):
P(D GBRi,t = 1) =β0+β1·SIZEi,t +β2·D PUBLICi +β3·NPLi,t
+β4·TIER1i,t +β5·D 340fi,t +β6·D IFRSi,t
+β7·ROAi,t +
11
t=1[β(10+t)·τ(1995+t)].
(1)
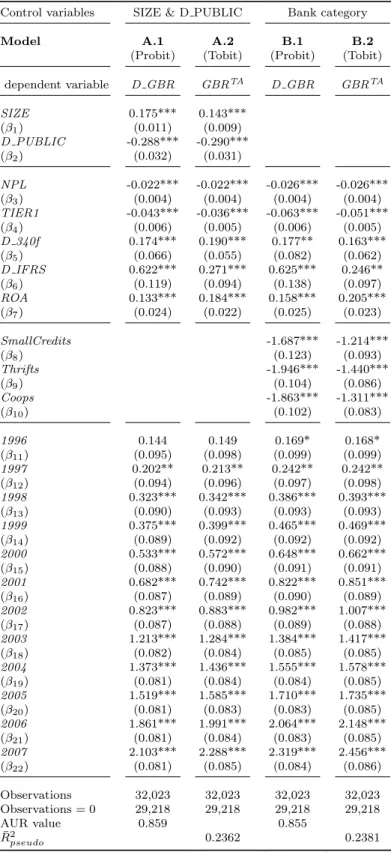
The estimated coefficients as well as the corresponding standard errors (in brackets) are shown in the second column of Table 7. Additionally, the AUR value as well as
the number of observations with D GBR= 0 are given at the bottom.19
With respect to the second research question, we investigate which factors are re-sponsible for the precise level of GBR reserves a bank’s management chooses to
hold. To this end, we employ a tobit model (Model A.2) with GBRTA as the
de-pendent variable. The tobit methodology20 accounts for the fact that the level of
GBR reserves is naturally truncated at zero. Ignoring this and using OLS regression models, which allow for negative values of the dependent variable, would systemat-ically underestimate the slope of the regression line. We are using the same set of independent variables as in Model A.1 and again pooling the data while controlling
for time-fixed effects. The formal design of Model A.2 is given in equation (2):
19 To assess the fit of the overall Model A.1, we calculate the AUR value, which equals the area under the so-called
Receiver Operating Characteristic Curve. For a more detailed description of ROC curve analysis cf. Flach et al. (2003) and Fawcett (2006). In our case, the AUR value measures the ability of the model to correctly identify those banks using GBR reserves (thus havingD GBRi,t= 1) and those not using them. The larger the AUR
value (equaling the area under the ROC curve), the more accurate the model in question is. The corresponding AUR value of roughly 86% means that our model has excellent accuracy.
GBRT A i,t =
Yi,t if Yi,t >0
0 if Yi,t ≤0
Yi,t =β0+β1·SIZEi,t +β2·D PUBLICi +β3·NPLi,t
+β4·TIER1i,t +β5·D 340fi,t +β6·D IFRSi,t
+β7·ROAi,t +
11
t=1[β(10+t)·τ(1995+t)] +i,t.
(2)
The estimated coefficients as well as the corresponding standard errors (in brackets)
are shown in the third column of Table 7. Additionally, ¯R2
pseudo and the number of
observations with GBRTA =0 are given at the bottom.
In order to test whether an independent variable has an impact onD GBR(GBRTA
respectively), i.e. the correspondingβis non-zero, we should be able to reject the null
hypothesis ofβ = 0 at a preferably high level of significance.21Broadly speaking, the
results of both analyses are identical (with respect to the sign of the coefficients). Therefore, we conclude that the variables driving the probability of using GBR
reserves also influence the level of GBRTA.22
As expected, we find a strongly significant positive influence of the variable SIZE,
i.e.β1 >0, which means that large banks tend to use GBR reserves more often than
small banks and show a higher level. Once more, our (economic) hypothesis H1 is
confirmed.
Because β2 < 0, the dummy variable D PUBLIC apparently has a negative and
significant influence on the probability of a bank making use of GBR reserves. In other words, if a bank is subject to public law, it is less likely to use visible reserves
than if it is privately owned. Therefore,H2 is also confirmed.23The effect of a close
monitoring of the management in banks subject to public law (suggesting that those banks’ managers will not make use of GBR reserves) obviously outweighs the lines of argument relating to both the risk and the management signal (suggesting that
21 In the following, we say for short that the independent variable has a significantly positive impact on the
dependent variable, meaning that the corresponding coefficient has a positive sign and significantly differs from 0 according to the t-test.
22 This proves that the choice of the tobit model is appropriate in our setting. If different variables influenced the
likelihood of the use of GBR reserves and the level ofGBRT A, results would be different in those two model
types. A Heckman approach would then be adequate for modeling our research questions correctly.
23 At first sight, this result contradicts the positive correlation coefficient betweenD PUBLIC andD GBR(as
given in Table 5). However, this may be owing to the considerable positive correlation betweenD PUBLIC andSIZE. In other words, the fact that large banks are usually more likely to use GBR reserves and that, at the same time, public banks are fairly large may cause this correlation which more than compensates for the negative effect ofD PUBLIConD GBR.
Control variables SIZE & D PUBLIC Bank category
Model A.1 A.2 B.1 B.2
(Probit) (Tobit) (Probit) (Tobit) dependent variable D GBR GBRTA D GBR GBRTA SIZE 0.175*** 0.143*** (β1) (0.011) (0.009) D PUBLIC -0.288*** -0.290*** (β2) (0.032) (0.031) NPL -0.022*** -0.022*** -0.026*** -0.026*** (β3) (0.004) (0.004) (0.004) (0.004) TIER1 -0.043*** -0.036*** -0.063*** -0.051*** (β4) (0.006) (0.005) (0.006) (0.005) D 340f 0.174*** 0.190*** 0.177** 0.163*** (β5) (0.066) (0.055) (0.082) (0.062) D IFRS 0.622*** 0.271*** 0.625*** 0.246** (β6) (0.119) (0.094) (0.138) (0.097) ROA 0.133*** 0.184*** 0.158*** 0.205*** (β7) (0.024) (0.022) (0.025) (0.023) SmallCredits -1.687*** -1.214*** (β8) (0.123) (0.093) Thrifts -1.946*** -1.440*** (β9) (0.104) (0.086) Coops -1.863*** -1.311*** (β10) (0.102) (0.083) 1996 0.144 0.149 0.169* 0.168* (β11) (0.095) (0.098) (0.099) (0.099) 1997 0.202** 0.213** 0.242** 0.242** (β12) (0.094) (0.096) (0.097) (0.098) 1998 0.323*** 0.342*** 0.386*** 0.393*** (β13) (0.090) (0.093) (0.093) (0.093) 1999 0.375*** 0.399*** 0.465*** 0.469*** (β14) (0.089) (0.092) (0.092) (0.092) 2000 0.533*** 0.572*** 0.648*** 0.662*** (β15) (0.088) (0.090) (0.091) (0.091) 2001 0.682*** 0.742*** 0.822*** 0.851*** (β16) (0.087) (0.089) (0.090) (0.089) 2002 0.823*** 0.883*** 0.982*** 1.007*** (β17) (0.087) (0.088) (0.089) (0.088) 2003 1.213*** 1.284*** 1.384*** 1.417*** (β18) (0.082) (0.084) (0.085) (0.085) 2004 1.373*** 1.436*** 1.555*** 1.578*** (β19) (0.081) (0.084) (0.084) (0.085) 2005 1.519*** 1.585*** 1.710*** 1.735*** (β20) (0.081) (0.083) (0.083) (0.085) 2006 1.861*** 1.991*** 2.064*** 2.148*** (β21) (0.081) (0.084) (0.083) (0.085) 2007 2.103*** 2.288*** 2.319*** 2.456*** (β22) (0.081) (0.085) (0.084) (0.086) Observations 32,023 32,023 32,023 32,023 Observations = 0 29,218 29,218 29,218 29,218 AUR value 0.859 0.855 ¯ R2pseudo 0.2362 0.2381
Standard errors in brackets. *** p<0.01, ** p<0.05, * p<0.1
banks subject to public law are likely to make greater use of GBR reserves than others).
The coefficient on NPL,β3, is strongly significant and negative. This indicates that
banks with a low volume of non-performing loans in relation to their customer loans are more likely to use GBR reserves and they are doing so to a greater extent. Since the NPL ratio measures the risk level of a bank, the probability that low risk
banks will use GBR reserves, and with a higher intensity, is obviously higher.H4 is
backed.24
Looking atTIER1, the corresponding coefficientβ4is significantly negative, meaning
that banks which are short of regulatory capital build higher levels of GBR reserves
and do so more often. Thus, H5 is backed, too.
An interesting result is indicated by the positive coefficient β5 (relating to the
vari-able D 340f). This positive coefficient shows that banks that already hold 340f reserves are more likely to use visible GBR reserves, too, and to use them with
higher intensity.25 This supports the hypothesis that reserves serve as a signaling
device (inherent inH7) for the following reason. Banks which are able to build 340f
reserves are assumed to be economically healthy. Thus, they may use GBR reserves (as a clearly visible balance sheet item) to signal their strength to outsiders. More-over, it might also be the case that some banks first build up 340f reserves to the 4% limit of the overall value of the relevant financial assets, and later on they make use of GBR reserves.
Since β6 > 0, the variable D IFRS has a positive and significant influence on the
probability and intensity of the use of GBR reserves. Banks that prepare accounts according to IFRS are more likely to hold GBR reserves than other banks.
Further-more, they build higher levels of these reserves. Hence, H6 is supported as was the
case with respect to the correlation coefficients in Table 5.
In line with the function of GBR reserves as a signal of strength,β7 is significant and
positive, meaning that banks with a high ROA are more likely to use GBR reserves and are doing so to a greater extent than banks with a lower return in relation to
their total assets.H7 is confirmed by the regression outcomes as well as the positive
correlation coefficients in Table 5.
Finally, all coefficients on the time dummies, β11 to β22, are significant at a high
level except for the year 1996. Moreover, the coefficients are steadily increasing.
This is statistically strong evidence for hypothesis H3 predicting increasing use of
24 The corresponding correlation coefficient in Table 5 confirms this result.