Preliminary results of multidisciplinary observations before, during
and after the Kocaeli (Izmit) earthquake in the western part
of the North Anatolian Fault Zone
Y. Honkura1, A. M. I¸sikara2, N. Oshiman3, A. Ito4, B. ¨U¸cer2, S¸. Bari¸s2, M. K. Tun¸cer2, M. Matsushima1, R. Pekta¸s2, C. C¸ elik2, S. B. Tank2, F. Takahashi1, M. Nakanishi1, R. Yoshimura3, Y. Ikeda5, and T. Komut2
1Department of Earth and Planetary Sciences, Tokyo Institute of Technology, Tokyo 152-8551, Japan 2Kandilli Observatory and Earthquake Research Institute, Bo˘gazic¸i University, Istanbul, Turkey
3Disaster Prevention Research Institute, Kyoto University, Kyoto 611-0011, Japan 4Faculty of Education, Utsunomiya University, Utsunomiya 321-0943, Japan
5Department of Geography, University of Tokyo, Tokyo 113-0033, Japan
(Received October 5, 1999; Revised February 19, 2000; Accepted March 9, 2000)
On August 17, 1999, a destructive earthquake occurred in the western part of the North Anatolian Fault Zone, Turkey. The earthquake source region has been designated as a seismic gap and an M7-class earthquake has been supposed to occur someday in the future so as to fill this seismic gap. So far we have undertaken various kinds of observations in this area and we could obtain some valuable data before, during and after the mainshock. Here we report some of the preliminary results of our recent studies, which include field work started in late July this year and continued during and after the earthquake occurrence just in the earthquake source region and its vicinity, in addition to seismic observations carried out for several years before the mainshock. Much emphasis is put on magnetotelluric field data acquired during the mainshock; in fact, large variations caused by seismic waves were recorded. Such variations could be interpreted in terms of electromagnetic induction in the conducting crust caused by the velocity field interacting with the static magnetic field of the Earth. In particular, the first motion of seismic wave could be identified in the records and used for precise determination of the hypocenter of the mainshock.
1.
Introduction
Since the 1939 Erzincan earthquake (M = 7.9), large earth-quakes have successively migrated toward the west along the North Anatolian Fault Zone; the final one was the Mudurnu earthquake of 1967 (Allen, 1982; Stein et al., 1997). Its western extension has therefore been supposed to be a seis-mic gap (Mogi, 1968; Sykes, 1971) and the occurrence of a large earthquake has been feared (Toks¨oz et al., 1979). In spite of such a situation, no detailed basic information such as the distribution of active faults, seismicity, crustal structure, and so on had been available in early 1980’s. In view of this, in 1981 we initiated our field study in the seismic gap area (Honkura and I¸sikara, 1991). Since then we continued our study, not continuously but rather intermittently at the early stage, and only recently we could establish a radio-linked seismic network called IZINET, consisting of 13 stations, in order to monitor seismicity in the seismic gap area. The distribution of stations is shown later.
In the seismic gap region, that is west of the rupture zone of the 1967 Mudurnu earthquake, the North Anatolian Fault Zone branches into two main segments; the northern branch which we have called the Izmit-Sapanca fault zone and the southern branch which we have called the Iznik-Mekece fault. Some linear fault traces are clear in the southern
Copy right c The Society of Geomagnetism and Earth, Planetary and Space Sciences (SGEPSS); The Seismological Society of Japan; The Volcanological Society of Japan; The Geodetic Society of Japan; The Japanese Society for Planetary Sciences.
branch, whereas the northern branch is complicated as char-acterized by some geomorphological evidence showing com-pressional features (Ikeda, 1988; Tun¸cer et al., 1991), in con-trast to transtensional features implied by focal mechanisms of earthquakes (Evans et al., 1985).
On July 27, we started our field campaign for 1999, with the main target put on the deep resistivity structure below active faults in the seismic gap area. For this we intended to make magnetotelluric (MT) measurements at some sites along a north-south profile crossing both the northern and the southern branches at the same time, and started the measure-ments at the southern end with successive shifts toward the north. On August 17, the electric and the magnetic fields had been measured at five sites, four of which were found later to be located very close to the surface rupture zone associated with the Kocaeli (Izmit) earthquake. Recording was found to have started successfully at 17:00 local time on August 16, one day before the mainshock, and lasted until 9:00 on August 17. During this recording, the mainshock occurred at about 3:01. To our surprise, seismic waves were recorded in the magnetotelluric data and they contributed to precise hypocenter determination, as we show later.
We also show a preliminary model of the resistivity struc-ture along the north-south profile crossing the rupstruc-ture zone. Special attention will be paid to whether characteristic fea-tures can be seen in relation to the rupture processes. In addition to such MT work, we show a seismicity map during the year of 1998, that is before the mainshock, and also the
Mudurnu earthquake (Ambraseys and Zatopek, 1969), but rather extend from Sapanca Lake to Akyazi, from where the rupture zone follows another fault extending in the ENE di-rection. It should be noted, however, that the eastern half of this fault remains unruptured, as indicated in Fig. 1(a).
(a)
(b)
Fig. 1. (a) Surface rupture zones (thick lines) associated with the Kocaeli (Izmit) earthquake of August 17, 1999. Thin lines indicate other unrup-tured branches of the North Anatolian Fault Zone, including the segment ruptured during the Mudurnu earthquake of 1967. (b) Distribution of the amount of strike slip along the surface rupture zone associated with the Kocaeli (Izmit) earthquake. In addition to these, small amount (0.2∼0.5 m) of vertical slip was observed at several localities without any system-atic pattern.
In the west of Izmit, from where the rupture started, the rupture zone seems to extend below the sea and no informa-tion is derived from field surveys. The distribuinforma-tion of after-shocks (see Fig. 4) clearly indicates the westward extension of about 50 km from the epicenter of the mainshock.
Figure 1(b) shows the distribution of the slip amount along the east-west projection of the rupture zone. In the main-shock area near Izmit, the slip amounts to about 2∼3 m and
rived from waveform inversion made by Yagi and Kikuchi (1999). They also pointed out a subevent which occurred about 30 seconds after the mainshock. As will be shown later in the magnetotelluric records, another seismic wave is superimposed to the seismic wave of the mainshock; it seems to correspond to such a subevent. The subevent may be a separate earthquake along the fault extending ENE from Akyazi. If this is the case, such an earthquake would have been triggered by the rupture of the mainshock.
3.
Seismicity before the Mainshock
It has been well known that seismicity in the northern branch is rather high, as characterized by clustering of small earthquakes in some areas (Crampin, 1985; Evans et al., 1987; Lovell et al., 1989). In contrast, seismicity has been extremely low in the southern branch (Tsukuda et al., 1988; Nishigami et al., 1990; Iio et al., 1991). Since 1995, our seismic network called IZINET, consisting of 13 stations as shown by triangles in Fig. 2, has been in operation and overall seismicity covering both the northern and southern branches has become clearer, and clustering in the northern branch turned out to be a persistent feature at least for these 15 years.
Such characteristics of seismicity are also evident in the seismicity map for 1998 shown in Fig. 2. In this map, we can find some clustering areas; the most notable one is seen in the vicinity of Izmit. Other notable clustering areas are located in the western extension of the northern branch and also in the Marmara Sea. A less notable clustering area can also be seen in the east. Here we point out that a subevent seems to have been triggered at another fault which extends from this clustering area to the direction of ENE.
4.
Hypocenter of the Mainshock
As we show below, we could extract seismic wave infor-mation in the magnetotelluric records at five sites. The arrival time of first motion in these records at these MT sites could be used for determining the hypocenter of the mainshock, in addition to MARNET ( ¨U¸cer et al., 1985) of the Kandilli Ob-servatory and Earthquake Research Institute, Bo˘gazi¸ci Uni-versity. Some parameter values thus determined for the main-shock are shown in Table 1. The epicenter is also shown in Fig. 3 together with the locations of MT sites and nearby seismic stations. Addition of MT sites reduced errors in pa-rameter value estimates to about halves; the uncertainty in hypocenter location is now less than 2 km. Thus we can claim that the hypocenter is located below the surface rupture zone.
Fig. 2. Distribution of seismic stations in the study area. Triangles denote the IZINET stations and squares the MARNET stations. Open circles represent epicenters of earthquakes which occurred during 1998. Fault traces are based on Barka (1992, 1997).
Although epicenters shown in the seismicity map for 1998 are unlikely to have been determined with enough accuracy, we may also claim that the rupture for the mainshock initiated at the western edge of the notable clustering area, implying a possible relation between the clustering and the rupture initi-ation. For more detailed discussion, it would be necessary to relocate hypocenters for earthquakes before the mainshock, using the information derived from aftershock observations at some stations established temporarily after the occurrence of the mainshock.
5.
Distribution of Aftershocks
Figure 4 shows the distribution of aftershocks during seven days after the mainshock, determined so far from the records at IZINET stations only; records are also available at some MARNET ( ¨U¸cer et al., 1985) stations, but they were not used. There are some records which have not yet been processed and so this map of aftershocks during seven days is still incomplete. We think, however, that the overall feature of aftershock distribution is well represented in this map.
In the eastern region, aftershocks seem to scatter widely, but contrary to our expectation, they do not seem to be along the rupture zone but rather to be elongated, at least partly, along the fault zone of the western extension of the Mudurnu earthquake of 1967. Such a scattered distribution of after-shocks might be a result of stepover of fault traces between the Mudurnu and Sapance segments. However, this region is not well covered by the present network and hence such scat-tering might be due to inaccurate hypocenter determination. In any case, a more detailed aftershock distribution map will be provided soon by including the data at some temporary sites.
In the western region, we can clearly find the tendency that aftershocks occur in clustering along the rupture zone. This is in good agreement of the focal mechanism of the
main-Fig. 3. The location (star symbol) of epicenter of the mainshock. Triangles denote the magnetotelluric sites where the electric and magnetic fields had been measured before, during and after the mainshock. The records during the mainshock were used to locate the hypocenter of the mainshock in addition to seismograms at the IZINET and MARNET stations; two of them are shown in this figure by slanted squares.
Fig. 4. Distribution of aftershocks during one week after the mainshock. Hypocenters of aftershocks were determined using the data at seismic stations denoted by squares.
shock determined by USGS, M. Kikuchi and others. The rupture zone seems to have extended to 29.1◦E in longitude, as indicated in Fig. 4. A marked clustering area which can be seen in the southwest of the western end of the rupture zone at 29.1◦E would be a different type of earthquake swarm, presumably triggered by the rupture of the mainshock.
It should be noted here that some of the clustering areas coincide with the locations where clustering was seen before the mainshock (see Fig. 3). This tendency seems to imply that seismic coupling between the two fault planes is fairly heterogeneous and generally weak except for some patches where clustering is observed. As will be shown later, the hypocenter is located at a depth of 15 km where a high re-sistivity zone exists below a low rere-sistivity zone at shallower depth. In the low resistivity zone, the water content is high and hence the resistance to fault slip may be low. In contrast, the high resistivity zone would correspond to a basement rock with little water and behave as an asperity (Kanamori, 1981) in the fault zone.
determination of small earthquakes together with their focal mechanisms.
6.
Resistivity Structure
The role of crustal fluid on the generation of earthquakes has been emphasized recently (Zhao et al., 1996; Zhao and Negishi, 1998). In view of this, the deep resistivity structure of an active fault, which should at least roughly reflect the water content, has attracted much attention, and magnetotel-luric surveys have been undertaken at various faults (Ogawa and Honkura, 1997; Mackie et al., 1997; Unsworth et al., 1997, 1999). As a result, many cases have been found that a low resistivity zone prevails in the vicinity of fault zones.
Since no information on the resistivity structure has been available in our study area, we decided to make magnetotel-luric observations along a profile crossing the northern and the southern branches, as shown by the distribution of sites in Fig. 5(a). In addition to these sites, we set up one additional site near Iznik, as a reference station for remote reference data processing (Gamble et al., 1979).
On August 16 and 17, MT instruments happened to be in operation at sites 118, 120, 121 and 122 near the rupture zone of the mainshock, and also at the reference site. The data turned out to include very interesting and valuable infor-mation as will be described later. The total number of sites is 32 but the data quality at three of them was found to be bad. In this preliminary report, therefore, we excluded these bad data and hence further analyses were made for the remaining 29 sites.
We then applied two-dimensional inversion to the TM-mode apparent resistivity and phase data, using a scheme based on the ABIC optimum criterion developed by T. Uchida and Y. Ogawa (Uchida, 1993; Ogawa and Uchida, 1996). The frequency range for the data used for this inversion is between 240 Hz and 0.0005 Hz and so the upper-crust struc-ture should be well resolved. The resistivity strucstruc-ture thus derived is shown in Fig. 5(b). The resolution is not high in this figure, because the number of mesh points is kept small in this rather preliminary inversion. Nonetheless, this result should represent the overall feature.
The resistivity is very low, less than 10m or so, be-low the northern branch to a depth of 10 km or so. The correspondence between the surface rupture zone, as shown by an arrow, and the lowest resistivity zone may not seem good in this figure, but such a detailed feature is unlikely to be resolved in the present preliminary inversion. It is also clear that a high resistivity zone exists below the low
resis-(a)
(b)
Fig. 5. (a) Distribution of magnetotelluric sites along a profile crossing the northern and the southern branches. Site 001 is the reference site for remote reference data processing. Sites 118, 120, 121 and 122 happened to be in operation on August 16 and 17. Site 122 is located on the northern side of the surface rupture zone and the others on the southern side. (b) Preliminary result of two-dimensional inversion applied to the TM-mode data. The horizontal distance is measured northward from the southern-most site (left).
tivity zone. As already pointed out, the hypocenter of the mainshock is considered to be located within this high resis-tivity zone. In fact, the hypocenter is located about several kilometers west of the magnetotelluric sites, but we presume that the structure in this area would be approximated by a two-dimensional one.
In any case, the northern branch is characterized by a well developed low resistivity zone, whereas no marked feature is found for the southern branch, although a local low resistivity zone, which is unlikely to be resolved in the present MT survey, was found at shallow depth at some sites (Honkura
et al., 1985). This indicates that the northern branch is more
active. This agrees with the information derived from GPS studies (Straub and Kahle, 1997).
7.
Seismic Waves Recorded in the Magntotelluric
Data
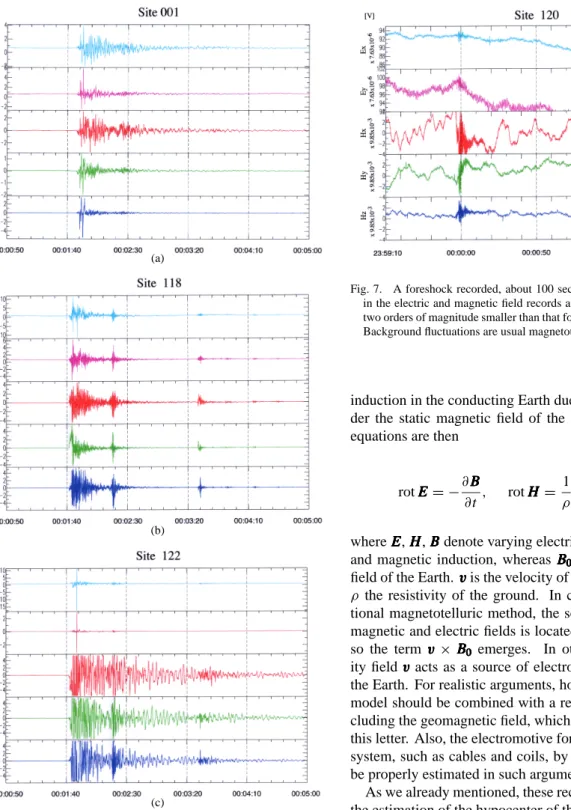
As described above, the magnetotelluric fields had been recorded even during the occurrence of the mainshock. We now show what effects could be found in the magnetotelluric fields. Figure 6 shows the original time series data; the two components of the electric field and the three components of the magnetic field at site 118 located in the south of the rupture zone, at site 122 located in the north and also at the
(a)
(b)
(c)
Fig. 6. The northward (Ex) and eastward (Ey) electric field records, and
the northward (Hx), eastward (Hy) and downward (Hz) magnetic field
records during the mainshock at (a) site 001 (reference site), (b) site 118 (south of the rupture zone) and (c) site 122 (north of the rupture zone). The electrode separation is 50 m at site 001, 36 m at 118, and 30 m at 122. Corrections are required for the frequency-dependent response of the induction coil to obtain magnetic field values in T. For 1 Hz, the sensor response is about 109V/T. Some aftershocks can also be recognized most
clearly in the records at site 118.
remote reference site. To our surprise, these records look like seismograms.
One possible mechanism of the generation of such signals in the electric and magnetic fields can be electromagnetic
Fig. 7. A foreshock recorded, about 100 seconds before the mainshock, in the electric and magnetic field records at site 120. The amplitude is two orders of magnitude smaller than that for the mainshock (see Fig. 6). Background fluctuations are usual magnetotelluric field variations.
induction in the conducting Earth due to ground motion un-der the static magnetic field of the Earth. The governing equations are then
rot EEEEEEEE= −∂BBBBBBBB
∂t , rot HHHHHHHH=
1
ρ(EEEEEEEE+vvvvvvvv×BBBBBBBB00000000),
where EEEEEE, HEE H , BHHHHHH BBBBB denote varying electric field, magnetic field,BB
and magnetic induction, whereas BBBBBBBB00000000is the static magnetic
field of the Earth.vvvvvvvvis the velocity of the ground motion and
ρ the resistivity of the ground. In contrast to the conven-tional magnetotelluric method, the source field for varying magnetic and electric fields is located inside the Earth, and so the term vvvvvvvv×BBBBBBBB00000000 emerges. In other words, the
veloc-ity fieldvvvvvvvvacts as a source of electromagnetic induction in the Earth. For realistic arguments, however, a seismic wave model should be combined with a realistic Earth model in-cluding the geomagnetic field, which is beyond the scope of this letter. Also, the electromotive force in the measurement system, such as cables and coils, by ground vibration must be properly estimated in such arguments.
As we already mentioned, these records were valuable for the estimation of the hypocenter of the mainshock. Also we can find some characteristics of the seismic waves. We can see significant differences between two sites which are close to each other. First, the amplitude of the magnetic signals is significantly larger at site 122 than at site 118, presumably reflecting the amplitude of seismic waves. Second, the dom-inant period is longer at site 122. Third, the duration of the wave train is longer at site 122. These three factors are likely to reflect the ground condition and must have greatly affected the degree of damage to houses. In fact, the resistivity at site 122 is very low, as shown in Fig. 5(b).
A small foreshock could also be detected about 100 sec-onds before the mainshock as shown in Fig. 7. The am-plitude of MT signal due to this foreshock is two orders of magnitude smaller than that for the mainshock, and hence no corresponding signal was recorded at the reference site.
strong zones.
3) The rupture initiated at the depth of 15 km and propa-gated in both the east and west directions, and stopped at other strong zones.
4) Even after the occurrence of the mainshock, weak zones remain weak with little seismic energy release, resulting in low aftershock activity there.
5) A strong zone in the hypocentral area is characterized by a high resistivity zone.
Acknowledgments. The results introduced in this article could be obtained through the contribution of many colleagues who par-ticipated in the field work. We thank all the members for their hard work during the field work. We also thank Y. Ogawa and H. Kuroki for their help in performing preliminary two-dimensional resistivity inversion, and two reviewers, A. Barka and H. Utada, for their valu-able comments on the original manuscript. We are grateful to THY (Turkish Airlines) for kind help and support to our project. This project was supported by the Ministry of Education, Science, Cul-ture and Sports of Japan under grant-in-aid for scientific research No. 11694063 and also by the research fund of Bo˘gazi¸ci University.
References
Aki, K., Characterization of barriers on an earthquake fault, J. Geophys. Res., 84, 6140–6148, 1979.
Allen, C. R., Comparisons between the North Anatolian fault of Turkey and the San Andreas fault, California, In Multidisciplinary Approach to Earthquake Predicition, Edited by A. M. I¸sikara and A. Vogel, Friedr. Vieweg & Sohn, Braunschweig, 67–75, 1982.
Ambraseys, N. N. and A. Zatopek, The Mudurnu valley, west Anatolia, Turkey, earthquake of 22 July 1967, Bull. Seism. Soc. Am., 59, 521–589, 1969.
Barka, A. A., The North Anatolian Fault Zone, Annales Tectonicae, 6, 164-195, 1992.
Barka, A. A., Neotectonics of the Marmara region, in Active Tectonics of Northwestern Anatolia –The MARMARA Poly-Project, Edited by C. Schindler and M. Pfisters, Hochschulverlag AG an der ETH, Zurich, pp. 55–87, 1997.
Crampin, S., R. Evans, and S. B. ¨U¸cer, Analysis of local earthquakes: the Turkish Dilatancy Projects (TDP1 and TDP 2), Geophys. J. R. astr. Soc., 83, 1–16, 1985.
Evans, R., I. Asudeh, S. Crampin, and S. B. ¨U¸cer, Tectonics of the Marmara sea region of Turkey: new evidence from micro-earthquake fault plane solution, Geophys. J. R. astr. Soc., 83, 47–60, 1985.
Evans, R., D. Beamish, S. Crampin, and S. B. ¨U¸cer, Turkish Dilatancy Project (TDP3): multidisciplinary studies of a potential earthquake source region, Geophys. J. R. astr. Soc., 91, 265–286, 1987.
Gamble, T. D., W. M. Goubau, and J. Clarke, Magnetotellurics with a remote reference, Geophysics, 44, 53–68, 1979.
Honkura, Y. and A. M. I¸sikara, Multidisciplinary research on fault activity in the western part of the North Anatolian Fault Zone, Tectonophys., 193, 347–357, 1991.
Honkura, Y., A. M. I¸sikara, D. Kolcak, N. Orbay, S. Sipahio˘glu, N. Ohshi-man, and H. Tanaka, Magnetic anomalies and low ground resistivity as
Mackie, R. L., D. W. Livelybrooks, T. R. Madden, and J. C. Larsen, A magnetotelluric investigation of the San Andreas fault at Carrizo Plain, California, Geophys. Res. Lett., 24, 1847–1850, 1997.
Mogi, K., Sequential occurrences of recent great earthquakes, J. Phys. Earth, 16, 30–36, 1968.
Nishigami, K., Y. Iio, C. G¨urb¨uz, A. Pinar, N. Aybey, S. B. ¨U¸cer, Y. Honkura, and A. M. I¸sikara, Microseismic activity and spatial distribution of coda-Q in westernmost part of the North Anatolian Fault Zone, Turkey, Bull. Dis. Prev. Res. Inst. Kyoto Univ., 40, 41–56, 1990.
Ogawa, Y. and Y. Honkura, An audiomagnetotelluric view of the Atera fault, J. Geomag. Geoelectr., 49, 1065–1071, 1997.
Ogawa, Y. and T. Uchida, A two-dimensional magnetotelluric inversion assuming Gaussian static shift, Geophys. J. Int., 126, 69–76, 1996. Stein, R. S., A. Barka, and J. H. Dieterich, Progressive failure of the North
Anatolian fault since 1939 by earthquake stress triggering, Geophys. J. Int., 128, 594–604, 1997.
Straub, C. and H.-G. Kahle, GPS and geologic estimates of the tectonic activity in the Marmara Sea region, NW Anatolia, J. Geophys. Res., 102, 27587–27601, 1997.
Sykes, L. R., Aftershock zones of great earthquakes, seismicity gaps, and earthquake prediction for Alaska and the Aleutians, J. Geophys. Res., 76, 8021–8041, 1971.
Toks¨oz, M. N., A. F. Shakal, and A. J. Michael, Space-time migration of earthquakes along the North Anatolian Fault Zone and seismic gaps, Pure Appl. Geophys., 117, 1258–1270, 1979.
Tsukuda, T., K. Satake, Y. Honkura, S. B. ¨U¸cer, and A. M. I¸sikara, Low seismicity, low coda-Q and discontinuities of the upper crust in the vicin-ity of the Iznik-Mekece fault, the North Anatolian Fault Zone, Turkey, Bull. Earthq. Res. Inst. Univ. Tokyo, 63, 327–348, 1988.
Tun¸cer, M. K., Y. Honkura, N. Oshiman, Y. Ikeda, and A. M. I¸sikara, Mag-netic anomalies related to active folds in the North Anatolian Fault Zone, J. Geomag. Geoelectr., 43, 813–823, 1991.
¨
U¸cer, S. B., S. Crampin, R. Evans, and N. Kafadar, The MARNET radio linked seismometer network spanning the Marmara Sea and the seismicity of western Turkey, Geophys. J. R. astr. Soc., 83, 17–30, 1985. Uchida, T., Smooth 2-D inversion for magnetotelluric data based on
statis-tical criterion ABIC, J. Geomag. Geoelectr., 45, 841–858, 1993. Unsworth, M., G. Egbert, and J. Booker, High-resolution electromagnetic
imaging of the San Andreas fault in Central California, J. Geophys. Res., 104, 1131–1150, 1999.
Unsworth, M. J., P. E. Malin, G. D. Egbert, and J. R. Booker, Internal structure of the San Andreas Fault Zone at Parkfield California, Geology, 25, 359–362, 1997.
Yagi, Y. and M. Kikuchi, Source process of 17 August 1999 Turkey earth-quake, Programme and Abstracts, Seismol. Soc. Japan 1999 Fall Meeting, A70, 1999.
Zhao, D. and H. Negishi, The 1995 Kobe earthquake: seismic image of the source zone and its implications for the rupture nucleation, J. Geophys. Res., 103, 9967–9986, 1998.
Zhao, D., H. Kanamori, and H. Negishi, Tomography of the source area of the 1995 Kobe earthquake: evidence for fluids at the hypocenter?, Science, 274, 1891–1894, 1996.
Y. Honkura (e-mail: yhonkura@geo.titech.ac.jp), A. M. I¸sikara, N. Os-himan, A. Ito, B. ¨U¸cer, S¸. Bari¸s, M. K. Tun¸cer, M. Matsushima, R. Pekta¸s, C. C¸ elik, S. B. Tank, F. Takahashi, M. Nakanishi, R. Yoshimura, Y. Ikeda, and T. Komut