In-cylinder Simulation of Spark Ignition Engine Using Heptane as Fuel
SMG Akele1, J. A. Akpobi2 and A. T. Iyore31
Mechanical Engineering Department, Auchi Polytechnic, Auchi, NIGERIA 2
Production Engineering Department, University of Benin, Benin City, NIGERIA 3
Mechanical Engineering Department, Auchi Polytechnic, Auchi, NIGERIA
Abstract :The suction and compression strokes of internal combustion engine, such as spark ignition engine (SIE) or compression ignition engine (CIE) areinfluenced by the amount of air or fuel intake and the degree of mixing in the cylinder. While On the other hand, the power and exhaust strokes are known to influence the rate and flame propagation of combustion.The objective of this study is to perform in-cylinder simulation of injection in spark ignition engine (SIE) in order to determine the variation of particle traces, fuel mole fraction and velocity from inlet port to the cylinder.This is achieved by the use of CFD software to analyze and solve Continuity, Navier-Stokes and Energy equations governing the working medium. Ansys Design-Modellerwas used to generate model mesh from model designed from Solidworks.
Study results revealed velocity of injected fuel to be maximum at inner region of valve face and the heptane used as fuel more concentrated near cylinder wall as it enters the cylinder. The mole fraction concentration was high at the center of the cylinder at the end of the final crank angle, while maximum velocity of fuel occurred near cylinder as crank angle increases.
Keywords: in-cylinder, injection, valves, simulation, velocity, pressure. I. INTRODUCTION
The suction and compression strokes of internal combustion engine, such as spark ignition engine (SIE) or compression ignition engine (CIE)influence the amount of air or fuel intake and degree of mixing in the cylinder. On the other hand, the power and exhaust strokes are known to influence the rate and flame propagation of combustion.And because combustion process is a phenomenon that involves turbulence, loss of air-fuel mixture during inflow and outflow into the cylinder, various researchers explored the turbulent intake and combustion aspect of ICE cycle. The turbulence during ICE suction and compression strokes enhances good air-fuel mixing. Gurram et al. (2015) simulated in-cylinder conditions of a four-stroke single cylinder SIE using ANSYS Fluent. The simulation was run for a particular air-fuel ratio by defining the mean mixture fraction and variance. Calculated Equivalence Ratio of the engine was used to carry out simulation. The peak temperature and pressure were evaluated and compared with real time values.Khorramdel et al. (2017)found out in an investigation that in-cylinder flow field at the end of compression stroke and before fuel injectionimpact on improving air-fuel mixing.Pasha and Imran (2015) carried out analysis on parameters like velocity,temperature and pressureboundary conditions using ANSYS Fluent.Purohit et al. (2014) carried out cold flow CFD simulation of internal combustion engine to ascertain mixture formation and velocity at different crank angles. Sridhar et al. (2013) numerically simulated turbulent flow and combustion in an idealized homogeneous charge of a four-stroke using the Discrete Phase Model ICEperformed at constant speed of 2400 rpm and compression ratio of 9:1 and excess air of 1.0.Islam et al. (2016) analyzed velocity, temperature, pressure, and swirl ratio of pre-mixed combustion in a single cylinder.
International Journal of Recent Trends in Engineering & Research (IJRTER) Volume 06, Issue 12; December - 2020 [ISSN: 2455-1457]
@IJRTER-2020, All Rights Reserved 2
The objective of this study is to perform in-cylinder simulation of injection in spark ignition engine (SIE) in order to determine the variation of particle traces, fuel mole fraction and velocity from inlet port to the cylinder.
II. SIMULATION OF TURBULENT FLOW
To simulation of turbulent flow requires solving Continuity and Navier-Stokes equations. There are different categories of simulations. One is the direct numerical simulation without turbulence model and is most accurate simulation.Second is the Large Eddy Simulation (LES) for solving time dependent problems accurately.A third is the Reynolds Average-NavierStokes simulation which is more computationally demanding.
CFD codes are used extensively in engine technology improvement. And several commercial simulation packages like ANSYS Fluent, DYNA and so on are available for performing any of the following simulations:
2.1 Port Flow Simulation - entails quantifying of flow rate, swirl and tumble, with static engine geometry at different locations during the engine cycle.
2.2 Cold Flow Simulation - involves engine cycle with moving geometry, air flow, and no fuel injection.
2.3 In-Cylinder Combustion Simulation - involves power and exhaust strokes with fuel injection, ignition, reactions, and pollutant prediction on moving geometry.
2.4 Full Cycle Simulation – involves the simulation of the entire engine cycle with air flow, fuel injection, combustion, and reactions.
III. MATHEMATICAL FORMULATIONS
Flow is governed by the Continuity and Navier Stokespartial differential equations (3.1), (3.2), (3.3) and (3.4) inCartesian coordinates:
Continuity equation: 0 u u u x y z ∂ ∂ ∂ + + = ∂ ∂ ∂ (1) 2 2 2 2 2 2 x-momentum equation: x u u u u p u u u u v w g t x y z x x y z
ρ
∂ + ∂ + ∂ + ∂ = −∂ +µ
∂ +∂ +∂ +ρ
∂ ∂ ∂ ∂ ∂ ∂ ∂ ∂ (2) 2 2 2 2 2 2 y-momentum equation: y v v v v p v v v u v w g t x y z y x y zρ
∂ + ∂ + ∂ + ∂ = −∂ +µ
∂ +∂ +∂ +ρ
∂ ∂ ∂ ∂ ∂ ∂ ∂ ∂ (3) 2 2 2 2 2 2 z-momentum equation: z w w w w p w w w u v w g t x y z z x y z ρ∂ + ∂ + ∂ + ∂ = −∂ +µ∂ + ∂ + ∂ +ρ ∂ ∂ ∂ ∂ ∂ ∂ ∂ ∂ (4) 2 2 2 2 Energy equation p T T T T T T C u v w k x y z x x y zρ
∂ + ∂ + ∂ = ∂ ∂ +∂ +∂ +φ
∂ ∂ ∂ ∂ ∂ ∂ ∂ (5)IV. METHOD OF SOLUTION
The method of solution employed to analyze and solve the in-cylinder simulation is ANSYS Fluent CFD software thatemploys finite volume method of numerical analysis to solve the continuity, Navier-Stokes and energy equations governing the working medium heptane in
cylinder.The model geometry for the analysis was generated
for one cylinder, one suction port and one exhaust port, and two valves. 4.1 Setup
Model space: 2D; Fluid: heptane (C absolute;Energy equations: On, solved fin,turbulence.
Under-relaxation factors: pressure,0.3pa; density, 1, body forces, 1; momentum,0.7N.m; kinetic energy, 0.8m2/s2.
Initialization methods: gauge pressure, 0pa; turbulence kinetic energy, 0.01m dissipation rate, 0.01m2/s3.
V.
Table 1: particle trac
s/n 1 2 3 4 5 6 7 8 9 10 11 12 13 14 15 16 17
cylinder.The model geometry for the analysis was generated in 2D using the Ansys Design for one cylinder, one suction port and one exhaust port, and two valves.
heptane (C7H16); Type: pressure-based; Velocity formulation: Energy equations: On, solved;Time: transient;Flow: standard k-e, standard wall relaxation factors: pressure,0.3pa; density, 1, body forces, 1; momentum,0.7N.m; Initialization methods: gauge pressure, 0pa; turbulence kinetic energy, 0.01m
V. RESULTS AND DISCUSSION
particle traces, mole fraction and velocity crank angle and time
Crank angle (deg) Time (sec)
457 1.667e 459 3.333e 461 5.000e 463 6.667e 465 8.333e 467 1.000e 469 1.167e 471 1.333e 473 1.500e 475 1.667e 477 1.833e 479 2.000e 481 2.167e 483 2.333e 485 2.500e 487 2.667e 489 2.833e
Fig. 1: Model Mesh
using the Ansys Design-Modeller
based; Velocity formulation: standard wall
relaxation factors: pressure,0.3pa; density, 1, body forces, 1; momentum,0.7N.m; turbulence Initialization methods: gauge pressure, 0pa; turbulence kinetic energy, 0.01m2/s2; turbulence
es, mole fraction and velocity crank angle and time
Time (sec) 1.667e-04 3.333e-04 e-04 67e-04 e-04 e-03 67e-03 e-03 e-03 1.667e-03 e-03 e-03 67e-03 e-03 e-03 .667e-03 e-03
International Journal of Recent Trends in Engineering & Research (IJRTER) Volume 06, Issue 12; December - 2020 [ISSN: 2455-1457]
@IJRTER-2020, All Rights Reserved 4
Table 1 shows the crank angle (in degree of crankshaft revolution) and time (in seconds) for the simulation.
Fig. 1 shows model mesh geometry. Fig. 1 shows contour of static pressure along the suction port with minimum value of 0.00e+00pa and maximum value of 3.19e+01pa.Static pressure is seen to have maximum pressure value around the valve face. Fig. 2 shows the velocity vector colored by static pressure in the suction port with minimum value of 3.19e+01pa and maximum 3.21e-01pa.Fig. 3 shows velocity magnitude minimum value of 0.00e+00pa and maximum value of 1.84e-1pa.In Fig. 3, velocity magnitude maximum value occurs in the inner area between valve face and seat, which will aid to commence turbulence in the combustion chamber.Fig. 4 shows velocity vectors colored by velocity magnitude with minimum of 2.88e-04 m/s and maximum of 2.85e-1m/s.Fig. 5 shows contour of static temperature along the suction port with minimum and maximum values of 3.18e+02oK and 3.60e+02oK respectively. In Fig. 5, the maximum temperature is observed to be around the valve face. Fig. 6 shows velocity vectors colored by temperature with minimum of 3.18e+02oK and maximum 3.20e+02oK at crank angle of 360o. Fig. 7indicates turbulence kinetic energy minimumvalue of 9.91e-03m2/s2 and maximum value of 1.16e02m2/s2. Turbulence kinetic energy maximum value occurs around the region where velocity is also maximum, as expected. Fig. 8 shows velocity vectors coloured by turbulence kinetic energy with minimum value of 9.90e-03m2/s2 and maximum of 1.24e-02 m2/s2.Fig. 9 shows contour of mass density of medium with constant value of 1.11e+00kg/m3. Mass density is shown to have maximum value in the outer area of the valve face. Fig. 10shows velocity vectors coloured by density with minimum of 1.10e+00kg/m3 and maximum of 1.11e+00kg/m3.
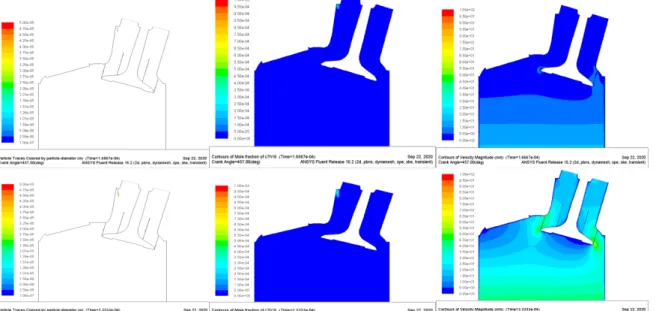
Fig. 12, Fig. 13 and Fig 14 show particle traces, specie mole fraction and velocity for varying crank angle and time respectively. Fig. 12 shows how the particles are traced right from when heptane fuel was injected into the cylinder, and increasing with increase in crank angle. In Fig 12, the particles are shown to travel close to the cylinder wall from where they are expected to tumble towards the center to cause turbulence. Fig. 13 shows how mole fraction varies with crank angle. While Fig. 14 shows how velocity is distributed in the cylinder for different crank angle. And from Fig. 14, maximum velocity occurs close to the cylinder wall. .
International Journal of Recent Trends in Engineering & Research (IJRTER) Volume 06, Issue 12; December - 2020 [ISSN: 2455-1457]
International Journal of Recent Trends in Engineering & Research (IJRTER) Volume 06, Issue 12; December - 2020 [ISSN: 2455-1457]
@IJRTER-2020, All Rights Reserved 8
Fig. 12: Particle tracesFig. 13: Species mole fraction Fig. 14: velocity distribution VI. CONCLUSION
The objective of this study which was to perform in-cylinder simulation of injection SIE in order to determine the variation of particle traces, fuel mole fraction and velocity form inlet port to the cylinder was achieved by using ANSYS Fluent software.
The study revealed that,
• Velocity of injected fuel was very high at inner region of valve face.
• Heptane used as fuel is more concentrated near cylinder wall as it enters the cylinder. • Mole fraction concentration was high at the center of the cylinder.
• Maximum velocity of fuel occurred near cylinder as crank angle increases. REFERENCES
I. Gurram, A. M., Veronika, K. S. and Rao, D. N. (2015): Simulation of Combustion in Spark Ignition
Engine. Journal of Basic and Applied Engineering Research, Volume 2, Number 6; p474-480
II. Islam, A., Sohail, M. U., Ali, S. M., Hassan, A. and Kalvin, R. (2016): Simulation of Four Stroke
Internal Combustion Engine. International Journal of Scientific and Engineering Research, Volume 7, Issue 2, p1212-1219
III. Khorramdel, M., Khaleghi, H.,Heidarinejad, Gh.,Saberi, M. H. (2017): Numerical Analysis of
In-Cylinder Flow n Internal Combustion Engines by LES Method. AUT J. Mech. Eng., 1(1),p29-38
IV. Pasha, S. S. and Imran, M. (2015):Computational Fluid Flow Dynamic Analysis on I.C Engine Using
ANSYS. International Journal of Engineering Research & Technology (IJERT), Vol. 4 Issue 05, p1333 - 1337
V. Purohit, D., Mishra, P. and Banskar, V. (2014): Flow Simulation of an I.C. Engine in FLUENT, ANSYS 14.0. International Journal of Engineering Research and Applications (IJERA), p 252-255
VI. Sridhar, K., Murali, R.B.V., Younus, Sk. M., Lakshmi, K. M. (2013): Computerised Simulation of
Spark Ignition Internal Combustion Engine. IOSR Journal of Mechanical and Civil Engineering (IOSR-JMCE), Volume 5, Issue 3, p05-14