Agricultural and Biosystems Engineering
Publications
Agricultural and Biosystems Engineering
2017
A County-Level Assessment of Manure Nutrient
Availability Relative to Crop Nutrient Capacity in
Iowa: Spatial and Temporal Trends
Daniel S. Andersen
Iowa State University, [email protected]
Puck Custom Enterprises
Follow this and additional works at:
https://lib.dr.iastate.edu/abe_eng_pubs
Part of the
Agriculture Commons
, and the
Bioresource and Agricultural Engineering Commons
The complete bibliographic information for this item can be found at
https://lib.dr.iastate.edu/
abe_eng_pubs/874
. For information on how to cite this item, please visit
http://lib.dr.iastate.edu/
howtocite.html
.
This Article is brought to you for free and open access by the Agricultural and Biosystems Engineering at Iowa State University Digital Repository. It has been accepted for inclusion in Agricultural and Biosystems Engineering Publications by an authorized administrator of Iowa State University
A County-Level Assessment of Manure Nutrient Availability Relative to
Crop Nutrient Capacity in Iowa: Spatial and Temporal Trends
Abstract
During the twentieth century, U.S. agriculture strived to achieve increased food production in order to satisfy both local and export demands. In many cases, this led to increased farm sizes and an operational separation of crop and livestock production. The trend of increasing centralization and industrialization of agriculture, specifically animal agriculture, has resulted in the concentration of waste products associated with animal production (manures and wash-down water) over relatively small geographic areas that are spatially
segregated from crop production areas. Because the distance that manure can be economically hauled for land application has practical limits, the public is concerned that this spatial separation of crop and animal
production areas could lead to over-application of manures near animal feeding facilities, and thus potentially increase the transport of nutrients to ground and surface waters. An aggregated analysis (statewide) of crop and animal production in Iowa suggests that about 30% to 40% of current nitrogen and phosphorus requirements for crop production could be supplied from manures and litters generated from livestock production, while about 50% of potassium requirements could be supplied. However, neither livestock nor crop production in Iowa is uniformly distributed across all counties. This unequal distribution suggests that a more disaggregated analysis of crop nutrient requirements and manure nutrient supply is necessary to estimate the risks of excess nutrient loss to the environment. Thus, we evaluated crop nutrient demand and manure and litter production at the county level to determine if excess manure generation is of concern and to locate areas where additional manures could be used. Results showed that several counties are becoming manure rich, but most locations maintain sufficient capacity to use manure nutrients effectively.
Keywords
Crop nutrient capacity, Manure management, Manure production, Nutrient balance, Nutrient management Disciplines
Agriculture | Bioresource and Agricultural Engineering Comments
This article is published as Andersen, Daniel Steven, and Laura M. Pepple. "A County-Level Assessment of Manure Nutrient Availability Relative to Crop Nutrient Capacity in Iowa: Spatial and Temporal Trends."
Transactions of the ASABE60, no. 5 (2017): 1669-1680. DOI:10.13031/trans.12417. Posted with permission.
Transactions of the ASABE
Vol. 60(5): 1669-1680 © 2017 American Society of Agricultural and Biological Engineers ISSN 2151-0032 https://doi.org/10.13031/trans.12417 1669
A
C
OUNTY
-L
EVEL
A
SSESSMENT OF
M
ANURE
N
UTRIENT
A
VAILABILITY
R
ELATIVE TO
C
ROP
N
UTRIENT
C
APACITY
IN
I
OWA
:
S
PATIAL AND
T
EMPORAL
T
RENDS
D. S. Andersen, L. M. Pepple
ABSTRACT. During the twentieth century, U.S. agriculture strived to achieve increased food production in order to satisfy both local and export demands. In many cases, this led to increased farm sizes and an operational separation of crop and livestock production. The trend of increasing centralization and industrialization of agriculture, specifically animal agri-culture, has resulted in the concentration of waste products associated with animal production (manures and wash-down water) over relatively small geographic areas that are spatially segregated from crop production areas. Because the dis-tance that manure can be economically hauled for land application has practical limits, the public is concerned that this spatial separation of crop and animal production areas could lead to over-application of manures near animal feeding facilities, and thus potentially increase the transport of nutrients to ground and surface waters. An aggregated analysis (statewide) of crop and animal production in Iowa suggests that about 30% to 40% of current nitrogen and phosphorus requirements for crop production could be supplied from manures and litters generated from livestock production, while about 50% of potassium requirements could be supplied. However, neither livestock nor crop production in Iowa is uni-formly distributed across all counties. This unequal distribution suggests that a more disaggregated analysis of crop nutrient requirements and manure nutrient supply is necessary to estimate the risks of excess nutrient loss to the environment. Thus, we evaluated crop nutrient demand and manure and litter production at the county level to determine if excess manure generation is of concern and to locate areas where additional manures could be used. Results showed that several counties are becoming manure rich, but most locations maintain sufficient capacity to use manure nutrients effectively.
Keywords. Crop nutrient capacity, Manure management, Manure production, Nutrient balance, Nutrient management.
riven by worldwide population increases, grow-ing incomes, and increased urbanization, society has experienced a marked and rapid dietary transformation (Castellano, 2010; Smil, 2002a). Specifically, there has been an increase in per capita demand for animal protein (meat, milk, and eggs), with future global meat demands generally expected to increase by 50% over the next two generations, due mostly to anticipated changes in developing countries (Smil, 2002b). In an effort to meet societal demands for food and fiber, agriculture has experi-enced numerous changes over the years, including the inven-tion and use of synthetic mineral fertilizers, which allowed decoupling of crop and animal production systems as, for the first time, crop production was no longer limited to the use of animal and green manures to meet fertility requirements (Yang et al., 2016). In many cases, this change led to in-creased farm sizes (more acres per farm or more animals per farm), an operational separation of crop and livestock
pro-duction as farms became more specialized (Naylor et al., 2005), and increased use of animal confinement facilities as pasture systems gave way to more acres of row-crop agricul-ture that could be supported by the readily available mineral fertilizers.
The trend of increasing demand for meat and livestock products and the associated growth of the animal production industry have resulted in greater amounts of manure (Karlen et al., 2004). It has been suggested that intensification and industrialization of agriculture, specifically animal agricul-ture, has resulted in concentration of waste products, includ-ing manures, wash-down water, and process waters, over rel-atively small geographic areas that are spatially segregated from crop production areas. Because the distance that ma-nure can be economically hauled for land application has practical limits (Hadrich et al., 2010), the spatial separation of crop and animal production areas may lead to over-appli-cation of manure nutrients near animal production facilities, and thus potentially increased transport of nutrients to ground and surface waters (Cooperband and Good, 2002; Alexander et al., 2008).
It has been recognized for years that manures are a valu-able soil amendment due to their potential contribution to improved soil quality, and that manure use plays a key role in nutrient recycling in agricultural systems (Dawson and Hilton, 2011). Drinkwater et al. (1998) stated that a larger proportion of manure-derived carbon is retained in the soil
Submitted for review in May 2017 as manuscript number NRES 12417; approved for publication by the Natural Resources & Environmental Systems Community of ASABE in July 2017.
The authors are Daniel S. Andersen, ASABE Member, Assistant Professor, Department of Agricultural and Biosystems Engineering, Iowa State University, Ames, Iowa; Laura M. Pepple, ASABE Member,
Engineer, Puck Custom Enterprises, Manning, Iowa. Corresponding author: Daniel S. Andersen, 3348 Elings Hall, Iowa State University, Ames, IA 50011; phone: 515-294-4210; e-mail: [email protected].
compared with senescent-crop residues. This is thought to occur because manure-derived carbon is already partly de-composed; thus, the remaining carbon occurs in generally more recalcitrant organic compounds. The return of manure to the soil is thought to improve soil structure, tilth, and wa-ter relationships (e.g., conductivity and retention). Addition-ally, the use of manure as fertilizer is well accepted, as ma-nure includes numerous macro- and micro-nutrients that are essential for crop growth. More recently, it has been sug-gested that manure application can be an important compo-nent of sustainable agriculture. Specifically, Sulc and Tracy (2007) identified four positive factors associated with inte-grating livestock into cropping enterprises: (1) crops can be used to feed livestock, minimizing the import of feed, (2) livestock manure can serve as a source of nutrients for crop production, (3) livestock can serve as a sink for agricul-tural by-products, and (4) ruminant livestock encourage the establishment of perennial grass and legume forages for use as feeds.
This dichotomy, i.e., manure as either waste or resource, has long defined the issue of manure management. The de-bate has intensified as demands for animal protein and agri-cultural sustainability have increased. Opinions on how to achieve this improved sustainability vary greatly, with some arguing that animal production needs to be minimized or even eliminated due to the inherent inefficiency in conver-sion of animal protein (Steinfeld et al., 2006). Others argue in favor of animal production, and even encourage it, as a part of larger agricultural systems due to the ability to use manure as the primary fertilizer source and the potential to encourage the use of perennial grasses and legumes that oth-erwise would not be converted to human food products, es-pecially on highly erodible or marginal lands (Sulc and Tracy, 2007). Opinions also vary about the types of animals that should be raised, with the argument for poultry and pork based on the better feed conversion efficiencies of these spe-cies compared to cattle (Smil, 2002b) and the argument for cattle based on their ability, as ruminants, to convert grasses and forages into human-consumable proteins from land that otherwise may not be productive (Castellano, 2010). These issues illustrate that an understanding of manure nutrient availability as compared to crop nutrient demands in a re-gion, i.e., a sense of the value of manure as waste or resource, could be useful for better understanding farmers’ percep-tions of manure and its potential environmental impacts.
Specifically, these issues have led many to question whether different agricultural areas have sufficient land to use the manure produced in areas where intensive animal production is prominent (Smil, 2002a), such as Iowa. An ag-gregated (statewide) analysis of crop and animal production in Iowa suggests that about 30% to 40% of the nitrogen and phosphorus requirements, and 50% of the potassium, for crop production could be supplied from manures and litters generated from livestock production. However, a more in-teresting question is how manure availability varies spatially throughout the state, i.e., are there areas where manure nu-trient production is greater than crop demand, and how has this varied temporally over the last 50 years? Thus, our ob-jective was to determine if animal production in Iowa is in-tensifying to such a degree that manure is viewed not as a
resource in certain areas but instead as a waste product that animal production facilities must dispose of, and to examine if or how this attitude has changed over time, i.e., are these issues becoming more frequent? In so doing, this work can be used to evaluate where manure treatment strategies that partition and remove nutrients may be most practical to im-plement (i.e., areas where manure nutrients cannot be used) and to identify locations where more animal production could be encouraged so that the manure byproducts can be used for crop production (i.e., to better integrate animal pro-duction systems and reduce reliance on synthetic fertilizers). Specifically, we (1) quantify the extent to which livestock production has become more concentrated by determining the production of animal manure and manure nutrients on a statewide and county basis, (2) quantify the extent to which the production of manure nutrients may exceed the capacity of cropland to assimilate the nutrients, (3) identify counties that are more likely to have animal waste utilization prob-lems and be in need of innovative manure treatment, and (4) quantify how these issues have evolved over time.
M
ATERIALS ANDM
ETHODSData from the USDA Census of Agriculture were used to make estimates of crop and livestock populations and pro-duction. This census of agricultural producers is conducted periodically (approximately every five years) by the USDA National Agricultural Statistics Service. Electronically pub-lished censuses (www.agcensus.usda.gov/Publications/in-dex.php) were used for data collection, including the cen-suses from 2012, 2007, 2002, 1997, 1992, 1987, 1982, 1978, 1974, 1969, 1964, 1959, 1954, 1950, 1945, 1940, 1935, 1930, and 1925. In the following sections, the method for estimating the nutrient assimilative capacity of cropland is described first, followed by the methods for estimating ani-mal production, manure production, and manure nutrient content. In addition to these data, crop production data were supplemented with data from the Iowa Agricultural Statis-tics, which are produced annually. This was done to provide a better picture of what the true nutrient utilization capacity was, as single-year production data are subject to the weather conditions of that specific year. In cases where classifica-tions of animals and crops varied slightly over the years, these distinctions and how these changes were handled are discussed individually for each animal type and, where ap-plicable, crop production type.
ESTIMATING THE NUTRIENT ASSIMILATIVE
CAPACITY OF CROPLAND
The assimilative capacity is an estimate of the amount of nutrients that can be applied to land available for manure ap-plication without building up nutrient levels in the soil over time, i.e., application at agronomic rates. Specifically, our definition only includes an estimate of the amounts of nutri-ents in the harvested portion of the grain and the removed biomass and therefore is a conservative estimate of the actual nutrient application required to support production. Some nutrient loss inevitably occurs after application due to any of the following: erosion, surface runoff, leaching, gaseous
60(5): 1669-1680 1671
emissions, fixation by the soil, and possibly the harvest of additional portions of the residue (for animal bedding or cel-lulosic ethanol production). The amount lost is variable and highly dependent on the nutrient of interest, the conditions of the field and soil, and the weather conditions during a par-ticular year. Accounting for these losses is difficult and be-yond the scope of this work, but these losses indicate that higher nutrient application levels would typically be re-quired to support the assimilative capacity. The calculated estimates of assimilative capacity include all farms, not just those with livestock, and these estimates are for the actual assimilative capacity during the census year, which is im-pacted by both the crop choice during the year and the grow-ing conditions specific to that year. This approach could pro-duce either a low or high estimate based on the growing con-ditions in that particular year. In general, this is not an issue of concern, as most census years are representative of crop production in the years immediately before and after the cen-sus year; however, crop yields in 2012 were reduced as com-pared to other recent years due to drought conditions preva-lent in much of the state.
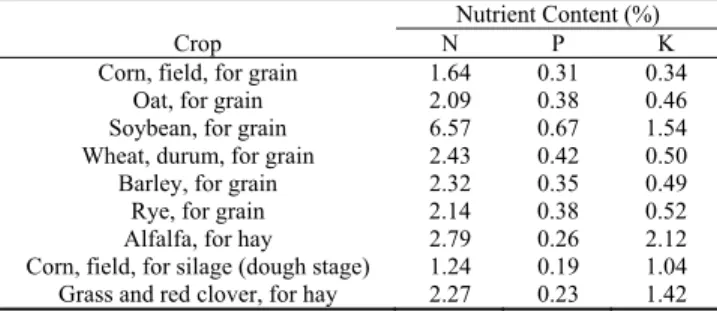
Estimates of the nitrogen, phosphorus, and potassium con-tents of crops (in kg per unit of crop yield) were obtained from the USDA-NRCS database (http://plants.usda.gov/npk/main), and the nutrient contents used are shown in table 1. These estimates were multiplied by the production (either in bush-els or metric tons) of each crop (corn grain, corn silage, soy-beans, alfalfa hay, other hay, oats, wheat, barley, and rye). In this analysis, we assumed that the nitrogen removed with soybeans and alfalfa hay was obtained entirely by nitrogen fixation, i.e., no manure nitrogen was used by these crops. This is a conservative estimate, as research has generally in-dicated that, if mineral nitrogen is present in the soil, the plant will use this nitrogen to support its growth and devel-opment. Moreover, the harvest of crop biomass (wheat, oat, barley, and rye straw, corn stover, and soybean residue) was not considered. In many areas, these residues are harvested for use as bedding material in animal operations; however, it was assumed that these residues are returned to the soil with ensuing manure application. The more recent use of corn stover to support bioethanol production was not considered.
ESTIMATING ANIMAL PRODUCTION
Data from the USDA Census of Agriculture were used to estimate livestock populations in each county. Unfortu-nately, the census does not report the average number of an-imals on a farm during the year, which is needed to estimate
manure nutrient production. However, the census typically reports inventory (population currently on hand) and sales data (sold at some point during the year) on the number of head of beef, dairy, swine, and poultry for the census year. These values were used to estimate livestock and poultry populations within the calendar year, which was the basis for estimating total manure production.
Swine (Hogs and Pigs)
Hog and pig production data were obtained from three categories in the Census of Agriculture: an end-of-year in-ventory of hogs and pigs used for breeding, an end-of-year inventory of other hogs and pigs, and the number of hogs and pigs sold in the calendar year. Using these numbers, we calculated the number of pig fattening spaces as the sum of the number of pigs sold plus the end-of-year inventory of other hogs and pigs divided by 3 (assuming 2.2 to 2.5 turns per year), following a procedure similar to that of Kellogg et al. (2000). A ratio of 20 sows to one boar was used to parti-tion the breeding stock into categories of boars and sows. In this analysis, we assumed a sow gestation period of 114 days and a farrowing/weaning period of 35 days (76.5% of time in gestation and 24.5% of time farrowing/weaning) to esti-mate manure production.
Prior to 1969, breeding stock inventory was not provided in the census. We assumed that breeding stock accounted for 14.7% of the total inventory for those earlier years, based on the ratio of breeding stock to total stock in the 1974 census. This ratio was used for every county, as we assumed that less county-to-county pig transfer occurred further back in his-tory (i.e., before 1969, most swine operations were farrow-to-finish, as compared to the specialized farms typical of the modern swine industry). Prior to 1964, only the number of pigs sold was provided. The current fattening inventory was estimated to be about 54.7% (based on the 1969 census) of that sold with breeding stock, which was still 14.7% of the total live inventory. Again, these estimates were used for each county.
Beef and Dairy Cattle
End-of-year beef and dairy cow numbers were provided in the census. These values were assumed to represent the average population of dairy and beef cows within each coun-try for that particular year. In many cases, the numbers of dairy and beef heifers were also provided. Sometimes this value was divided into two age categories (for animals less than one year old and more than one year old); however, this was not always this case. When these data were not broken down by age, it was assumed that half of the heifers were less than one year old, and the others were between one and two years old. If the number of replacement calves was not provided, it was estimated using the “other” cattle category provided by the census. This category includes steers, calves, and bulls. The number of steers was estimated as the number of cattle on feed, while the number of bulls was es-timated as 5% of the beef cow inventory. After subtracting these two values from “other” cattle category, the remainder was assumed to be replacement heifers. These were parti-tioned into beef and dairy replacements based on the per-centage of dairy and beef cows within the county during that census year. In estimating the average population of beef
Table 1. Nitrogen, phosphorus, and potassium contents of the harvested portion of crops based on the USDA-NRCS nutrient content database (http://plants.usda.gov/npk/main).
Crop
Nutrient Content (%)
N P K Corn, field, for grain 1.64 0.31 0.34
Oat, for grain 2.09 0.38 0.46 Soybean, for grain 6.57 0.67 1.54 Wheat, durum, for grain 2.43 0.42 0.50 Barley, for grain 2.32 0.35 0.49 Rye, for grain 2.14 0.38 0.52 Alfalfa, for hay 2.79 0.26 2.12 Corn, field, for silage (dough stage) 1.24 0.19 1.04 Grass and red clover, for hay 2.27 0.23 1.42
steers, the end-of-year inventory of cattle on feed and the number of cattle on feed sold were summed. This total was then divided by 3 to determine an average population (as-suming 2.2 grow-outs per year on a farm).
Poultry
The final animal category considered was poultry. We considered three types of poultry operations: turkeys, layers, and broilers. Turkeys were divided into those kept for laying (reproduction) and market turkeys. The population of laying turkeys was reported in the Census of Agriculture as the year-end inventory, and this population was assumed con-stant for the year. The number of turkeys sold and the current market inventory were reported. These two values were summed and divided by 3 (assuming three flocks per year) to determine the number of market turkey spaces in each county. We assumed that half of the market turkeys were hens and the other half were toms. The year-end inventory was provided for layers; again, this population was assumed constant throughout the year. Typically, only sales of broiler chickens were provided; this value was divided by 6 to de-termine the average broiler population during the given year, i.e., six turns of broilers produced per year. The year-end population of laying hens was provided in the census. We assumed that this value represented the average population for that year, i.e., that sales of laying hens were balanced with replacements.
ESTIMATING MANURE PRODUCTION AND
MANURE NUTRIENT CONTENT
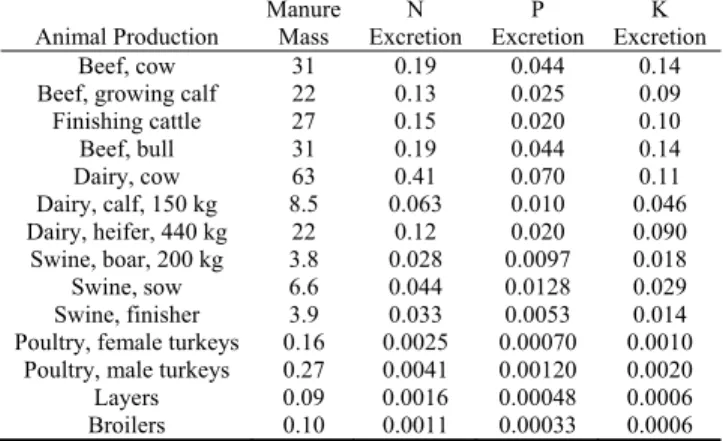
The quantity of manure was estimated on both an “as-ex-creted” and “as-applied” basis. The as-excreted value repre-sents the total mass of nutrients the animals excrete and does not account for the fraction that is not recoverable (e.g., if an animal spends time on pasture, the manure produced during this period cannot be collected). The as-applied value esti-mates the remaining nutrient content of the manure after storage and the percentage of the manure that is collected. The as-excreted estimate was calculated using the number of animal spaces and the types of animals produced in each county, as obtained from the Census of Agriculture (de-scribed in the previous section), and then using the ASABE manure production standard to estimate the quantity and nu-trient contents that individual animals contribute. In all cases, we used ASABE Standard D384.2 (ASABE, 2005) and converted manure and nutrient excretion rates into a per-day statistic (table 2).
In the case of beef production, animals were classified into four categories: beef cows, beef calves, finishing cattle, and bulls. Manure excretion values were referenced from ASABE Standard D384.2 for beef cows, finishing cattle, and growing calves, but not bulls. It was assumed that the excretion from beef bulls would be the same as that of beef cows. To deter-mine manure production from growing calves, the number of replacements less than one year of age was divided by 2 before multiplying by the manure production rate. This assumes that the birth of calves was uniformly distrib-uted throughout the year. No correction was made for replacement heifers over one year of age, as this value represents heifers that would
have been present on the farm every day of the year. Estimat-ing manure production from dairy cattle was done in a similar manner. We assumed that a cow would be lactating (in milk) for 305 days and dry the remaining 60 days of the year. Swine manure production estimates followed directly from the esti-mated animal numbers and the manure excretion rates pro-vided in table 2. Similarly, manure production estimates for layers and broilers followed from their estimated animal num-bers. Turkey manure production was based on an estimate that half of market turkeys were toms and the other half were hens, with manure excretion from laying turkeys assumed to occur at the rate of market turkey hens.
One concern with this methodology is that it assumes that the composition of as-excreted manure has not changed from 1924 through the present. At first glance, this assumption ap-pears reasonably acceptable, as authors such as Smil (2002b) have shown, using USDA data, that feed conversion effi-ciencies have remained relatively unchanged, with the ex-ception of meat birds such as broilers and turkeys. This sug-gests that assuming similar excreted manure composition is a reasonable initial estimate if diet remains constant. A sim-ilar sentiment was provided by Coffey (1996), who stated: “from a global perspective, swine production has not been a source of increased manure nutrient production,” and even suggested that improvements in nutrient use efficiency have reduced nutrient excretion on a per-pig basis. Specifically, Coffey (1996) stated that the feed conversion efficiency of grower-finisher pigs has improved from 4 kg of feed to less than 2.85 kg of feed per kg of weight gain in a top-producing pig herd, which would result in a nutrient excretion decrease of about 35%. However, animal diets have often changed dramatically over the last 100 years, often leading to signif-icant improvements in animal performance (i.e., growth rates). Much of this improvement in animal performance ap-pears to be due to changes in diet that increased the quantity of feed the animal consumed (i.e., the nutrient density of the feedstock). This change probably reduced the impact that feed efficiency improvements would have had on nutrient excretion, as the higher contribution from concentrated feed products often leads to over-feeding of N and P. More re-cently, improved understanding of the nutritional needs of animals and of the nutrients present in feed have allowed nu-tritionists to better balance feed rations. Innovations such as
Table 2. Manure and nutrient excretion rates based on ASABE Standard D384.2 (ASABE, 2005). All values are in kg head-1 d-1.
Animal Production Manure Mass N Excretion P Excretion K Excretion Beef, cow 31 0.19 0.044 0.14 Beef, growing calf 22 0.13 0.025 0.09
Finishing cattle 27 0.15 0.020 0.10 Beef, bull 31 0.19 0.044 0.14 Dairy, cow 63 0.41 0.070 0.11 Dairy, calf, 150 kg 8.5 0.063 0.010 0.046 Dairy, heifer, 440 kg 22 0.12 0.020 0.090 Swine, boar, 200 kg 3.8 0.028 0.0097 0.018 Swine, sow 6.6 0.044 0.0128 0.029 Swine, finisher 3.9 0.033 0.0053 0.014 Poultry, female turkeys 0.16 0.0025 0.00070 0.0010
Poultry, male turkeys 0.27 0.0041 0.00120 0.0020
Layers 0.09 0.0016 0.00048 0.0006 Broilers 0.10 0.0011 0.00033 0.0006
60(5): 1669-1680 1673
phase feeding, the incorporation of industrial amino acids to improve nitrogen retention, as well as the inclusion of the enzyme phytase to increase phosphorus digestion and reten-tion, have shown potential to further reduce nutrient excre-tion. However, additional changes, primarily driven by the availability of by-products such as distiller’s grains, have typically increased dietary crude protein and P concentra-tions, resulting in greater excretion. Similarly, larger animal sizes and finishing weights may have led to greater nutrient excretion. Given these changes in animal feeding practices, which could both reduce and increase the nutrient excretion from animals, we chose to assume that manure nutrient ex-cretion remained constant with time, as no clear directional trends could be determined.
A second analysis was conducted in which the manure was adjusted to an as-applied basis (i.e., after storage losses and application losses) and corrected for nutrient availabil-ity. This analysis assumed that swine manure was stored in deep pits, beef feeder cattle were raised on open feedlots, dairy farms used a slurry manure system, turkeys and broil-ers were raised on litter, and laybroil-ers were housed in high-rise facilities in which manure was collected below the cages and stored until land application. This analysis also assumed that beef cows, calves, and bulls were raised on a mixture of open lots (30% of the time) and pasture (70% of the time), dairy calves and yearlings were on lots all the time, and swine boar and sow housing used pit manure storage systems. These systems were selected because they represent the current dominant manure storage systems within each industry. One limitation was that housing and manure storage systems were not reported; therefore, historical nutrient losses were not adjusted to account for different management practices, although a larger percentage of time was spent on pasture or in systems with higher nutrient losses (lagoons rather than deep pits), and a far greater percentage of applied manure was injected or immediately incorporated.
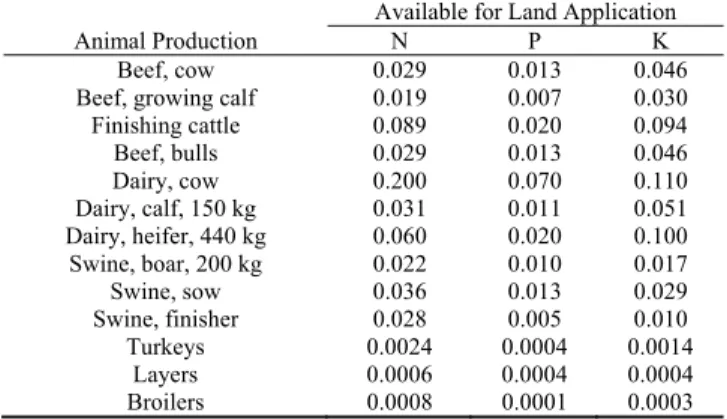
The first step in estimating manure production and nutri-ent contnutri-ent was to correct for nutrinutri-ent changes during stor-age. Where possible, data from table 19 of ASABE Standard D384.2 (ASABE, 2005) were used to determine the N, P, and K contents of manure and multiplied by the mass of ma-nure expected to determine the N, P, and K available for land application. In some cases, these estimates were not possi-ble, as no data were available for beef cows, growing calves, bulls, dairy heifers and yearlings, nor for swine sows and boars. In these cases, nutrient losses were estimated (table 3) based on the Midwest Plan Service Livestock Waste Facili-ties Handbook (MWPS, 1993). For instance, because we as-sumed that beef cows, calves, and bulls as well as dairy heif-ers and yearlings were raised on lots, their manures would have the same nutrient losses, as this estimate was based on the production system rather than the animal type (this as-sumption does not account for the fact that beef cows, calves, and bulls were on the lot only 30% of the time, which re-quired additional correction for manure collection).
A similar approach was followed for swine sows and boars, assuming their manures would have nutrient losses typical of deep pit storage systems. The nutrient loss was then multiplied by the daily excretion value and the percent-age of manure that would be captured to estimate the
amounts available for land application (table 4). Nutrient availability was estimated based on procedures recom-mended by Sawyer and Mallarino (2008), who suggested that all P and K would be available (depending on soil test conditions) and that 50% of the N in dairy and beef cattle manure (sum of three-year availability: 35%, 10%, and 5% availabilities in the first, second, and third years, respec-tively, which takes nitrogen credits for subsequent years), 100% of the N in swine manure (100% in first year), and 60% of the N in poultry litter (55% and 5% in the first and second years, respectively) would be available.
Animal housing systems have evolved over time; thus, our assumptions for the years prior to 1974, when rapid in-stallation of animal confinement operations was occurring, may be questionable. Given the significant changes in ani-mal housing and manure management practices that have oc-curred since the 1920s, the percentage of manure that can be captured would have changed drastically as operations evolved from pasture to confinement facilities. Along with these changes in animal housing, manure storage systems have also evolved. An example of this evolution is the wide use of pasture systems in both dairy and open lot swine fa-cilities prior to the 1960s, which would have significantly reduced the percentage of recoverable manure. Additionally, alternative manure management systems would have im-pacted the nutrient losses incurred before application as well as the nutrient losses during application (such as the change to injection application equipment).
R
ESULTS ANDD
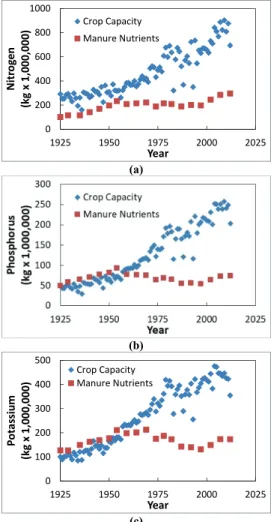
ISCUSSIONThe first part of this analysis focused on how manure nu-trient availability and crop nunu-trient demand have changed over time in Iowa (fig. 1). Crop nutrient demand has in-creased greatly since 1924. The demand inin-creased approxi-mately linearly until around the 1960s, when the demand for nutrients in crop production increased rapidly. The demand continued to increase rapidly until around 1980, after which
Table 3. Manure mass and nutrient losses during storage.
Animal Production
Loss during Storage (%) TKN P K Open lot
(beef cows, calves, and bulls and dairy calves)
50 1 10
Swine (boars and sows)
20 0 0
Table 4. Nutrient values after storage. All values are in kg head-1 d-1.
Animal Production
Available for Land Application
N P K Beef, cow 0.029 0.013 0.046 Beef, growing calf 0.019 0.007 0.030
Finishing cattle 0.089 0.020 0.094 Beef, bulls 0.029 0.013 0.046 Dairy, cow 0.200 0.070 0.110 Dairy, calf, 150 kg 0.031 0.011 0.051 Dairy, heifer, 440 kg 0.060 0.020 0.100 Swine, boar, 200 kg 0.022 0.010 0.017 Swine, sow 0.036 0.013 0.029 Swine, finisher 0.028 0.005 0.010 Turkeys 0.0024 0.0004 0.0014 Layers 0.0006 0.0004 0.0004 Broilers 0.0008 0.0001 0.0003
it remained steady for approximately 20 years. Starting in the early 2000s, the nutrient demand again showed a steady increase. There were four years in which extreme weather conditions impacted nutrient utilization data for crops (1983, 1988, 1993, and 2012); in all cases, nutrient utilization was greatly reduced. In three of these years, the reduced yields were due to drought (1983, 1988, and 2012) throughout much of the state. The reduced yield in 1993 was due to flooding. Similarly, reduced nutrient demands occurred in 1934 and 1935 (due to drought) and in 1947 and 1956. How-ever, nutrient utilization was much more volatile during the more recent adverse growing years than in the pre-1970s years. This was most likely due to the loss of crop diversity, making nutrient demand much more dependent on a few crops (fig. 2) and therefore more sensitive to how crops re-sponded to the weather during critical periods, such as plant-ing, pollination, and grain fill. Historically, roughly 50% of nitrogen demand was from corn production; however, corn now accounts for more than 90% of nitrogen demand. Simi-lar trends were seen for phosphorus and potassium demand; however, demand for these nutrients is now dominated by both corn and soybean production. Most pronounced is the disappearance of small grains and hay, as their production was replaced with soybean in rotations.
Manure production throughout the years has been much less variable, but there has been a slow and steady climb in available nitrogen. In general, we estimated that the nitrogen available from manure has always been below the crop nu-trient demand. However, due to the greatly increased crop demand, manure nitrogen now provides a lower percentage of the nitrogen requirement than ever before. Similarly, the phosphorus and potassium available from manure have also increased, but they also provide a lower percentage of the nutrient demand required to support crop growth than at any time in recent history. As can be seen in figures 1b and 1c, prior to 1970, phosphorus and potassium availability in ma-nures was actually greater than that needed for crop produc-tion. The generation of manure nutrients in excess of esti-mated crop capacity could be explained in several ways, in-cluding the import of additional feeds not included in the analysis or from other regions, or as an indication that the assumed time spent on pasture and the manure capture effi-ciency were not appropriate for those earlier years when pro-duction systems were vastly different. Alternatively, the
(a)
(b)
(c)
Figure 1. Trends in crop nutrient utilization capacity and manure nu-trients available for land application for (a) nitrogen, (b) phosphorus, and (c) potassium in Iowa.
(a)
(b)
(c)
Figure 2. Estimated requirements of (a) nitrogen, (b) phosphorus, and (c) potassium for corn, soybean, small grains, and hay in Iowa.
0 200 400 600 800 1000 1925 1950 1975 2000 2025 Nitr o gen (k g x 1,0 0 0, 000) Year Crop Capacity Manure Nutrients 0 100 200 300 400 500 1925 1950 1975 2000 2025 Po ta ss iu m (kg x 1,0 00, 000) Year Crop Capacity Manure Nutrients 0% 20% 40% 60% 80% 100% 19 25 19 30 19 35 19 40 19 45 19 50 19 55 19 60 19 65 19 70 19 75 19 80 19 85 19 90 19 95 20 00 20 05 20 10 % o f N R equ ir ed Year
Corn Soybean Small Grain Hay
0% 20% 40% 60% 80% 100% 19 25 19 30 19 35 19 40 19 45 19 50 19 55 19 60 19 65 19 70 19 75 19 80 19 85 19 90 19 95 20 00 20 05 20 10 % o f P Re q u ir ed Year
Corn Soybean Small Grain Hay
0% 20% 40% 60% 80% 100% 19 25 19 30 19 35 19 40 19 45 19 50 19 55 19 60 19 65 19 70 19 75 19 80 19 85 19 90 19 95 20 00 20 05 20 10 % o f K Re q u ir ed Year
60(5): 1669-1680 1675
generation of manure nutrients in excess of crop capacity could indicate that manure nutrient excretion in these earlier years was lower, as animal diets did not contain nearly as many concentrates. Also of note is how the contribution of available nutrients from different animal species has changed over time (fig. 3). Dairy has consistently been de-clining, while beef peaked in the 1970s and has since been on the decline. Thus, swine and broiler manures now account for a greater proportion of the total manure nutrients.
These changes in crop nutrient demand and in the types of manure produced are presumably interrelated. The reduc-tion in cattle producreduc-tion, both beef and dairy, has resulted in reduced need for grasses and alfalfa forages. Likewise, the increases in swine and broiler production have resulted in a greater demand for high-value feeds like corn and soybean. Moreover, changes in animal housing have reduced the need for animal bedding material (potentially reducing the need for small grains) and resulted in the collection of a greater fraction of the produced manure.
Our second question focused on the county-level distri-bution of nutrients and how this distridistri-bution has changed over time. This analysis was performed to evaluate if animal operations are congregating in specific regions within Iowa, leading to an abundant supply of manure nutrients in certain areas. If so, this would result in the view of manure as a waste product in some areas, while manure would still be considered a resource at the state level. For each of the three nutrients of interest (nitrogen, phosphorus, and potassium), this analysis was performed for the census years 1974, 1978, 1982, 1987, 1992, 1997, 2002, 2007, and 2012. In the ac-companying state maps, each county is color-coded for each year: counties that obtained the least (0% to 10%) of their required nutrient supply from manure are shown in dark green; as a progressively greater percentage of nutrients could be supplied by the manure nutrients available within the county, the color changes to lighter greens, and then yel-low (60% to 70%), and eventually dark red (greater than 100% of required nutrient potentially available from ma-nures).
In general, similar trends were seen for nitrogen, phos-phorus, and potassium. Counties in the northwest region be-came progressively richer in manure nutrients in comparison to their crop nutrient demands, with Washington County in southeastern Iowa standing out as a county that obtained a large percentage of its nutrient needs from manure. In con-trast, many other counties, specifically those along the south-ern portion of the Missouri River and around Des Moines, obtained smaller percentages of their nutrients from manure. In general, these differences were caused not so much by the agricultural practices that vary from county to county but rather by the extent of livestock production in the region. A few distinct agricultural regions in Iowa may be of particular interest (fig. 4). The Des Moines Lobe, in north central Iowa and extending down to central Iowa, is characterized by high levels of row-crop corn and soybean production, intensive tile drainage systems, and often has high levels of finishing swine and layer production. The Northwest Iowa Plains, consisting of approximately six counties, is characterized by large numbers of finishing pigs, feedlot cattle, a growing dairy industry, turkey and layer production, and high pro-duction of corn and soybeans. Western Iowa along the Mis-souri River consists of alluvial plains and is characterized by lower levels of animal production but high levels of crop production. Just to the east of this area is a row of counties in the Loess Hills region, renowned for its highly productive soils that support large amounts of corn production as well as high numbers of pigs and finishing cattle. In northeast Iowa, the Iowan Surface is home to highly productive soils for corn and soybean and an assortment of livestock, pre-dominately swine production. In the Paleozoic Plateau, there are generally thinner soils, more topographical relief, and as a result more pasture ground and a greater diversity of crop-ping systems. This region has seen the persistence of a large cow-calf industry, a dairy industry that still supports numer-ous smaller farms, and a growing presence of swine and poultry industries. In eastern Iowa, the Southern Iowa Drift Plain and the Mississippi Alluvial Plain both have highly productive cropping soils with large fields of soybean and corn. Animal agriculture in these regions is heavily focused
(a)
(b)
(c)
Figure 3. Estimated percentage of manure (a) nitrogen, (b) phosphorus, and (c) potassium produced by beef, swine, dairy, and poultry by year in Iowa animal agriculture.
0% 20% 40% 60% 80% 100% 19 25 19 29 19 35 19 40 19 45 19 50 19 54 19 59 19 64 19 69 19 74 19 78 19 82 19 87 19 92 19 97 20 02 20 07 20 12 % of Ma n u re N it rog en Year
Beef Swine Dairy Poultry
0% 20% 40% 60% 80% 100% 19 25 19 29 19 35 19 40 19 45 19 50 19 54 19 59 19 64 19 69 19 74 19 78 19 82 19 87 19 92 19 97 20 02 20 07 20 12 % of Ma nur e Ph os p h o rus Year
Beef Swine Dairy Poultry
0% 20% 40% 60% 80% 100% 19 25 19 29 19 35 19 40 19 45 19 50 19 54 19 59 19 64 19 69 19 74 19 78 19 82 19 87 19 92 19 97 20 02 20 07 20 12 % o f M a n u re P o ta ss iu m Year
on pigs, but there are also numerous dairies, cow-calf pas-tures, and finishing cattle. Finishing cattle in this region are more likely to be housed in monoslope barns with pits or bedded packs than in other regions, but open lot facilities predominate. Finally, the Southern Iowa Drift Plain in south central Iowa has some of the lower-productivity soils, with more pasture land, a thriving cow-calf industry, and a strong
swine industry, especially in farrowing and gestation barns, but it has recently seen an increasing number of finishing barns, especially on the eastern and western edges of the re-gion.
The nitrogen maps (fig. 5) show that about 13 counties could obtain more than 70% of their required nitrogen from manures in the early 1970s, with only the Des Moines Lobe (in the north central part of the state) routinely obtaining less than 50% of the required nutrients potentially from animal manure. In the next census, the percentages of nutrients sup-plied for crop production dropped quickly in all other areas of the state. This shift was driven in large part by increases in crop production, especially corn yields. As nutrient de-mand continued to grow, the percentage of nitrogen that could be supplied by manures decreased; by 1992, only three counties (Sioux, Washington, and Dubuque) were estimated to be able to obtain more than 40% of their required nitrogen from manures. However, at that time, pronounced differ-ences started to develop throughout the state, and the north-west corner of Iowa appears to have more manure nitrogen than may be needed to replace the estimated crop removal. However, eight counties can obtain less than 10% of their required nitrogen from manures. This illustrates how the
Figure 4. Landform regions of Iowa.
1974 1978 1982
1987 1992 1997
2002 2007 2012 Figure 5. Ratios of manure nitrogen available for land application to crop nitrogen demand by county. Darker green indicates that a lower
percentage of nitrogen could be provided by manures. Colors become lighter green, yellow, and eventually red as a larger fraction of nitrogen can be obtained from manures. Color categories are 0% to 10%, 10% to 20%, 20% to 30%, 30% to 40%, 40% to 50%, 50% to 60%, 60% to 70%, 70% to 80%, 80% to 90%, 90% to 100%, and >100%.
60(5): 1669-1680 1677
concentration of animals and the separation of animal pro-duction from crop propro-duction were becoming more promi-nent in Iowa. In addition, the disappearance or reduction in the availability of animal manures occurred in numerous other counties, indicating increased reliance on mineral fer-tilizers in some areas.
The estimates created in this study can be contrasted with those generated by Kellogg et al. (2000) for 1982 and 1997. Based on the work by Kellogg et al. (2000), no county in Iowa received more than 25% of its nitrogen assimilative ca-pacity from manure. This is in contrast to the estimates in this study, in which 55 counties exceeded this threshold. Similarly, for 1997, Kellogg et al. (2000) estimated that no Iowa counties exceeded the 25% threshold for manure nutri-ents, while in the present study approximately 20 counties exceeded this threshold. These differences are substantial and are largely driven by differences in methodology for es-timating nutrient availability after manure storage. There is large variation in nutrient losses during storage, even for similar storages, and higher losses from different types of storages. In particular, we estimated nitrogen losses in deep pit storages of approximately 15%, which is in line with cur-rent suggestions from Midwest Plan Service references, whereas Kellogg et al. (2000) suggested nitrogen losses of
approximately 75%, which is a loss level more typical of la-goons. Similar to our approach, Kellogg et al. (2000) tried to choose representative systems for each livestock type. How-ever, because they were working at the national level, they chose practices more typical of the overall industry, whereas our method was tailored to the Midwestern Corn Belt, par-ticularly Iowa.
Similar trends were seen for phosphorus (fig. 6) and po-tassium (fig. 7). In the first year (1974), the Des Moines Lobe was evident, as these counties were able to obtain a significantly smaller fraction of their required phosphorus from manures than the rest of the state. At this time, many counties (especially those along the Mississippi and Mis-souri Rivers and in south central Iowa) were phosphorus en-riched, with most of these counties able to obtain more than 60% of the required phosphorus from manures. By 2012, only eight counties (Lyon, Sioux, Plymouth, Hamilton, Un-ion, Clarke, Washington, and Davis) could obtain more than 60% of their required phosphorus from manures, while 14 counties obtained less than 10% of the estimated phos-phorus removed by crop production through the recycling of manures. These figures clearly illustrate that the increase in crop production made manure phosphorus a smaller percent-age of the fertility that is consumed by crops, but manure
1974 1978 1982
1987 1992 1997
2002 2007 2012 Figure 6. Ratio of manure phosphorus available for land application to crop phosphorus demand by county. Darker green indicates that a lower
percentage of phosphorus could be provided by manures. Colors become lighter green, yellow, and eventually red as a larger fraction of nitrogen can be obtained from manures. Color categories are 0% to 10%, 10% to 20%, 20% to 30%, 30% to 40%, 40% to 50%, 50% to 60%, 60% to 70%, 70% to 80%, 80% to 90%, 90% to 100%, and >100%.
outputs approached crop phosphorus demands in a few select counties.
Once again, some insight can be gained by comparing the estimates generated here with those of Kellogg et al. (2000) for the years 1982 and 1997. In this case, Kellogg et al. (2000) estimated that two counties exceeded 50% of the phosphorus utilization capacity, while we estimated nine counties. Overall, Kellogg et al. (2000) estimated that 33 counties obtained more than 25% of their phosphorus from manures, while we estimated 58 counties. For 1997, Kellogg et al. (2000) estimated that three counties obtained more than 50% of their phosphorus from manures, and 24 counties obtained more than 25% of their phosphorus from manures, while we estimated 10 and 23 counties, re-spectively. Our estimates tended to be higher than those of Kellogg et al. (2000), but our trends were similar, with the differences again driven by differences in manure availabil-ity estimates and, in this case, manure collection efficiency related to the amount of time spent on pasture. Overall, these differences illustrate how assumptions about nutrient losses during storage and land application impact the estimates, but the overall trends are consistent. Moreover, the changes in the estimated nitrogen and phosphorus losses during storage and land application, from the high losses of 75% and 15%,
respectively, for N and P reported by Kellogg et al. (2000) to the losses of 15% and 1% in this study, show how farmers have modified their practices to better capture the potential fertility value of manure, which has had a drastic impact on nutrient budgets.
For potassium, similar patterns emerged with time and lo-cation as for the other nutrients. However, in some lolo-cations, the availability of excess potassium still exists. Despite this, potassium tends to receive far less attention, as it is generally considered to have minimal impact on water quality. How-ever, from a fertility perspective, it is important to determine how manures can provide crop nutrients, and to determine if Iowa farms could obtain value from the potassium applied with livestock manure.
These results have several implications for agriculture, particularly animal agriculture, in Iowa. This analysis has re-vealed several interesting trends. On a statewide basis, the percentages of nutrients potentially supplied by manures has steadily decreased, from 50% of nitrogen in 1925 to 30% in 2012, and from 100% of phosphorus and potassium in 1925 to 35% and 50% of P and K, respectively, in 2012. However, the results for any particular county can differ drastically from the statewide averages. In terms of statewide nutrient requirements, increases in crop production and changes in
1974 1978 1982
1987 1992 1997
2002 2007 2012 Figure 7. Ratio of manure potassium available for land application to crop potassium demand by county. Darker green indicates that a lower
percentage of potassium could be provided by manures. Colors become lighter green, yellow, and eventually red as a larger fraction of nitrogen can be obtained from manures. Color categories are 0% to 10%, 10% to 20%, 20% to 30%, 30% to 40%, 40% to 50%, 50% to 60%, 60% to 70%, 70% to 80%, 80% to 90%, 90% to 100%, and >100%.
60(5): 1669-1680 1679
cropping systems have increased the requirements for nitro-gen, phosphorus, and potassium by 3 to 6 times the 1925 ca-pacity, but these change have also altered the land use from small grains and perennial hays to a landscape focused on row-crop production. Similarly, the types and numbers of animals have changed, but over the period of this study ma-nure nutrient outputs have only increased by 1.5 to 2.5 times. In particular, increased production of swine as compared to cattle has led to greater increases in nitrogen available for land application than phosphorus, resulting in manure that is more closely aligned with crop nutrient needs. For example, crop rotations in 1925 resulted in N: P ratios of 6:1, while crop rotations in 2012 resulted in N:P ratios of 3.6:1. In terms of manure production during these times, the ratio changed from 2:1 to 3.6:1. This indicates that the changes in crop rotations and animal production have resulted in ma-nure that is much more balanced to the statewide nutrient needs.
Overall, these changes are positive and indicate that ma-nure is a more valuable addition to Iowa agriculture than it has been in the past, as it has never supplied a lower percent-age of the state’s fertility needs and it has become more bal-anced to the crop requirements. However, the spatial county-by-county mapping indicates that these positive changes are not the complete story. While the majority of Iowa counties have sufficient capacity to use all their manure nutrients ef-fectively, several counties have become progressively ma-nure-rich and may have to consider manure treatment tech-nologies to remove excess nutrients or, more preferably, consider separation technologies that allow export of the ex-cess nutrients to other counties, where the nutrients can be used for crop production.
Future work should consider methods to encourage ani-mal production in regions where low percentages of crop nu-trients are supplied by manure and to develop procedures to limit further increases in areas that are already manure-rich, unless crop capacity continues to increase. Additionally, alt-hough this work demonstrates the capacity to use manure nutrients produced at the county level, future work needs to consider the individual farm level and evaluate the econom-ics of manure transport to determine how production prac-tices could be modified to support such developments. Alt-hough sufficient capacity is an indicator that sound manage-ment is possible, it does not guarantee that the manure nutri-ents are being effectively used. Farm-level economic analy-sis should be conducted to better understand manure man-agement decisions, help farmers determine when manure ex-port is necessary, and identify the best methods to make ma-nure transport cost-effective.
C
ONCLUSIONSThe historic trends in manure nutrient availability in com-parison to crop nutrient demand indicate that nutrient assim-ilative capacity still far exceeds nutrient availability from manures in most areas of Iowa. However, there is evidence that animal production is concentrating in specific regions and, as a result, becoming separated from crop production.
These trends also indicate that opportunities for nutrient re-covery and separation systems are starting to appear. Several areas are seeing increased availability of manure nutrients and are nearing ratios at which manure nutrient export from the county will be required to maintain nutrient balance. The spatiotemporal patterns of manure nutrient variability rela-tive to crop capacity are critical for identifying regions with potential environmental issues associated with livestock farming.
Similarly, manure nutrients are desirable in many areas in Iowa, as many counties are currently mining soil nutrient re-serves or becoming more reliant on mineral fertilizers to meet crop nutrient needs. Identification of these locations helps identify where additional capacity exists to use animal manure nutrients for crop production, and siting of future animal pro-duction facilities in these areas may provide a competitive ad-vantage, as the manure could be a viable fertilizer resource.
Moreover, areas of high manure nutrient availability may indicate that manure nutrient separation and nutrient recov-ery systems could be beneficial, if they are economical. Nu-trient recovery systems could provide opportunities to redis-tribute manure nutrients across the state, from manure-rich counties to manure-poor counties. If current livestock pro-duction trends continue, developing these manure nutrient separation technologies will limit the impact of nutrient im-balances created by the separation of crop and livestock pro-duction and take advantage of the nutrient resources that ma-nure provides.
R
EFERENCESAlexander, R. B., Smith, R. A., Schwarz, G. E., Boyer, E. W., Nolan, J. V., & Brakebill, J. W. (2008). Differences in phosphorus and nitrogen delivery to the Gulf of Mexico from the Mississippi River basin. Environ. Sci. Tech., 42(3), 822-830. https://doi.org/10.1021/es0716103
ASABE. (2005). D384.2: Manure production and characteristics. St. Joseph, MI: ASABE.
Castellano, M. J. (2010). Shifting human diets and agricultural nutrient management. J. Soil Water Cons., 65(3), 63A-66A. https://doi.org/10.2489/jswc.65.3.63A
Coffey, M. T. (1996). Environmental challenges as related to animal agriculture: Swine. In E. T. Kornegay (Ed.), Nutrient
management of food animals to enhance and protect the environment (pp. 29-39). Boca Raton, FL: CRC Press. Cooperband, L. R., & Good, L. W. (2002). Biogenic phosphate
minerals in manure: Implications for phosphorus loss to surface waters. Environ. Sci. Tech., 36(23), 5075-5082.
https://doi.org/10.1021/es025755f
Dawson, C. J., & Hilton, J. (2011). Fertiliser availability in a resource-limited world: Production and recycling of nitrogen and phosphorus. Food Policy, 36(supp. 1), S14-S22. http://dx.doi.org/10.1016/j.foodpol.2010.11.012
Drinkwater, L. E., Wagoner, P., & Sarrantonio, M. (1998). Legume-based cropping systems have reduced carbon and nitrogen losses. Nature, 396(6708), 262-265.
https://doi.org/10.1038/24376
Hadrich, J. C., Harrigan, T. M., & Wolf, C. A. (2010). Economic comparison of liquid manure transport and land application.
Appl. Eng. Agric., 26(5), 743-758. https://doi.org/10.13031/2013.34939
Challenges of managing liquid swine manure. Appl. Eng. Agric., 20(5), 693-699. https://doi.org/10.13031/2013.17460
Kellogg, R. L., Lander, C. H., Moffitt, D. C., & Gollehon, N. (2000). Manure nutrients relative to the capacity of cropland and pastureland to assimilate nutrients: Spatial and temporal trends for the United States. Washington, DC: USDA Natural Resources Conservation Service. Retrieved from
https://www.nrcs.usda.gov/Internet/FSE_DOCUMENTS/nrcs14 3_012133.pdf
MWPS. (1993). Livestock waste facilities handbook. Ames, IA: Midwest Plan Service.
Naylor, R., Steinfeld, H., Falcon, W., Galloway, J., Smil, V., Bradford, E., ... Mooney, H. (2005). Losing the links between livestock and land. Science, 310(5754), 1621-1622.
https://doi.org/10.1126/science.1117856
Sawyer, J., & Mallarino, A. (2008). Using manure nutrients for crop production. PMR 1003. Ames, IA: Iowa State University. Smil, V. (2002a). Nitrogen and food production: Proteins for human
diets. AMBIO, 31(2), 126-131. https://doi.org/10.1579/0044-7447-31.2.126
Smil, V. (2002b). Worldwide transformation of diets, burdens of meat production, and opportunities for novel food proteins.
Enzyme Microb. Tech., 30(3), 305-311.
http://dx.doi.org/10.1016/S0141-0229(01)00504-X
Steinfeld, H., Gerber, P., Wassenaar, T. D., Castel, V., & de Haan, C. (2006). Livestock’s long shadow: Environmental issues and options. Rome, Italy: United Nations FAO.
Sulc, R. M., & Tracy, B. F. (2007). Integrated crop-livestock systems in the U.S. Corn Belt. Agron. J., 99(2), 335-345. https://doi.org/10.2134/agronj2006.0086
Yang, Q., Tian, H., Li, X., Ren, W., Zhang, B., Zhang, X., & Wolf, J. (2016). Spatiotemporal patterns of livestock manure nutrient production in the conterminous United States from 1930 to 2012. Sci. Total Environ., 541, 1592-1602.