Management and financial performance of agricultural cooperatives…(p.225-249) 225
REVESCO Nº 123 - Primer Cuatrimestre 2017 - ISSN: 1885-8031 - www.ucm.es/info/revesco
http://dx.doi.org/10.5209/REVE.53243 Fecha de recepción: 03/06/2015 Fecha de aceptación: 09/05/2016
MANAGEMENT AND FINANCIAL PERFORMANCE OF
AGRICULTURAL COOPERATIVES: A CASE OF PORTUGUESE
OLIVE OIL COOPERATIVES
1POR
João Fernandes REBELO, Carmem Teresa LEAL y
Ânia TEIXEIRA2
RESUMEN
En Portugal, como en otros países, las cooperativas agrícolas tienen un papel económico importante en el sistema alimentario. Similar a otras organizaciones económicas, las cooperativas agrícolas han sido testigos de cambios estructurales en las últimas décadas en términos de modelos de gobernación y gestión. Las cooperativas agrícolas portuguesas se han visto constreñidas por su contexto a adoptar un modelo tradicional de propiedad y control. El objetivo principal de este estudio era analizar cuestiones relacionadas con la estructura de gestión y desempeño financiero de las cooperativas, basada en los datos recogidos de cooperativas de aceite de oliva situadas en la región interior norte de Portugal. La combinación de un análisis cualitativo de la estructura y toma de decisiones, una evaluación financiera y la aplicación de un enfoque en varios criterios (PROMETHEE II), los resultados están en línea con expectativas (por ejemplo, bajos niveles de participación de los miembros, gestión no profesional, ratios de rentabilidad bajos, bajo apalancamiento y una capacidad para cumplir compromisos financieros), excepto la relación entre la gestión profesional y el desempeño financiero. La existencia de gestión profesional no conduce a mejores resultados financieros. Este resultado refuerza la creencia de que las cooperativas que están estructuradas de diferente manera tienen intereses diferentes y contradictorios a las partes interesadas.
1 This work is supported by: European and Structural and Investment Funds in the FEDER component, through
the Operational Competitiveness and Internationalization Programme (COMPETE 2020)[Project No 006971 (UIC/SOC/04011)]; and national funds, through the FCT – Portuguese Foundation for Science and Technology under the UID/SOC/04011/2013.
The article benefits from the comments of two anonymous. The usual disclaimers apply.
Palabras clave: cooperativismo, finanzas corporativas, indicadores económicos y financieros, análisis multicriterio PROMETHEE.
Claves Econlit: D23, G32; J54; L20; P13.
ABSTRACT
In Portugal, as in other countries, agricultural cooperatives have an important economic role in the food system. Similar to other economic organisations, agricultural cooperatives have witnessed structural changes in recent decades in terms of governance and/or management models. Portuguese agricultural cooperatives have been compelled by their context to adopt a traditional model of ownership and control. The main goal of this study was to analyse issues related to the management structure and financial performance of cooperatives, based on data collected for olive oil cooperatives located in the northern interior region of Portugal. Combining a qualitative analysis of structure and decision-making, a financial assessment and the application of a multi-criteria approach (PROMETHEE II), the overall results are in line with expectations (e.g. low levels of member participation, non-professional management, low profitability ratios, low leverage and an ability to fulfil financial commitments), except for the relationship between professional management and financial performance. The existence of professional management does not lead to better financial performance. This result reinforces the belief that cooperatives that are structured differently have different and conflicting stakeholder interests.
Keywords: Traditional cooperatives, governance, financial indicators, PROMETHEE multi-criteria approach.
1. INTRODUCTION
Agricultural cooperatives have an important economic role in the European Union (EU) food system. At the end of the first decade of the twenty-first century, 54% of EU farmers were members of agricultural cooperatives. There were 38,000 agricultural cooperatives, and these held a 60% market share in the collecting, processing and marketing of agricultural products. Cooperatives provided 50% of the supply of agricultural factors of production, with 660,000 people employed by cooperatives in this area of activity and a total turnover of €251 billion (Santos, 2013). In the case of Portugal, detailed information about the quantity of agricultural raw materials marketed through cooperatives is scarce (COGECA,
Management and financial performance of agricultural cooperatives…(p.225-249) 227
REVESCO Nº 123 - Primer Cuatrimestre 2017 - ISSN: 1885-8031 - www.ucm.es/info/revesco
2010). However, it is clear that cooperatives have an important role in dairy (i.e. milk), wine, olive oil and fruit and vegetables food chains, with a market share, in 2009, of 70%, 42%, 30% and 25%, respectively (Rebelo & Caldas, 2012; 2015).
Most Portuguese olive oil cooperatives were founded during the 1960s, in a top-down process created to address problems in processing, stocking and marketing. These cooperatives are legally organised following traditional cooperative principles: open membership, democratic control, restricted residual claim and benefits proportional to members and patronage. Portuguese cooperatives have poorly defined property rights and, consequently, difficulties in assuming the risk of investments that could add value in the medium and long term (Rebelo& Caldas, 2015).
The Azeite de Trás-os-Montes protected designation of origin (PDO) olive oil cooperatives (Teixeira, 2014) are a good example of the cooperative model adopted by Portuguese agricultural cooperatives, even when issues related to governance model and financial performance are taken into account. Therefore, this study sought to identify the organisational structure of the olive oil cooperatives of the Azeite de Trás-os-Montes PDO and to understand the influence of management – professional or non-professional – upon their financial performance. In order to achieve the main goal of the study, the following specific objectives were identified: (i) analyse the management structure of the selected cooperatives; (ii) examine the financial performance of the cooperatives; (iii) determine whether a relationship exists between financial performance and the presence of a professional manager.
In order to achieve these objectives, interviews of board of director (BoD) members were conducted and firm documents analysed, including bylaws, annual reports and financial statements. Because of the multidimensional nature of the data, both qualitative and multi-criteria approaches were used.
This paper is organised as follows. Section 2 includes a brief discussion of agricultural cooperative organisational models and financial performance. In section 3, the multi-criteria PROMETHEE method is explained. The remaining sections include the results (i.e. section 4) and the most relevant conclusions (i.e. section 5).
2. AGRICULTURAL COOPERATIVE ORGANISATIONAL MODELS AND FINANCIAL PERFORMANCE
The economic justification of agricultural cooperatives can be found at the level of member farms. Independent of their organisational model and sector, agricultural cooperatives are successful if they provide a higher net benefit to their members (e.g. final price of the product delivered, time of receipt, provided runoff and risk sharing) than that which members could achieved individually or outside their cooperative. As the main suppliers both of raw material and equity, members also decide on their cooperative’s retained earnings, investments and the final prices of farmers’ output. However, since the price of the raw materials is correlated with retained surplus and because the price of farm products delivered by members represents an important cost to the cooperative, accounting profit or ratio of profitability is not an adequate measure of this type of organisation’s performance (Soboh, Lansink, Giesen & Van Dijk, 2009).
Independent of how performance is measured, the financial sustainability of organisations clearly relies on their ability to create enough return in order to keep production processes running, compensating appropriately for the cost of factors of production. Organisations require resources to enable them to pursue their activities (Léon, 2001).
In the case of cooperatives, financial performance can be affected by issues related to ownership and the use of property rights. The type of ownership – expressed through the structure of property rights and governance – and, in particular, managerial duties delegated to professional managers and/or full-time directors are perhaps the best tools to analyse the incentives for farmer members of cooperatives to create, maintain and improve their assets. Analyses of ownership focus on two distinct concepts (Chaddad & Iliopoulos, 2013): residual returns or claims and residual control.3
Drawing from property rights theory, Chaddad and Cook (2004) offer a typology of six cooperative models: traditional cooperatives, proportional investment cooperatives, member investor cooperatives, new generation cooperatives, cooperatives with capital seeking companies and investor share cooperatives. The main difference between these models is related to how property rights – in terms of residual claims or control – are attributed to the
3
Residual rights of control are defined as the rights to make any decision regarding the use of assets that are not explicitly attenuated by law or assigned to other parties by contract. Residual rights of control emerge from the impossibility of crafting, implementing and enforcing complete contracts (Chaddad & Iliopoulos, 2013:5).
Management and financial performance of agricultural cooperatives…(p.225-249) 229
REVESCO Nº 123 - Primer Cuatrimestre 2017 - ISSN: 1885-8031 - www.ucm.es/info/revesco
economic agents that meet the needs of cooperatives’ members. More recently, Chaddad and Iliopoulos (2013) have identified four alternative organisational formats based on ownership rights: open corporation, proprietorship, financial mutual and traditional cooperative. In traditional cooperatives, residual returns are only assigned to members and/or patrons. There is no separation of ownership from other functions, and control rights are based on non-equity proportional voting rights (i.e. the democratic principle of one person, one vote). In addition, the horizon of residual claims is as wide as the patrons, no residual claim transferability exists, and the ability to redeem residual claims is essential to the BoD’s description.
Since agricultural cooperatives are located at the core of food chains – between production and markets – these organisations’ efficiency depends on what is occurring upstream (i.e. supply) and downstream (i.e. demand). In theory, the traditional cooperative model should prevail in non-competitive market structures, the presence of market failures (i.e. market power and asymmetric information) and homogeneity among economic and social members. In situations of perfect competition, both upstream and downstream, the economics literature recommends the adoption of other organisational forms, namely, investor-owned firms. In any case, in terms of market competition, the most efficient cooperatives are those that apply a business approach and have strong leadership, well defined business strategies and an efficient structure of human, physical and financial resources and organisations (Rebelo & Caldas, 2012).
In their organisation and operations, Portuguese cooperatives follow the traditional cooperative model (Rebelo & Caldas, 2015), including the internal governance model.4 The Portuguese cooperative code defines as mandatory the following governance bodies: a general assembly (GA), a BoD and a supervisory board (SB). The bylaws of each cooperative can also define other bodies, as well as give power to the GA or to the BoD to create special committees of limited duration in order to perform specific tasks. The GA is composed of all members, acting by simple majority. The president and vice-president of the GA, as well the BoD and SB, are composed only of members and elected from among members of the cooperative. The BoD can delegate some of its functions to managers. In the decision-making process, the democratic principle of one member, one vote is adopted by primary cooperatives – as is the case for Portuguese olive oil cooperatives – with two exceptions: cooperatives whose members are part of other exclusive cooperatives and secondary cooperatives,
4
Chaddad and Iliopoulos (2013) provide a clear description of governance models adopted in different countries by focusing on the allocation of decision-making functions and formal and real authority.
federations and confederations. In this case, bylaws can attribute to each member a certain number of votes based on objective criteria.
In general, smaller Portuguese agricultural cooperatives follow the so-called ‘Mediterranean model’ of governance, characterised by the adoption of traditional principles and non-professional management (Rebelo, Caldas & Matulich, 2010). In these cooperatives, some members are simultaneously owners, suppliers and managers or supervisors, creating possible conflicts of interests (Lazzarini, Neto & Chaddad, 1999). When questioned about the issue, the Portuguese agricultural cooperative leaders do not have a unanimous answer for the question, ‘Is the traditional cooperative model imposed by cooperatives’ code a strong restriction on the competitiveness and development of long term entrepreneurial strategies?’ For cooperatives well positioned in the agro-food chain and with low leverage levels, compliance to cooperative rules is not a significant restriction. The inverse is experienced by cooperatives with high leverage, a weak position in their market and problems attracting members and/or patrons (Rebelo & Caldas, 2015). In other words, it is not easy to provide a clearly answer to questions about agricultural cooperatives’ efficiency.
The presence of management professionals in cooperatives has been restricted by several factors present not only in statutory bodies but also among managers themselves (Martí, 2004). Aragonés (1987) states that the entry of professional managers is conditioned by certain factors, such as the poor image some professionals have of cooperatives, ideological or philosophical resistance manifested by other managers, lower wages and subjective assessment of managers’ tasks. In addition, some professionals feel insecure because of possible administration changes and comments that may appear and negate these managers’ performance.
Nonetheless, Moral’s (2004) study in the region of Jaén, Spain, shows that the majority of members do not participate or get involved in the management of the cooperatives with which they are associated. Members tend to see their cooperatives as a firm that provides them services rather than as an enterprise that they co-own. Power is held by its members, but, as these are risk averse, the activities of the governing bodies are limited.
Despite limitations on the ownership of property rights, traditional cooperatives face the same problems that investor-owned firms do. However, the solutions to these problems vary due to differences developing out of the pursuit of dissimilar goals. On the one hand,
Management and financial performance of agricultural cooperatives…(p.225-249) 231
REVESCO Nº 123 - Primer Cuatrimestre 2017 - ISSN: 1885-8031 - www.ucm.es/info/revesco
traditional cooperatives seek to maximise the value of their members’ products by way of the price paid for these products. On the other hand, investor-owned firms seek profit maximisation (Rebelo et al., 2010).
Given cooperatives’ specific realities, different management models need to be analysed in other to improve the knowledge of structure, behaviour and performance of this kind of organizations. For example, Hamel’s (2000) approach offers the possibility of integrating values in order to distinguish organisations from their competitors and build a link between members’ expectations and the firms’ strategic positioning. Among the mainstays of providing business proposals and promises to customers, analysts must consider customer interface, mission and strategies, strategic resources and value creation networks. In contrast, the specific cooperative management model developed by Côté (2007) takes into account the duality of ‘mutuality and enterprise’. According to the cited author, business practices should be implemented to ensure resource sharing, cohesion among cooperative members and a common understanding of issues and challenges that confront cooperatives. In addition, cooperatives’ management models always need to consider the core ideology that acts as the genetic code of organisations. These are the values that each cooperative should consider as providing inspiration and purpose.
In summary, in agricultural cooperatives, which are a mix of vertical integration and horizontal coordination, the difficulties in measuring financial performance start with the concept of a firm and continue with the definition and alignment of the main stakeholders’ economic objectives. In general, the dominant viewpoint in the economics literature is to consider agricultural cooperative as user-owned and user-controlled organisations that seek to benefit members and/or patrons who coexist internally as different groups of stakeholders. Members, directors and managers each having their own objectives, which are not necessarily aligned (Rebelo et al., 2010). These issues require an assessment that integrates the governance/management structure and financial performance of the cooperatives studied. Concerning financial performance, the empirical studies that dominate the literature use financial ratios applied to investor-owned firms, with the necessary adjustments to capture the specific nature of each cooperative (Soboh et al., 2009). For instance, in small, traditional agricultural cooperatives, low participation of members in cooperative decisions is expected. Some directors also tend to be managers, and low profitability ratios, low risk investment decisions, low leverage (i.e. high financial autonomy) are common. However, these
cooperatives have difficulties in financing short (or long) term assets with short (or long) term capital and honouring short-term financial commitments. These organisations reveal better financial indicators if managed by professional staff.
3. THE PROMETHEE II APPROACH
Analyses of annual reports, interviews and visits to cooperatives allow researchers to study cooperatives’ organisational structure, members’ behaviour and management and agency relationships. This approach contributes to a multi-criteria analysis framework and allows conclusions about the relationship between financial performance and professional management.
The economic and financial information contained in annual reports submitted by cooperatives’ management is the baseline by which to assess the financial performance of the olive oil cooperatives selected for the present study. To this end, the information collected was compiled according to economic and financial indicators, in which five categories of economic indicators were used: risk, profitability, debt/structure, liquidity and activity.
Subsequently, given the dimensional nature of the data, a method of multi-criteria analysis was used (Kalogeras, Baourakis, Zopounidis & Dijk, 2005), more specifically, the PROMETHEE overlapping method. This method considers a finite set of alternatives that are evaluated by a finite number of criteria, yielding over-classification, non-compensatory relationships among the alternatives (Rodriguez, Costa & Carmo, 2013). This method is easy to use, and its results are robust (Taillandier & Stinckwich, 2011).
In order to apply PROMETHEE II, every analysis criterion is assigned a weight whose importance is defined by the decision-maker. The structure of preferences is obtained by the combination of alternate pairs and the greater the deviation, the greater the preference for each alternative as opposed to the alternative to which it was compared. Each preference reflects the classification of one criterion over another, and it can assume values between 0 and 1 (Morte, 2013).
The existing alternatives regarding each criterion are compared by a preference relation, setting a value Pj (a,b) that represents the preference intensity of alternative a in
relation to alternative b (Rei, 2013). The preferences between alternatives are adopted by the decision-maker according to six types of functions (see Table 1).
Management and financial performance of agricultural cooperatives…
REVESCO Nº 123 - Primer Cuatrimestre 201 Table 1. Preference functions of the
Function Type Mathematical Representation
I. Usual Criterion
II. U-shape Criterion
III. V-Shape Criterion
IV. Level Criterion
V. V-Shape with Indifference Criterion
VI. Gaussian Criterion
Source: Adapted
After choosing the functions and parameters ( the decision-maker’s preferences, the analysis proceeds pair of alternatives a, b ε A, the
the criteria used in the analysis.
4. RESULTS
As mentioned previously
cooperatives that met the analysis requirements PDO. The analysis of functional organis
consistent with the Portuguese
BoD and SB) can be delegate management turn control the daily activities of
5 Despite the existence of 12 cooperatives, this
proceedings, so its sustainability was of no interest to this study
Management and financial performance of agricultural cooperatives…(p.225
er Cuatrimestre 2017 - ISSN: 1885-8031 - www.ucm.es/info/revesco
functions of the PROMETHEE II multi-criteria decision
Mathematical Representation Graphic
, 1 ,0 , 00 , 1 ,0 , , , 1 , , 0 , 1 2 , 1 , , 0 , , 1 , , 0 , 0 1 !" , 0
Adapted from Brans and Vincke (1985)and Morte (2013)
functions and parameters (q and p) for each criterion preferences, the analysis proceeds with the preference
the preference index presents a in relation to b the analysis.
previously, the present study focused on 115 analysis requirements and fall within the Azeite de alysis of functional organisation charts revealed a linear organis
Portuguese cooperative code. Beyond the three statutory delegate management power to executive directors or the daily activities of the other departments.
cooperatives, this study only examined 11 as one firm was of no interest to this study.
- - (p.225-249) 233 www.ucm.es/info/revesco ecision-making method Representation (2013)
) for each criterion that bests suit reference index. For each b by considering all
5
olive processing Azeite de Trás-os-Montes organisational structure, statutory bodies (i.e. GA, irectors or managers, who in
firm was in bankruptcy
1 0 1 0 1 0 1 0 - 1/2 1 0 -
Since only cooperative members can legally be part of governance bodies and, in elections, the democratic principle of one person, one vote is applied, a problem arises related to the election of members who are inexperienced and lack management knowledge. Although they delegate management tasks to qualified professionals, these inexperienced members can interfere in cooperative management. Therefore, it is important to understand how the selected cooperatives’ management is influenced by governance bodies, members’ behaviour, organisation size and human resource structure.
The cooperatives analysed present dissimilar membership structures, varying between 400 and 2,200 members, and the participation – measured by the number of members who supply olives – also differs. The present study revealed, either through managers’ opinions or GA attendance, that there is a trend for individualistic behaviour and for members to behave as mere suppliers, viewing their cooperative only as a firm that buys members’ olives and not as a firm in which members are also shareholders. However, nothing concrete can be reported about the behaviour of members in terms of favouring short-term decisions about investments with long-term effects or members’ risk aversion, because the interviews revealed that managers’ opinions are not consensual.
Regarding production, it appears that, although the cooperatives under study belong to the same region, there are differences in terms of production and the quantities processed. In general, these cooperatives develop their services by charging a fee: a percentage of the oil produced from the olives supplied by each member, which is retained by the cooperative to pay for the production service. However, in one of the cases studied, the olives are acquired from members, who thus become mere suppliers of raw materials. The fee charged varies according to management decisions and differs from one cooperative to another. Olive production varies from year to year, which causes annual production fluctuations in all cooperatives. Nonetheless, considerable differences were observed between the cooperatives analysed: the lowest production, on average, was approximately 50,000 litres of olive oil/year, whilst the highest was around 1.7 million litres. The average production of the cooperatives was around 700,000 litres. However, most members’ production fell below 500 litres of oil per year, which means that these members are the most representative. It is important to note that the cooperatives are limited to only transforming raw material received from their members, which means that oil production is dependent on members’ olive production and supply.
Management and financial performance of agricultural cooperatives…(p.225-249) 235
REVESCO Nº 123 - Primer Cuatrimestre 2017 - ISSN: 1885-8031 - www.ucm.es/info/revesco
In terms of human resources, each cooperative employs an average of nine staff members. The greatest number of registered employees is 20, which occurred in a multi-sector cooperative, with only one employee dedicated to the olive multi-sector. Of the cooperatives in the region employing more than 10 employees, only one is exclusively dedicated to olive processing, and the remaining three are multi-sector cooperatives. There is only one cooperative that works with one employee, while the other cooperatives employ between six and nine employees. Production staff add up to the greatest number (about 50% of all employees), followed by administrative staff. However, directors who do not perform management functions have a significant weight as compared to professional managers and/or executive directors. It is worthwhile noting that the number of agronomy and economics technicians and commercial staff is quite small.
The main issue in the analysis of the cooperatives’ human resources is related to management as this reveals how the cooperatives are managed and what the relationship between management and financial performance is. Of the 11 cooperatives studied, four have a professional manager (i.e. an employee external to the BoD), and five have an executive manager whose duties combine this position with the presidency of the BoD. In the case of the cooperative with only one employee, all management tasks are performed by the sole employee and, in the exceptional case of Cooperative 7, which only operates during the olive oil production period, management is the responsibility of the three BoD members. These last make all necessary decisions before beginning the production season and resolve any sporadic issues by BoD consent.
The links between cooperatives’ management and governance bodies can be verified by the existing agency relationship between their BoD and professional managers. According to the interview data, the activity and/or functions of managers and/or executive directors are closely monitored by the BoD in about 73% of cases. Therefore, managers’ power of decision is shown to be limited by the BoD’s influence. Only two of the cooperatives studied have a connection between the managers and/or executive directors’ compensation and cooperative objectives, that is, a fraction of their income is related to bonuses for achieving predetermined goals. There is only one situation found in which management receives non-cash incentives.
In terms of age group, the majority of executives are older than 51 years old (67% of cases). However, the length of time that employees have worked for the cooperatives is equally important to understanding whether the most enduring relationships lead to better
results. Data analysis showed that in seven out of 10 cooperatives, the administrators have been with the organisation from the beginning of the period analysed (i.e. 2003). Cooperative 2 is an exception to this, as it began its activities in 2008. In the case of Cooperatives 4, 5 and 8, the managers and/or executive directors had already worked for the firms for over 10 years. In the remaining three cooperatives, the situations were different as management substitutions had occurred through the election of new governance bodies and the hiring of managers who were not previously staff members.
The level of education of managers and/or executive directors was selected as the main factor in the analysis of the relationship between cooperatives’ financial performance and the existence or not of professional managers. It was found that most managers and/or executive directors report levels of education higher than secondary school (i.e. twelfth grade). Approximately 42% of the managers and/or executive directors have degrees in agricultural sciences and other related areas, and, in 33% of cases, managers have degrees in economics and business. Only three cooperatives in the region have managers and/or executive directors without a higher education degree.
The intervention of directors in management activities could also be observed, as directors were chief executive officers themselves or controlled managers and, in six of the 11 cooperatives, the directors were managers themselves, with no other employee performing management functions. In order to be able to study the relationship between the cooperatives’ structure, management and financial performance, any connections that might justify the ranking of each cooperative were examined through a multi-criteria analysis method based on the analysis of financial performance, as discussed in the next section. This was done by calculating financial indicators and ratios. Based on Ross, Westerfield, Jaffe and Jordan’s (2009) work, several indicators were computed in order to achieve this objective (see Table 2).
Management and financial performance of agricultural cooperatives…(p.225-249) 237
REVESCO Nº 123 - Primer Cuatrimestre 2017 - ISSN: 1885-8031 - www.ucm.es/info/revesco
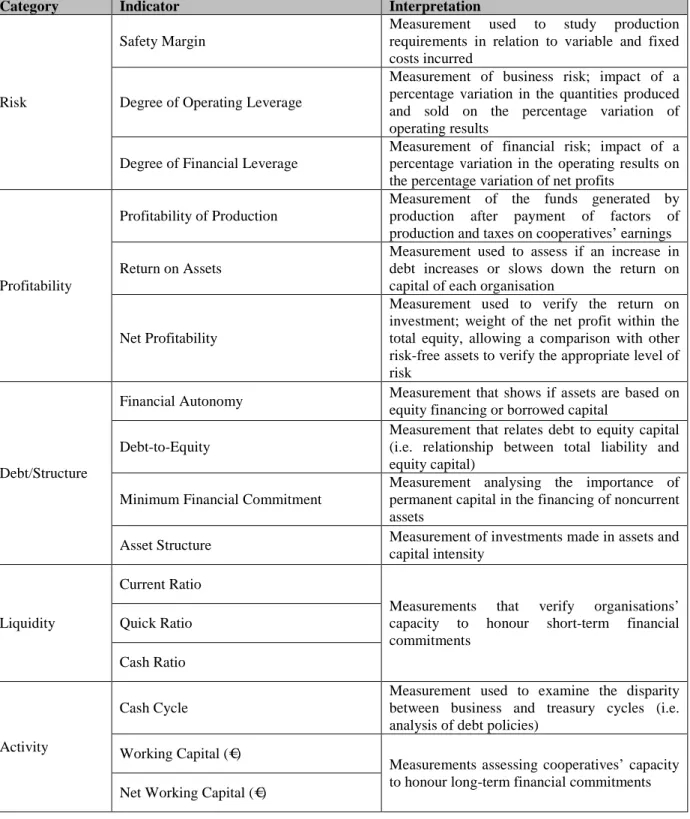
Table 2. Definitions of variables
Category Indicator Interpretation
Risk
Safety Margin
Measurement used to study production requirements in relation to variable and fixed costs incurred
Degree of Operating Leverage
Measurement of business risk; impact of a percentage variation in the quantities produced and sold on the percentage variation of operating results
Degree of Financial Leverage
Measurement of financial risk; impact of a percentage variation in the operating results on the percentage variation of net profits
Profitability
Profitability of Production
Measurement of the funds generated by production after payment of factors of production and taxes on cooperatives’ earnings Return on Assets
Measurement used to assess if an increase in debt increases or slows down the return on capital of each organisation
Net Profitability
Measurement used to verify the return on investment; weight of the net profit within the total equity, allowing a comparison with other risk-free assets to verify the appropriate level of risk
Debt/Structure
Financial Autonomy Measurement that shows if assets are based on equity financing or borrowed capital
Debt-to-Equity
Measurement that relates debt to equity capital (i.e. relationship between total liability and equity capital)
Minimum Financial Commitment
Measurement analysing the importance of permanent capital in the financing of noncurrent assets
Asset Structure Measurement of investments made in assets and capital intensity
Liquidity
Current Ratio
Measurements that verify organisations’ capacity to honour short-term financial commitments
Quick Ratio Cash Ratio
Activity
Cash Cycle
Measurement used to examine the disparity between business and treasury cycles (i.e. analysis of debt policies)
Working Capital (€)
Measurements assessing cooperatives’ capacity to honour long-term financial commitments Net Working Capital (€)
Source: Adapted from Ross et al. (2009)
As shown in Table 2, 16 indicators were calculated for the 11 cooperatives and used to analyse their financial structure. Later, these indicators were run through Visual PROMETHEE Academic software to rank the cooperatives from first to last in terms of financial sustainability.
Table 3. Financial indicators (2003–2012)
Economic and Financial Indicators
Average Minimum Maximum Standard Deviation
Coefficient of Variation
Safety Margin -92.28% -13,207.16% 1,828.79% 14.09 -1,527.18% Degree of Operating Leverage 3.29 -254.09 70.57 29.28 890.42% Degree of Financial Leverage 2.76 -2.38 33.95 5.32 193.19% Profitability Margin -0.93% -60.57% 39.80% 0.13 -1,436.04% Return on Assets 1.43% -14.83% 19.53% 0.05 379.04% Net Profitability 0.33% -98.50% 124.47% 0.23 6,922.82% Financial Autonomy 43.86% -60.29% 89.57% 0.34 78.34% Debt-to-Equity 0.47 -16.77 5.58 2.77 586.29% Minimum Financial Commitment 1.20 -0.15 2.99 0.61 50.76% Asset Structure 56.80% 19.10% 123.42% 0.20 35.49% Current Ratio 11.55 -7.67 912.72 94.49 818.19% Quick Ratio 9.70 -7.67 773.40 80.08 825.42% Cash Ratio 7.31 -0.03 635.33 65.85 901.26% Cash Cycle -43.61 -10,348.03 902.59 1,085.13 -2,488.51% Working Capital (€) 940.99 -1,155,494.81 1,272,495.13 417,270.30 44,343.95% Net Working Capital (€) 270,638.83 -911,579.73 4,525.012.30 870,792.57 321.75%
Source: Authors’ calculations based on annual reports and financial statements
In accordance to Table 3, the safety margin (i.e. (production – break-even point)/production) reveals the problem associated with high variable costs that, in some years and at some cooperatives, are critically close to the value of production. Thus, the break-even point is higher than the value of production, yielding negative results. The average degree of operating leverage (DOL) (i.e. contribution margin/operating income) shows that, in operational terms, the cooperatives’ business risk is considerable, that is, regardless of the existence of debt, the risk level demonstrates the rigidity imposed by fixed costs. Overall, a 1% fluctuation in the quantity produced and sold translates into a 3.29% variation in operating results. In terms of financial risk, the scenario for these cooperatives is more comfortable, as the average degree of financial leverage (i.e. operating income/earnings before tax) amounts to 2.76. In addition, although financial risk is not too far off from the calculated value of DOL, the minimum and maximum values are lower, meaning that financial risk is not a major concern. From an analysis of averages, it can be concluded that a 1% variation in operating results causes a 2.76% variation in net income, leading thus to greater debt. Therefore, it appears that the cooperatives have associated risks related to both their general activities and their need to resort to debt.
The average profitability of production (i.e. net income/production) shows a negative value, which shows the difficulty cooperatives have compensating for different productive
Management and financial performance of agricultural cooperatives…(p.225-249) 239
REVESCO Nº 123 - Primer Cuatrimestre 2017 - ISSN: 1885-8031 - www.ucm.es/info/revesco
inputs, paying taxes and yet still generating funds through production. The return on assets (ROA), which can contribute to the generation of results by managing minimal assets to generate the greatest possible result, can be measured by profitability (i.e. operating income/ROA) that, on average, amounts to 1.43% in the present studies’ analysis, meaning that assets are greater than operating income. In comparison to reference values, it appears that the cooperatives’ earning power is lower than the average cost of each company’s debts, which indicates that increased debt causes a decrease in net profitability. In terms of net profitability or return on equity (i.e. net income/equity), on average, there is a return of 0.33%. This ratio is used by investors to determine whether the return on investment is appropriate for the level of risk. However, when comparing results to the capital asset pricing model and considering a return on assets without risk of 3%, the risk premium is less than zero, since the average value of the ratio is less than 3%. Thus, the cooperatives’ profits are reduced, as their objective is not to create return on capital for its members but instead to provide the service of olive processing.
The cooperatives’ financial autonomy (i.e. equity/assets) is, on average, quite good at 43.86%. The higher the value for this indicator, the better the situation of each firm as it relates to the need for credit, that is, the cooperatives can offer better collateral to fulfil their responsibilities in the event of liquidation. In the case of debt-to-equity (i.e. liabilities/equity), the relationship can be measured between debt and equity. On average, the analysis results present a favourable ratio (i.e. lower than 1), in which liabilities are lower than equity – the best situation according to analysts. The cooperatives’ minimum financial commitment (i.e. permanent capital/noncurrent assets) is fulfilled, as the average shows that the cooperatives studied funded their assets, between 2003 and 2012, with capital whose maturity was greater than or equal to the assets’ economic life, as should be the case. As to asset structure, since specific high value machinery is required to process, extract and package olive oil, the average asset structure (i.e. noncurrent assets/total assets) value reveals that the weight of the cooperatives’ noncurrent assets is greater than the weight of current assets. In general, the cooperatives exhibit good funding capability, and they are well structured to maintain their activities.
The current ratio (i.e. current assets/current liabilities) needs to be greater than one in order to ensure that each cooperative is able to meet its short-term commitments, which was verified in the present analysis. In this study, five cooperatives showed, throughout the 10
years under review, a capacity for short-term commitments, with only one firm undergoing short-term financial disruption. However, liquidity can be understood in a narrower sense by only considering flexible assets. Consequently, in terms of the quick ratio (i.e. (current asset – inventories)/current liabilities), the average results demonstrate that, even by reducing the most liquid assets to flexible assets, the cooperatives under analysis are still capable of honouring their short-term commitments, even though this indicator’s value should be less than one.
Furthermore, it is possible to simplify the concept of liquidity further by considering that liquidity is only obtained through net financial means. Regarding the quick ratio (i.e. liquid financial asset/current liabilities), it appears that the cooperatives, on average, are able to meet their short-term commitments, as their net funds are more than seven times higher than their current liabilities are. Nevertheless, there is no need to maintain high levels of liquidity, which can instead be channelled towards required investments.
As a discrepancy was found between the cooperatives’ business and financial cycles, it was necessary to observe carefully the cash cycle (i.e. days inventory outstanding + days sales outstanding – days payment outstanding), whose average indicates that the average time obtained from credit providers is greater than the average length of loans to customers (i.e. a reduced business cycle of less than two days). In terms of working capital (i.e. current assets – current liabilities) and net working capital (i.e. inventories + accounts receivable + deferred income – accounts payable – deferred liabilities), an extremely unfavourable position, on average, was observed for the cooperatives studied. The average working capital is lower than the average value of the net working capital. Consequently, the cooperatives reveal problems related to their ability to fulfil commitments by their maturity date. Only four cooperatives, when the average of the years analysed was compared, presented greater working capital than their net working capital. The most negative situations – resulting from recent investments made in equipment modernisation and marketing – and the most severe cases were found to be cooperatives with stronger market positions.
Normally, cooperatives present both moderate business and financial risk, with business risk being higher than financial risk. These firms also show reduced profitability, high financial autonomy, compliance with minimum financial commitment standards, compliance with short-term financial commitments and high net working capital that exceeds their working capital.
Management and financial performance of agricultural cooperatives…(p.225-249) 241
REVESCO Nº 123 - Primer Cuatrimestre 2017 - ISSN: 1885-8031 - www.ucm.es/info/revesco
The results of the present study support the conclusion that, overall, the cooperatives of the Azeite de Trás-os-Montes PDO are financially sustainable. These firms’ least favourable condition is their high net working capital, which surpasses their working capital. In order to establish a hierarchy of financial sustainability, 11 cooperatives were submitted to a multi-criteria analysis. In addition, based on selected financial indicators, the firms’ positions in the resulting ranking and the ensuing relationship between their financial performance and professional management were determined.
The sample cooperatives were coded by number and unrelated to alphabetical order, ranking or other status. The parameters were set according to the type of function chosen for each criterion, taking into account the minimum and reasonable values for each of the analysed criteria. The parameters of profitability were set relatively low to reflect the usual values expected for cooperatives.
It was assumed that the weight of the indicators would be similar: elements of equal importance to the financial sustainability of cooperatives. In Tables 4 and 5, any intention to maximise or minimise the criteria is made clear by the weight (i.e. equal to one), the preferred function type and parameter values defined for each criterion. The definition of preferences is similar to the analysis performed to obtain the 10-year average for each cooperative and the analysis that considered only the last year studied (i.e. 2012).
The results cover three situations: the current position of the selected cooperatives, their evolution from 2003 to 2012, and an analysis of the bearing of different habits, which was reduced to covering the last three years. Thus, we first analysed a scenario in which each cooperatives was evaluated based on the final year of the analysis period (i.e. 2012). The firms were, subsequently, ranked by taking into account the average for 10 years calculated for each of the analysed criteria and, finally, analysed for the cooperatives’ situation in the last three years – from 2010 to 2012.
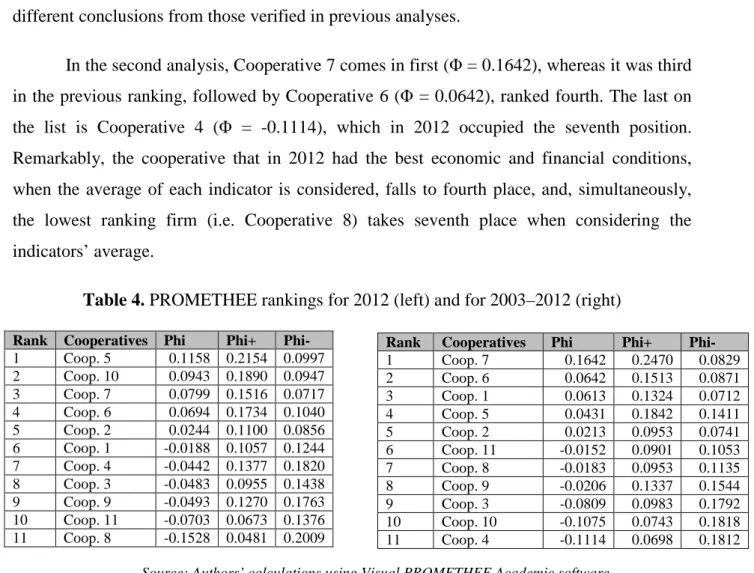
The calculation of Φ (Phi) is the difference between Φ+ (Phi+) and Φ- (Phi-). In 2012,
the cooperative that placed first in the obtained ranking, with the best economic and financial situation, was Cooperative 5 (Φ = 0.1158), followed by Cooperative 10 (Φ = 0.0943). The
cooperative that revealed the worst economic and financial situation was Cooperative 8, ranked eleventh. The calculation of the average for each indicator over the 10 years analysed
Source: Authors’ calculations using Visual PROMETHEE Academic software
– with the exception of the above cases – allowed us to establish a ranking that supports different conclusions from those verified in previous analyses.
In the second analysis, Cooperative 7 comes in first (Φ = 0.1642), whereas it was third
in the previous ranking, followed by Cooperative 6 (Φ = 0.0642), ranked fourth. The last on
the list is Cooperative 4 (Φ = -0.1114), which in 2012 occupied the seventh position.
Remarkably, the cooperative that in 2012 had the best economic and financial conditions, when the average of each indicator is considered, falls to fourth place, and, simultaneously, the lowest ranking firm (i.e. Cooperative 8) takes seventh place when considering the indicators’ average.
Table 4. PROMETHEE rankings for 2012 (left) and for 2003–2012 (right)
Rank Cooperatives Phi Phi+ Phi-
1 Coop. 5 0.1158 0.2154 0.0997 2 Coop. 10 0.0943 0.1890 0.0947 3 Coop. 7 0.0799 0.1516 0.0717 4 Coop. 6 0.0694 0.1734 0.1040 5 Coop. 2 0.0244 0.1100 0.0856 6 Coop. 1 -0.0188 0.1057 0.1244 7 Coop. 4 -0.0442 0.1377 0.1820 8 Coop. 3 -0.0483 0.0955 0.1438 9 Coop. 9 -0.0493 0.1270 0.1763 10 Coop. 11 -0.0703 0.0673 0.1376 11 Coop. 8 -0.1528 0.0481 0.2009
The position of each cooperative is made clear in Table 4, which sets forth the results of the cash flow for each cooperative, for the two different scenarios, based on results directly produced by the software. As shown in Table 5, when the last three-year ranking is compared to 2012, it appears that the differences are negligible, and only Cooperative 6 shows a three position drop (i.e. fourth to seventh place). Both ends of the ranking remain unchanged: Cooperative 5 is first, and the last is Cooperative 8.
Rank Cooperatives Phi Phi+ Phi-
1 Coop. 7 0.1642 0.2470 0.0829 2 Coop. 6 0.0642 0.1513 0.0871 3 Coop. 1 0.0613 0.1324 0.0712 4 Coop. 5 0.0431 0.1842 0.1411 5 Coop. 2 0.0213 0.0953 0.0741 6 Coop. 11 -0.0152 0.0901 0.1053 7 Coop. 8 -0.0183 0.0953 0.1135 8 Coop. 9 -0.0206 0.1337 0.1544 9 Coop. 3 -0.0809 0.0983 0.1792 10 Coop. 10 -0.1075 0.0743 0.1818 11 Coop. 4 -0.1114 0.0698 0.1812
Management and financial performance of agricultural cooperatives…(p.225-249) 243
REVESCO Nº 123 - Primer Cuatrimestre 2017 - ISSN: 1885-8031 - www.ucm.es/info/revesco
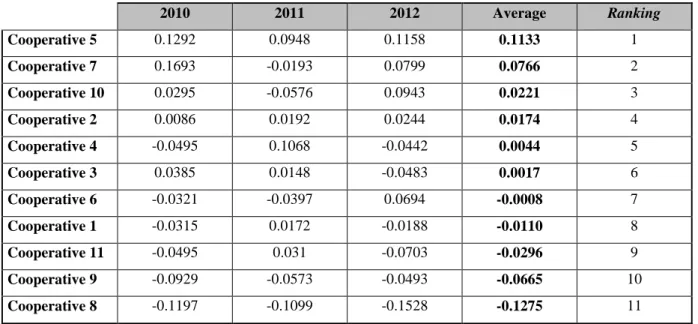
Table 5. PROMETHEE rankings for 2010–2013
2010 2011 2012 Average Ranking Cooperative 5 0.1292 0.0948 0.1158 0.1133 1 Cooperative 7 0.1693 -0.0193 0.0799 0.0766 2 Cooperative 10 0.0295 -0.0576 0.0943 0.0221 3 Cooperative 2 0.0086 0.0192 0.0244 0.0174 4 Cooperative 4 -0.0495 0.1068 -0.0442 0.0044 5 Cooperative 3 0.0385 0.0148 -0.0483 0.0017 6 Cooperative 6 -0.0321 -0.0397 0.0694 -0.0008 7 Cooperative 1 -0.0315 0.0172 -0.0188 -0.0110 8 Cooperative 11 -0.0495 0.031 -0.0703 -0.0296 9 Cooperative 9 -0.0929 -0.0573 -0.0493 -0.0665 10 Cooperative 8 -0.1197 -0.1099 -0.1528 -0.1275 11
Source: Authors’ calculations using Visual PROMETHEE Academic software
However, if the comparison takes into account the indicators’ average for the 10 years analysed, there are both significant positive and substantial negative changes. Cooperative 10 rises from second-to-last to third place, and Cooperative 4, which was last, moves up to fifth, while Cooperatives 6 and 1 fall five places, from second to seventh and third to eighth place, respectively.
Since the largest cooperatives – those with a strong presence in the domestic market and with the highest assets, equity and liabilities – occupy the last three places, a reason for these results must be found. The most likely cause, based on an analysis of financial statements, is the high level of debt created by greater asset investment and the relationship between working capital and working capital needs, as well as the treasury cycle.
In order to validate these causes, a sensitivity analysis was conducted by changing the weight assigned to these criteria in the average of the indicators between 2003 and 2012, reducing their representation in the model. It was found that the change in weight assigned to debt and activity indicators produces changes in terms of ranking. Thus, it can be concluded that the problem associated with the cooperatives of the Azeite de Trás-os-Montes PDO with a stronger presence in the market (i.e. Cooperatives 8, 9 and 11) is related to debt levels and difficulties in honouring long-term commitments due to an excessive difference between working capital needs and working capital.
Table 6. PROMETHEE ranking averages from 2003 to 2012, with changes in the weight assigned to debt and activity indicators
Source: Authors’ calculations using Visual PROMETHEE Academic software
As PROMETHEE II is a total ranking method, the ranking is obtained by taking into account the derived flows, based on the difference between positive and negative flows. The positive flow (Phi+) represents the cases in which the alternative a supersedes all other alternatives. In contrast, the negative flow (Phi-) represents the cases in which the alternative a is superseded by other alternatives. In this way, the overall ranking is given as Phi (a) = Phi+ (a) – Phi- (a), so that a is preferable to b if Phi (a) > Phi (b).
Given the results obtained – despite providing a better understanding of the evolution of cooperatives – the 10-year average is less reliable than the last three-year analysis, as the former enables an impact analysis of the alternative bearing of habits and efforts made in recent years, as well as considering the data available for the 11 cooperatives. In addition, considering only the last three years in the present study reduces the influence of possible management changes, an approach that, thus, is more advisable when seeking to verify the relationship between financial performance and professional management.
Therefore, based on the ranking resulting from the last three years of analysis (2010– 2012), it appears that the cooperatives located above the sixth position are those with executive officers and other situations (i.e. decisions made at the management level) with professionals who have a degree in agriculture and other relevant fields. However, it cannot be stated that this is the best structure for cooperatives. The results indicate that professional management is not essential to ensure financial sustainability in the case of the cooperatives studied.
Rank Cooperatives Phi Phi+ Phi-
1 Coop. 5 0.1320 0.2500 0.1180 2 Coop. 1 0.1201 0.1732 0.0531 3 Coop. 7 0.0866 0.2168 0.1302 4 Coop. 6 0.0455 0.1316 0.0861 5 Coop. 8 0.0356 0.1291 0.0935 6 Coop. 11 0.0006 0.0978 0.0972 7 Coop. 9 -0.0067 0.1474 0.1541 8 Coop. 2 -0.0379 0.0690 0.1069 9 Coop. 4 -0.0752 0.1002 0.1755 10 Coop. 3 -0.0974 0.1261 0.2235 11 Coop. 10 -0.2032 0.0382 0.2414
Management and financial performance of agricultural cooperatives…(p.225-249) 245
REVESCO Nº 123 - Primer Cuatrimestre 2017 - ISSN: 1885-8031 - www.ucm.es/info/revesco
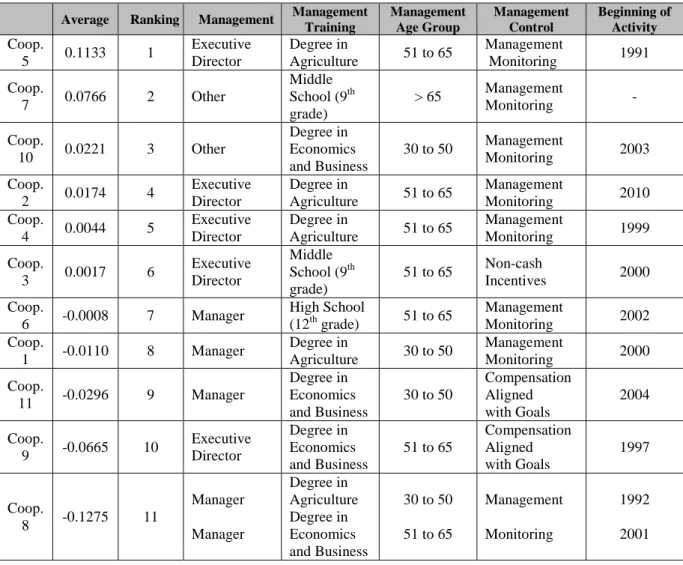
The information contained in Table 7 allows us to reject the idea that cooperatives’ financial performance is better if there is professional management. In our case the cooperatives without professional management were found to have better economic and financial performance. However, these results should not be over-generalized because the differences found may be caused by different levels of control and interference by the compulsory cooperatives’ governance bodies that limit managers’ scope of action.
Table 7. Relationship between and management structure and financial performance
Average Ranking Management Management Training Management Age Group Management Control Beginning of Activity Coop. 5 0.1133 1 Executive Director Degree in Agriculture 51 to 65 Management Monitoring 1991 Coop. 7 0.0766 2 Other Middle School (9th grade) > 65 Management Monitoring - Coop. 10 0.0221 3 Other Degree in Economics and Business 30 to 50 Management Monitoring 2003 Coop. 2 0.0174 4 Executive Director Degree in Agriculture 51 to 65 Management Monitoring 2010 Coop. 4 0.0044 5 Executive Director Degree in Agriculture 51 to 65 Management Monitoring 1999 Coop. 3 0.0017 6 Executive Director Middle School (9th grade) 51 to 65 Non-cash Incentives 2000 Coop. 6 -0.0008 7 Manager High School (12th grade) 51 to 65 Management Monitoring 2002 Coop. 1 -0.0110 8 Manager Degree in Agriculture 30 to 50 Management Monitoring 2000 Coop. 11 -0.0296 9 Manager Degree in Economics and Business 30 to 50 Compensation Aligned with Goals 2004 Coop. 9 -0.0665 10 Executive Director Degree in Economics and Business 51 to 65 Compensation Aligned with Goals 1997 Coop. 8 -0.1275 11 Manager Manager Degree in Agriculture Degree in Economics and Business 30 to 50 51 to 65 Management Monitoring 1992 2001
Source: Authors’ calculations based on interviews and computations
5. CONCLUSIONS
This study contributes to a greater understanding of the managerial structure and financial performance of cooperatives, with a focus on the specific case of Portuguese olive oil cooperatives located in the Trás-os-Montes DOP region. The cooperatives studied are organised according the traditional model of governance adopted by the vast majority of small, local cooperatives in Mediterranean EU countries, supported by an organisational
structure in which the BoD is elected by the GA from among cooperative members and controlled by the SB. The BoD can appoint a manager or a executive director to whom the board delegates current management tasks.
In this study, in most cases the BoD is the management, although, in five cooperatives there is an executive director. In terms of age, the majority of the managers and/or executive directors are between 51 and 65 years old. They joined the cooperative before the start date of the study (i.e. 2003), and they have higher education degrees in agricultural sciences and similar fields and/or economic and business fields.
The indicators of financial performance selected for analysis allowed us to conclude that the cooperatives present, on average, moderate risk and that their business risk is higher than their financial risk. In addition, the profitability of production and financial assets are low, which are in line with finding that the goal of cooperatives is not profit maximisation but instead surplus maximising. In terms of debt, the cooperatives show satisfactory ratios of financial autonomy and moderate debt, except for those that have made significant investments in recent years. A liquidity analysis showed that the cooperatives have the capacity to meet their short-term commitments. Overall, the cooperatives of the Azeite de Trás-os-Montes PDO region are financially sustainable, yet they need to be careful in regulating their investments and need for working capital.
The application of a multi-criteria analysis showed that the existence of a manager does not enhance financial performance. However, the best positioned cooperatives benefit from executive directors who mostly have higher education degrees in agriculture.
In summary, the results confirm the hypotheses of low levels of participation of members in cooperatives’ decision-making processes, the tendency of directors to be also managers, low profitability ratios, low risk investment decisions and an ability to honour financial commitments. The hypothesis of low leverage is partially verified, leading to the conclusion that cooperatives have stable and satisfactory financial autonomy, and that they are able to meet the minimum financial commitment rule. Finally, the hypothesis of better financial indicators for cooperatives managed by professional executives is refuted, since cooperatives with professional management from 2003 to 2012 did not present better financial performance. This result reinforces the belief that cooperatives that are structured differently have different and conflicting stakeholder interests. In this study’s findings, cooperatives with
Management and financial performance of agricultural cooperatives…(p.225-249) 247
REVESCO Nº 123 - Primer Cuatrimestre 2017 - ISSN: 1885-8031 - www.ucm.es/info/revesco
professional managers seek to assume more long-term investments financed by loans, with negative consequences on leverage and other financial indicators.
The limitations of the results are related to the use of static financial and economic indicators that do not include social features of the selected firms, as well as the use of a multi-criteria analysis framework and respective parameters that were chosen according to the preferences of the decision-maker. Thus, future research needs to focus on evaluating financial performance by analysing financial flows. Studies should consider the impact of settlement prices for raw materials (i.e. the practice of patronage refund), use another multi-criteria method and consider the impact of cooperatives upon agriculture appreciation and regions with desertification and aging problems (i.e. challenging regions). It would also be important to conduct research on how to balance financial goals and social objectives underlying the externalities produced in order to measure the economic, financial and social performance of agricultural cooperatives.
REFERENCES
ARAGONÉS. (1987) In: MORAL, A. M. La violacion del modelo de gestión democratico en las cooperativas oleícolas.
BRANS, J. P. & VINCKE, P. (1985) Note – A preference ranking organisation method. Management Science, No 31, Vol. 6, pp. 647–656.
CHADDAD, F. & COOK, M. (2004) Understanding new cooperative models: An ownership-control rights typology. Review of Agricultural Economics, No 26, Vol. 3, pp. 348–360. CHADDAD, F. & ILIOPOULOS, C. (2013) Control rights, governance and the costs of
ownership in agricultural cooperatives. Agribusiness – An International Journal, No 29, Vol. 1, pp. 3–22.
COGECA. (2010) Agricultural co-operatives in Europe: Main issues and trends. Brussels, Belgium: Cogeca.
CÔTÉ, D. (2007) Gestion de l’équilibre coopératif: Cadre théorique. Économie et Solidarités, No 38, Vol. 1, pp. 112–126.
HAMEL. (2000) In: CÔTÉ, D. Gestion de l`équilibre coopératif: Cadre théorique.
KALOGERAS, N., BAOURAKIS, G., ZOPOUNIDIS, C. & DIJK, G. V. (2005) Evaluating the financial performance of agri-food firms: A multicriteria decision-aid approach. Journal of Food Engineering, No 70, Vol. 3, pp. 365–371.
LAZZARINI, S., NETO, S. & CHADDAD, F. (December 1999) Decisões financeiras em cooperativas: Fontes de ineficiência e possíveis soluções. Gestão e Produção, No 6, Vol. 3, pp. 257–268.
LÉON, P. (2001) Os quatro pilares da sustentabilidade financeira. The Nature Conservancy. http://www.parksinperil.org/files/four_pillars_port.pdf
MARTÍ, E. G. (2004) Características del poder y la rentabilidad en una almazara cooperativa: Teoría de agencia versus teoría del servidor. REVESCO. Revista de Estudios
Cooperativos, No 83, pp. 33–49.
MORAL, A. M. (2004) La violación del modelo de gestión democrático en las cooperativas oleicolas. CIRIEC – España, Revista de Economía Pública, Social y Cooperativa, No 48, pp. 167–191.
MORTE, R. C. (2013) Modelo de apoio à decisão multicritério para a avaliação de
desempenho de motoristas numa empresa portuguesa de transporte rodoviário. Oporto: Faculdade de Economia do Porto.
REBELO, J. & CALDAS, J. (2015) The economic role of the Portuguese agricultural
cooperatives. Revista de Economia e Sociologia Rural – RESR, No 53, Vol. 1, pp. 91–102. REBELO, J. & CALDAS, J. V. (2012) Support for farmer’s cooperatives. Country Report
Portugal. Wageningen, UR: Wageningen.
REBELO, J., CALDAS, J. & MATULICH, S. (2010) Performance of traditional
cooperatives: The Portuguese Douro wine cooperatives. Economía Agraria y Recursos Naturales, No 10, Vol. 2, pp. 143–158.
REI, C. D. (2013) Desenvolvimento de critérios para a localização otima de uma central de valorização energética de lamas de ETAR. Lisbon: Faculdade de Ciências e Tecnologia – Universidade Nova de Lisboa.
RODRIGUEZ, D. S., COSTA, H. G. & CARMO, L. F. (2013) Métodos de auxilio multicritério à decisão aplicados a problemas de PCP: Mapeamento da produção em periódicos publicados no Brasil. Gestão & Produção, No 20, Vol. 1, pp. 134–146. ROSS S. A., WESTERFIELD R. W., JAFFE J. F. & JORDAN B. D. (2009) Corporate
finance: Core principles and applications. Second edition. Columbus, OH: McGraw-Hill Irwin International, pp. 45–88.
SANTOS, M. J. (2013) O setor cooperativo agrícola na União Europeia. Potencialidades e Perspetivas, No 93, pp. 16–19.
Management and financial performance of agricultural cooperatives…(p.225-249) 249
REVESCO Nº 123 - Primer Cuatrimestre 2017 - ISSN: 1885-8031 - www.ucm.es/info/revesco
SOBOH, R., LANSINK, A. GIESEN, G. & VAN DIJK, G. (2009) Performance measurement of the agricultural marketing cooperatives: The gap between theory and practice. Review of Agricultural Economics, No 31, Vol. 3, pp. 446–469.
TAILLANDIER, P. & STINCKWICH, S. (2012) Using the PROMETHEE multi-criteria decision making method to define new exploration strategies for rescue robots. IEEE International Symposium on Safety Security, and Rescue Robotics. Kyoto: IEEE, pp. 321– 326.
TEIXEIRA, A. (2014) Sustentabilidade financeira das cooperativas oleícolas da região DOP ‘Azeite de Trás-os-Montes’. Master thesis. Vila Real, Portugal: UTAD.