Original Research
First- and Second-Trimester Evaluation of
Risk for Down Syndrome
Robert H. Ball,
MD, Aaron B. Caughey,
MD,
MPP, Fergal D. Malone,
MD, David A. Nyberg,
MD,
Christine H. Comstock,
MD, George R. Saade,
MD, Richard L. Berkowitz,
MD, Susan J. Gross,
MD,
Lorraine Dugoff,
MD, Sabrina D. Craigo,
MD, Ilan E. Timor-Tritsch,
MD, Stephen R. Carr,
MD,
Honor M. Wolfe,
MD, Danielle Emig,
MPH, and Mary E. D’Alton,
MD, for the First and Second
Trimester Evaluation of Risk (FASTER) Research Consortium*
OBJECTIVE: To investigate the differences in costs and outcomes of Down syndrome screening using data from the First and Second Trimester Evaluation of Risk (FASTER) Trial.
METHODS: Seven possible screening options for Down syndrome were compared: 1) Triple Screen— maternal serum alpha fetoprotein, estriol, and hCG; 2) Quad—maternal serum alpha fetoprotein, estriol, hCG, and Inhibin A; 3) Combined First—nuchal trans-lucency, pregnancy-associated plasma protein A
(PAPP-A), free -hCG; 4) Integrated—nuchal translu-cency, PAPP-A, plus Quad; 5) Serum Integrated— PAPP-A, plus Quad; 6) Stepwise Sequential—Com-bined First plus Quad with results given after each test; and 7) Contingent Sequential—Combined First and only those with risk between 1:30 and 1:1,500 have Quad screen. The detection rates for each option were used given a 5% false-positive rate except for Contin-gent Sequential with a 4.3% false-positive rate. Out-comes included societal costs of each screening regi-men (screening tests, amniocentesis, manageregi-ment of complications, and cost of care of Down syndrome live births), Down syndrome fetuses identified and born, the associated quality-adjusted life years, and the incremental cost– utility ratio.
RESULTS: Based on the screening results derived from the 38,033 women evaluated in the FASTER trial, the Contingent Sequential screen dominated (lower costs with better outcomes) all other screens. For example, the Contingent Sequential cost 32.3 million dollars whereas the other screens ranged from 32.8 to 37.5 million dollars. The Sequential strategy led to the identification of the most Down syndrome fetuses of all of the screens, but at a higher cost per Down syndrome case diagnosed ($719,675 compared with $690,427) as compared with the Contingent Sequential. Because of the lower overall false-positive rate leading to fewer procedure-related miscarriages, the Contin-gent Sequential resulted in the highest quality-ad-justed life years as well. The Contingent Sequential remained the most cost-effective option throughout sensitivity analysis of inputs, including amniocentesis rate after positive screen, rate of therapeutic abortion after Down syndrome diagnosis, and rate of proce-dure-related miscarriages.
CONCLUSION: Analysis of this actual data from the FASTER Trial demonstrates that the Contingent Sequen-tial test is the most cost-effective. This information can
See related editorial on page 2.
* For a listing of other members of the FASTER Research Consortium, see the Appendix.
From the University of Utah and Intermountain HealthCare, Salt Lake City, Utah; University of California, San Francisco, San Francisco, California; Columbia University College of Physicians and Surgeons, New York, New York; Royal College of Surgeons in Ireland, Dublin, Ireland; Swedish Medical Center, Seattle, Washington; William Beaumont Hospital, Royal Oak, Michigan; University of Texas Medical Branch, Galveston, Texas; Mount Sinai School of Medicine, New York, New York; Montefiore Medical Center/Albert Einstein College of Medicine, Bronx, New York; University of Colorado Health Sciences Center, Denver, Colorado; Tufts University School of Medicine, Boston, Massa-chusetts; New York University School of Medicine, New York, New York; Brown University School of Medicine, Providence, Rhode Island; University of North Carolina Medical Center, Chapel Hill, North Carolina; and DM-STAT, Boston, Massachusetts.
Supported by Grant Number RO1 HD 38652 from the National Institutes of Health and the National Institute of Child Health and Human Development. Dr. Caughey is a Women’s Reproductive Health Research Scholar, sponsored by the National Institute of Child Health and Human Development, Grant # HD01262.
Corresponding author: Robert H. Ball, MD, Department of Obstetrics, Gyne-cology, and Reproductive Sciences, Box 0132, UCSF, San Francisco, California 94143-0132; e-mail: [email protected].
Financial Disclosure
The authors have no potential conflicts of interest to disclose.
© 2007 by The American College of Obstetricians and Gynecologists. Published by Lippincott Williams & Wilkins.
help shape future policy regarding Down syndrome screening.
(Obstet Gynecol 2007;110:10–7)
F
irst-trimester screening for Down syndrome usingnuchal translucency measurement alone or in con-junction with serum levels of certain analytes has become increasingly widespread, since first conceived by Nicolaides and other investigators.1,2 Several
Eu-ropean and U.S. studies3– 6 have documented that
strategies that include nuchal translucency can reach sensitivities of up to 90% at low false-positive rates. Evaluation in the first trimester also allows incorpo-ration of these first-trimester results with the current standard-of-care second-trimester serum screening.7 The First and Second Trimester Evaluation of Risk (FASTER) Trial6 compared first-trimester screening with nuchal translucency and serum analytes
(PAPP-A and free -hCG) directly to the Quad
Screen (second-trimester maternal serum alpha-feto protein, estriol, -hCG, and Inhibin-A) as well as combinations of these markers
Since the FASTER Trial was designed and exe-cuted, additional screening strategies for identifying Down syndrome fetuses have evolved using the same tests. These are the concept of Stepwise Sequential screening8 and Contingent Sequential screening.9In the former, results are provided to patients after both the first- and second-trimester components of the test, with all patients who are initially screen negative being screened again in the second trimester. In this case the second-trimester screening analyses take into account the results of the earlier first-trimester screen for any given individual. Contingent Sequential screening also begins with combined first-trimester screening using both nuchal translucency and first-trimester serum screen. However, based on these results, there are three options: 1) high risk—these women are offered invasive prenatal diagnostic test-ing; 2) moderate risk—these women go on to get second-trimester serum screening; and 3) low risk— these women obtain no further testing.
Data in the literature so far primarily focus on detection rates of the different strategies for screening for Down syndrome. Cost-effectiveness analyses for Down syndrome screening that have been reported to date have been based on modeled rather than actual data.10 –12 Whereas detection rates are important for any given individual, the cost-effectiveness of these screening strategies is critical information for devel-opment of optimal public health strategies for Down syndrome detection in the general population. In the
current analysis, we use actual data from the FASTER trial to examine the cost-effectiveness of first and second-trimester screening strategies for Down syndrome.
MATERIALS AND METHODS
The FASTER study was approved by the individual institutional review boards at each one of the study sites. A decision analytic model was developed with seven primary branches: 1) Triple Screen—maternal serum alpha fetoprotein (AFP), estriol, and hCG; 2) Quad Screen—maternal serum AFP, estriol, hCG, plus Inhibin A; 3) Combined First—nuchal translucency, pregnancy associated plasma Protein A (PAPP-A), and free -hCG; 4) Integrated—nuchal translucency, PAPP-A plus Quad, with result provided after all tests completed; 5) Serum Integrated—PAPP-A plus Quad without nuchal translucency; 6) Stepwise Sequential— Combined First plus Quad with results given after each test; and 7) Contingent Sequential—Combined First triple screen, only those with risk between 1:30 and 1:1,500 have Quad Screen. Essentially, once a screening test is used, the patient can get a positive or negative result. If the result is positive, patients can choose whether to undergo definitive karyotypic di-agnosis. If this arm is chosen, patients will either undergo a spontaneous abortion, receive results of aneuploidy, or normal results. Furthermore, to eval-uate the tests on equal grounds, only amniocentesis for prenatal diagnosis was used. TreeAge Pro software (TreeAge Software, Williamston, MA) was used for the design and analysis of this model.
Sensitivity and specificity of the screening tests and probabilities of Down syndrome, patients’ deci-sion to proceed with amniocentesis after a positive test, patients’ decision to terminate a pregnancy, and risk of procedure-related loss were all obtained from the FASTER trial.6To obtain costs and utilities for the outcomes related to Down syndrome screening and the screening tests themselves, the English literature was searched for the following terms: nuchal translu-cency, aneuploidy, serum screen, Down syndrome, biochemical screen, obstetric ultrasound, MSAFP, PAPP-A, free, amniocentesis, and genetic screening. Of the articles obtained from this literature search, the lists of references were searched to make sure no other references were missed.
The sensitivities used for the screening regimens ranged from 69% for the Triple Screen to 95% for the fully Integrated first- and second-trimester screens at a 5% false-positive rate (Table 1). A range of cutoffs are applicable to these false-positive rates. For first-trimes-ter combined screening it is equivalent to an
approx-imate cutoff of 1 in 250; for second-trimester triple and quad screening it approximates a cutoff of 1 in 140; for integrated and sequential screening it is a cutoff of approximately 1 in 270. For contingent screening, cutoffs used in the first trimester were 1 in 30 and 1 in 1,500 and for the second trimester were 1 in 270.
Overall, the proportion of women who would obtain an amniocentesis with a positive test was 57%, whereas the proportion who terminated a Down syndrome pregnancy was 98%. To capture behavior that would vary between different populations, these values were varied over wide ranges (Table 1). The rate of Down syndrome in the study population was higher than that seen in the general population at 0.0024,13 and the loss rate from amniocentesis was
lower than that commonly quoted14 at 1 in 1,600.
However, this value was varied to as high as 1 in 200 in the sensitivity analysis. The trimester-specific Down syndrome risks were used to modify the num-ber of Down syndrome cases that would be identified
during each trimester, and eventually the number of Down syndrome children born in each arm of the analytic model.
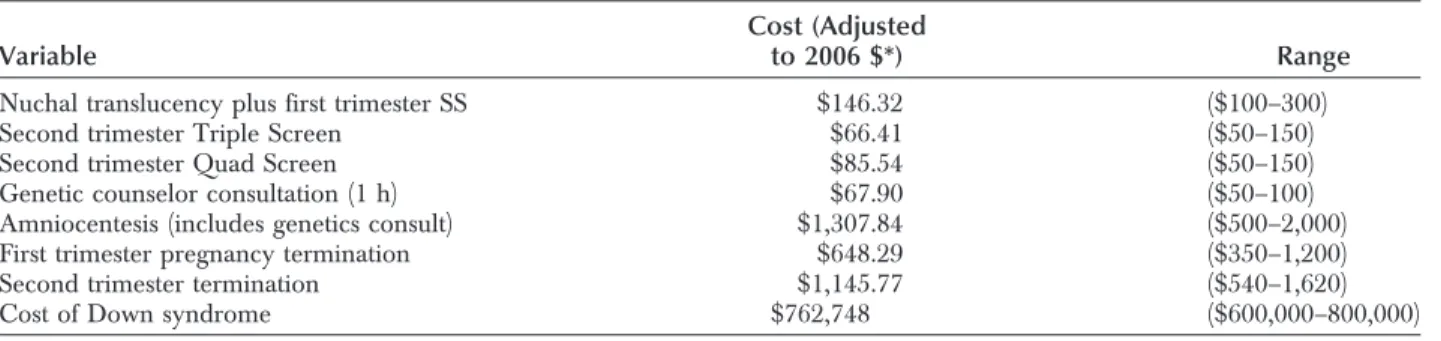
The costs of these outcomes and of the testing itself are estimates from the existing literature. All historical costs are inflated using the medical compo-nent of the consumer price index to the year 2006 dollars. All costs and benefits were discounted at a rate of 3%.15Specifically, the outcomes of procedure-related loss and Down syndrome were used in the cost– utility analysis. The costs10,12,16,17 (Table 2 and Table 3) used in this analysis were $146 for first-trimester screening, $66 for the second-first-trimester Tri-ple Screen, and $86 for a second-trimester Quad Screen. A consultation with a genetic counselor is estimated at $68, and if a diagnostic procedure is also done, the total cost is $1,308.18,19 Terminations of pregnancy done in the first and second trimester are $648 and $1,146, respectively.20The societal cost of raising and caring for an individual with Down
syn-Table 1. Input Variables in the Base-Case Analysis
Variable Probability from FASTER
First trimester risk of Down syndrome 0.002419 (92/38,033) Second trimester risk of Down syndrome 0.002497 (88/35,236) Third trimester risk of Down syndrome 0.002185 (77/35,236) Proportion of Down syndrome surviving to live birth 0.7027 (26/37) Proportion of women who obtained second trimester screening 87.9% overall
92.8% of first trimester screens Sensitivity of nuchal translucency plus serum screen 0.85 (0.80–0.90) False-positive rate of nuchal translucency 0.05 (0.026–0.095) Sensitivity of second trimester Triple Screen 0.69 (0.61–0.80) False-positive rate of second trimester Triple Screen 0.05 (0.03–0.097) Sensitivity of second trimester Quad Screen 0.81 (0.74–0.90) False-positive rate of second trimester Quad Screen 0.05 (0.03–0.119) Sensitivity of Serum Integrated Screen 0.86 (0.81–0.90 False-positive rate of Serum Integrated Screen 0.05 (0.03–0.081) Sensitivity of Fully Integrated Screen 0.95 (0.90–0.95) False-positive rate of Fully Integrated Screen 0.05 (0.017–0.05) Sensitivity of Contingent Screen 0.93 False-positive rate of Contingent Screen 0.043 Sensitivity of Sequential Screen 0.95 (0.91–0.97) False-positive rate of Sequential Screen 0.049 (0.02–0.098) Proportion of Women receiving nuchal translucency
where appropriates images failed to be obtained or were subsequently rejected at (wk)
10 3.1% fail, 7.4% rejected
11 2.6% fail, 3.1% rejected
12 3.2% fail, 2.3% rejected
13 5.5% fail, 2.9% rejected
Accept amniocentesis with screen positive 0.571, Range (0.33–0.90)
Younger than age 35 y 0.518
Age 35 y or older 0.616
Loss from amniocentesis 1 in 1,600⫽0.0006, Range (1 in 200 to 1 in 1,600) Proportion of women with Down syndrome who terminated pregnancy 51 in 52⫽0.981, Range (0.4–1.0) FASTER, First and Second Trimester Evaluation of Risk.
drome is $762,748.21,22This cost was only applied to Down syndrome children born.
To estimate the effect of the outcomes of proce-dure-related loss and Down syndrome, utility, a met-ric commonly used in cost-effectiveness analyses, was incorporated. Utility is a measure of the happiness (or unhappiness) generated from various outcomes. It is reported on a scale from 0 (death) to 1 (perfect health). The utilities used were previously measured by the standard gamble metric and were 0.93 for a procedure-related loss and 0.81 for the birth of a Down syndrome child and come from a single study of women’s preferences toward prenatal diagnostic outcomes.23,24 The utilities of the different outcomes were factored into the discounted life expectancies to generate quality-adjusted life years per standard tech-niques.25The utility for Down syndrome was multi-plied times the life expectancy, discounted at 3% to determine the decrease in quality-adjusted life years. The utility for a false-positive test was multiplied times a half-year discounted period to determine quality-adjusted life years lost. The utility decrement for any type of pregnancy loss, including a pregnancy termi-nation, was applied over a 2-year discounted period to determine quality-adjusted life years lost.
The analyses were run to obtain total costs, costs per Down syndrome diagnosed, and cost– utility ra-tios incrementally comparing the seven strategies. Strategies that were dominated, that is they cost more and led to worse outcomes than any other strategy, were eliminated from the incremental comparisons.
For cost- or quality-adjusted life year ratio, values less than $100,000 per quality-adjusted life year were considered cost-effective.25
Several sensitivity analyses were then performed. Univariable analysis was performed first, varying different inputs of the model. The Down syndrome screens’ sensitivities and false-positive rates were var-ied over ranges achieved in the FASTER trial. The rate of procedure-related losses was varied up to a loss rate of 1 in 200. The acceptance of amniocentesis and that of a termination of pregnancy were also varied over possible ranges. To examine the sensitivities and specificities achieved by first-trimester screening at 11, 12, and 13 weeks of gestation, the inputs were varied over the 3 weeks as well. When the ranges of outputs crossed above or below the different thresh-olds of cost-effectiveness, a threshold analysis was performed to find the input value that would just equal the threshold value for the output. After univa-riable analyses were performed, a Monte Carlo sim-ulation was performed, which varied all of the input distributions of the model simultaneously. To exam-ine the Stepwise Sequential screening strategy further, the false-positive rates of 2%, 5%, and 10%, with associated sensitivities, were examined separately within the model.
RESULTS
In the 38,033 women evaluated in the FASTER trial, the Contingent Sequential dominated (lower costs, better outcomes) all other screens (Table 4). For example, the Contingent Sequential Screen cost 32.3 million dollars while the other screens ranged from 32.8 to 37.5 million dollars. The Sequential strategy led to the identification of the most Down syndrome fetuses of all of the screens, but at a higher cost per Down syndrome case diagnosed ($719,675 compared with $690,427) as compared with the Contingent Sequential. Because of the lower overall false-positive
Table 2. Costs Used in Base-Case Analysis
Variable
Cost (Adjusted
to 2006 $*) Range
Nuchal translucency plus first trimester SS $146.32 ($100–300) Second trimester Triple Screen $66.41 ($50–150) Second trimester Quad Screen $85.54 ($50–150) Genetic counselor consultation (1 h) $67.90 ($50–100) Amniocentesis (includes genetics consult) $1,307.84 ($500–2,000) First trimester pregnancy termination $648.29 ($350–1,200) Second trimester termination $1,145.77 ($540–1,620) Cost of Down syndrome $762,748 ($600,000–800,000) SS, Stepwise Sequential.
* All costs inflated to 2006 dollars using medical consumer price index. Table 3. Utilities Used in Base-Case Analysis
Variable Utility Range
Utility of uncomplicated pregnancy 1.0
Utility of positive screening test 0.96 (0.93–0.99) Utility of procedure-related miscarriage 0.93 (0.89–0.97) Utility of pregnancy termination 0.91 (0.86–0.96) Utility of Down syndrome live birth 0.81 (0.75–0.87)
rate leading to fewer procedure-related miscarriages, the Contingent Sequential resulted in the highest quality-adjusted life years as well.
In the sensitivity analysis, when the rate of am-niocentesis after a positive screening test was varied from 33% to 90%, there was no difference in the ranking of the screening strategies. Of note, with an amniocentesis rate of 0.473 and below, the Quad Screen was no longer dominated by the Contingent Screen. However, the Contingent Screen remained cost-effective at $832 per quality-adjusted life year at this amniocentesis rate and increased to $18,381 per quality-adjusted life year at the amniocentesis rate of 0.33. When the rate of termination of a Down syn-drome fetus was varied from 40% to 100%, the model remained robust. At a termination rate of just below 80%, the Quad Screen became cheaper than the Contingent Sequential. Again, the Contingent Se-quential remained cost-effective between termination rates from 40% to 100% at $20,772 per quality-adjusted life year at a termination rate of 40%, $8,925 per quality-adjusted life year at a termination rate of 60%, and being cheaper at 80% to 100%. When the procedure-related miscarriage rate was varied to as high as 1 in 200, there was no difference in the cost-effectiveness ranking of the screening strategies, with the Contingent Sequential program dominating the other strategies.
To address the variance of the screening charac-teristics of first-trimester screening, models were cre-ated and analyzed at 11, 12, and 13 weeks of gesta-tion. This sensitivity analysis is fundamentally similar to varying the sensitivity and false-positive rates of each of the screening tests. Similar to that sensitivity analysis, at each given week the Contingent Sequen-tial was dominant, as it had been in the baseline analysis. Further, the robustness of the model per-sisted with sensitivity analysis of the costs and utilities used in the model when they were varied over theoretical ranges. Finally, a Monte Carlo simulation
examined the model by varying the various inputs simultaneously over their respective distributions over 38,033 trials. Again, the Contingent Sequential led to the lowest costs and best outcomes (P⬍.001).
Finally, when the false-positive rate of the Se-quential screening test was varied from 2% to 10%, the Contingent Sequential no longer dominated. In this sensitivity analysis, the 2% false-positive (1% at each step) and 10% false-positive (5% at each step) Sequential models were added to the analysis, and three of the strategies that had been dominated, triple Screen, first-trimester screen, and the integrated screen, were eliminated. The 2% false-positive (34.6 million dollars) and 10% false-positive (35.2 million dollars) Sequential strategies were both more expen-sive than the Contingent Sequential. However, the 2% false-positive Sequential led to slightly better out-comes and was marginally cost-effective as compared with Contingent Sequential, at $45,206 per quality-adjusted life year. The 2% false-positive Sequential remained marginally cost-effective as compared with the Contingent Sequential while varying the amnio-centesis rate, the termination rate, the procedure-related miscarriage rate, and the costs and utilities used in the models.
DISCUSSION
It is clear that in the United Kingdom, where first-trimester screening was first used on a large scale, it has become the de facto standard of care. The fre-quency of use of this screening strategy has acceler-ated in the United States, and is increasingly available clinically and can be anticipated to soon replace the current standard of care.26Thanks to multiple large population-based studies there is evidence to support this based on efficacy.3– 6However, with the financial limitations inherent in any healthcare system it is our responsibility to sift from the myriad different strate-gies the ones that are most cost-effective as well as acceptable to patients.
Table 4. Costs and Cost–Utility Analysis of Down Syndrome Screening Strategies
Screen Method
Costs in Millions of
2006 $ QALY
Incremental Cost–Utility Ratio Compared With Quad Screen
Triple Screen 37.5 Dominated
Quad 32.8 980,774
Combined first 35.2 980,777 $500,560/QALY
Integrated 34.5 980,820 $33,385/QALY
Serum Integrated 33.6 980,790 $42,188/QALY Stepwise Sequential 34.4 980,823 $29,524/QALY Contingent Sequential 32.3 980,832 Dominant QALY, quality-adjusted life years; Dominated, costs more with worse outcomes; Dominant, costs less with better outcomes.
First-trimester screening does have great appeal to patients and their families. It allows earlier reassur-ance if the results return normal, as they will in the vast majority of cases. If the results are abnormal, aneuploidy can be confirmed much earlier and preg-nancy termination completed in the first trimester. Also data from several studies suggest that use of the first-trimester results together with second-trimester serum screening can increase the detection rate for a given test-positive rate. It is therefore reassuring that our analysis documents that the Stepwise and Contin-gent are both cost-effective when compared with second-trimester screening strategies alone. Compar-ing the two, ContCompar-ingent dominates as it is anticipated that only a small proportion of patients would pro-ceed to second-trimester screening with a minimal drop in detection rate. However, by lowering the Stepwise false-positive rate to 2%, an improvement in overall outcomes is achieved because of the fewer procedure-related miscarriages and need for invasive testing. This improvement, which is small as com-pared with Contingent, comes at a cost of more than $45,000 per quality-adjusted life year. This increased cost to society, which is due both to the cost of screening all women in the second trimester and the small number of Down syndrome cases missed as compared with Contingent, is cost-effective, but only marginally so. Given that these two options are very close in both costs and outcomes, it may be that a compromise option which lowers the false-positive rate of the Contingent Screen may ultimately be the most cost-effective option. Further, as in all strategies, their performance depends on the patients’ compli-ance in completing the screening process as indicated. The current standard of care based on the Amer-ican College of Obstetricians and Gynecologists most recent Guidelines for Perinatal Care,27 the Triple Screen, has been superseded, based both on detection rate and cost-effectiveness. This should be an impetus to the umbrella organizations to accelerate the cre-ation of new guidelines. This is particularly the case because one of the strategies that is more cost-effec-tive than the Triple Screen, based on our data, is the Quad Screen. Importantly, this screening strategy does not require special training of practitioners and can be performed at centralized laboratories at the same gestational age as the Triple Screen is now. This makes it much more easily applicable to the general population across the country, including in areas where specialized ultrasound services may not be available. It also can be incorporated without a need for change in the timing routine of prenatal visits. Thus, it would seem that a reasonable approach
toward population screening would be to immedi-ately expand second-trimester screening by offering Quad screening as a population-wide strategy in which quality control would be easily achieved through centralized laboratories similar to the Cali-fornia State AFP program. However, because the Contingent and Sequential 2% false-positive screens lead to improved sensitivity over the Quad Screen at lower societal costs, the long-term strategy needs to include access to first-trimester screening for all patients.
Expanding access to first-trimester screening, particularly the nuchal translucency ultrasonogra-phy, will be the most challenging aspect of improv-ing the national standard. It has been repeatedly documented that quality control issues are most challenging with the ultrasonographic component of first-trimester screening, the nuchal translucency measurement. To this end the Fetal Medicine Foun-dation and the Society for Maternal–Fetal Medicine both have nuchal translucency credentialing pro-grams. In those areas where credentialed practitio-ners are available, the Contingent Screen would most likely offer the best balance of detection rate and cost-effectiveness and has maximal appeal to patients and their care providers. Of note, although we found that the contingent screening strategy seems to be the most cost-effective from a societal standpoint, individuals are likely to have specific preferences which differ from society as a whole. To those individuals, it might be best to use a screening strategy that maximizes sensitivity, min-imizes the false-positive rate, or skips over screen-ing altogether to obtain a diagnosis.
Our study is not without limitations. We used the sensitivities demonstrated by the FASTER trial. It is possible that a national screening program will not be able to achieve sensitivities this high. How-ever, because each of the combination first- and second-trimester screens that were the best in-cluded nuchal translucency, the test characteristics would change in a similar fashion, thus should not change the ranking of the cost-effectiveness of such programs. Further, we used estimates of societal costs rather than those faced by the patients. Be-cause patients face the up-front costs of screening if they do not have insurance coverage and generally don’t bear the high medical costs of having a child with Down syndrome, they may choose to forgo such screening rather than pay out of pocket. Using such societal costs is the standard in cost-effective-ness analyses and points the way toward the best use of resources. Thus, to encourage the most
cost-effective use of Down syndrome screening, societal coverage of these screening tests either through health care insurance or large, centralized screening programs should be implemented. Of note, we did not incorporate the cost of nuchal translucency quality assurance programs into our analysis, because data for cost is not readily avail-able. Although this potential cost increase could strengthen the position of “serum only” strategies, relative to the costs of nuchal translucency screen-ing, such programs are likely to add only a small percentage increase. Of note, we also used a loss rate due to amniocentesis that was lower than generally quoted in the broader literature. This was the loss rate seen in the FASTER trial; to ensure the robustness of our model, we did vary this rate to as high as 1 in 200 without a significant change in the ordering of the outcomes. Finally, the various other inputs used in the analysis are based on the existing literature and may not represent every geographic region of the country. However, to address this, we conducted sensitivity analyses, varying each of the inputs and found consistency in the outcomes of our models including the Monte Carlo simulation. It is critical to develop a cohesive national strategy regarding prenatal screening and diagnosis. Without this the uncontrolled proliferation and marketing of first-and second-trimester strategies or combinations thereof will not only make a priori genetic counseling regarding choices complex, but also make discussion of results a nightmare for patients and counselors. We hope that these data will give direction regarding the best use of the new strategies that are available, all of which are better than what patients have experienced in the past.
REFERENCES
1. Nicolaides KH, Azar G, Byrne D, Mansur C, Marks K. Fetal nuchal translucency: ultrasound screening for chromosomal defects in first trimester of pregnancy. BMJ 1992;304:867–9. 2. Wald NJ, Hackshaw AK. Combining ultrasound and
biochem-istry in first-trimester screening for Down’s syndrome. Prenat Diagn 1997;17:821–9.
3. Wald NJ, Rodeck C, Hackshaw AK, Walters J, Chitty L, Mackinson AM. First and second trimester antenatal screening for Down’s syndrome: the results of the Serum, Urine and Ultrasound Screening Study (SURUSS). J Med Screen 2003; 10:56–104.
4. Wapner R, Thom E, Simpson JL, Pergament E, Silver R, Filkins K, et al. First-Trimester screening for trisomies 21 and 18. N Engl J Med 2003;349:1405–13.
5. Avgidou K, Papageorghiou A, Bindra R, Spencer K, Nico-laides KH. Prospective first-trimester screening for trisomy 21 in 30,564 pregnancies. Am J Obstet Gynecol 2005;192:1761–7. 6. Malone FD, Canick JA, Ball RH, Nyberg DA, Comstock CH, Bukowski R, et al. First-trimester or second-trimester screening, or both, for Down’s syndrome. N Engl J Med 2005;353:2001–11.
7. Wald NJ, Watt HC, Hackshaw AK. Integrated screening for Down’s syndrome on the basis of tests performed during the first and second trimesters. N Engl J Med 1999;341:461–7. 8. Platt LD, Greene N, Johnson A, Zachary J, Thom E, Krantz D,
et al. Sequential pathways of testing after first-trimester screen-ing for trisomy 21. Obstet Gynecol 2004;104:661–6. 9. Benn P, Wright D, Cuckle H. Practical strategies in contingent
sequential screening for Down syndrome. Prenat Diagn 2005; 25:645–52.
10. Biggio JR Jr, Morris TC, Owen J, Stringer JS. An outcomes analysis of five prenatal screening strategies for trisomy 21 in women younger than 35 years. Am J Obstet Gynecol 2004;190:721–9. 11. Cusick W, Buchanan P, Hallahan TW, Krantz DA, Larsen JW
Jr, Macri JN. Combined first-trimester versus second-trimester serum screening for Down syndrome: a cost analysis. Am J Obstet Gynecol 2003;188:745–51.
12. Caughey AB, Kuppermann M, Norton ME, Washington AE. Nuchal translucency and first trimester biochemical markers for Down syndrome screening: a cost-effectiveness analysis. Am J Obstet Gynecol 2002;187:1239–45.
13. Snijders RJ, Sebire NJ, Nicolaides KH. Maternal age and gestational age-specific risk for chromosomal defects. Fetal Diagn Ther 1995;10:356–67.
14. Eddleman KA, Malone FD, Sullivan L, Dukes K, Berkowitz RL, Kharbutli Y, et al. Pregnancy loss rates after midtrimester amniocentesis. Obstet Gynecol 2006;108:1067–72.
15. Gold MR, Siegel JE, Russell LB, Weinstein MC, editors. Cost-effectiveness in health and medicine. New York (NY): Oxford University Press; 1996.
16. Wasserman Y. Physician’s fee reference. 14th ed. West Allis (WI): Medical Publishers, Ltd; 1997.
17. Vintzileos AM, Ananth CV, Smulian JC, Day-Salvatore DL, Beazoglou T, Knuppel RA, et al. Cost-benefit analysis of prenatal diagnosis for Down syndrome using the British or the American approach. Obstet Gynecol 2000;95:577–83. 18. 1995 National Limitations–Clinical Lab. Washington (DC):
Medi-care, U.S. Department of Health and Human Services; 1995. 19. Physician’s fee & coding guide. Augusta (GA): HealthCare
Consultants of America; 1995.
20. Henshaw SK. Factors hindering access to abortion services. Fam Plann Perspect 1995;27:54–9.
21. Centers for Disease Control and Prevention (CDC). Economic costs of birth defects and cerebral palsy—United States, 1992. MMWR Morb Mortal Wkly Rep 1995;44:694–699.
22. Waitzman NJ, Romano PS, Scheffler RM. Estimates of the economic costs of birth defects. Inquiry 1994;31:188–205. 23. Kuppermann M, Feeny D, Gates E, Posner SF, Blumberg B,
Washington AE. Preferences of women facing a prenatal diagnostic choice: long-term outcomes matter most. Prenat Diagn 1999;19:711–6.
24. Kuppermann M, Nease RF, Learman LA, Gates E, Blumberg B, Washington AE. Procedure-related miscarriages and Down syndrome–affected births: implications for prenatal testing based on women’s preferences. Obstet Gynecol 2000;96:511–6. 25. Caughey AB. Cost-effectiveness analysis of prenatal diagnosis:
methodological issues and concerns. Gynecol Obstet Invest 2005;60:11–18.
26. ACOG Committee Opinion No. 296: first-trimester screening for fetal aneuploidy. Obstet Gynecol 2004;104:215–7. 27. American Academy of Pediatrics. Guidelines for perinatal
care. 5th ed. Washington (DC): American College of Obste-tricians and Gynecologists; 2002.
APPENDIX
Members of the FASTER Research Consortium include K. Welch, MS, R. Denchy, MS (Columbia University, NY, NY); F. Porter, MD, M. Belfort, MD, B. Oshiro, MD, L. Cannon, BS, K. Nelson, BSN, C. Loucks, RNC, A. Yo-shimura (University of Utah, and IHC Perinatal Centers, Salt Lake City, Provo, and Ogden, UT); D. Luthy, MD, S. Coe, MS (Swedish Medical Center, Seattle, WA); D. Schmidt, MS, J. Esler, BS (William Beaumont Medical Center, Royal Oak, MI); G. Hankins, MD, R. Bukowski, MD, J. Lee MS, (UTMB Galveston, TX); K. Eddleman, MD, Y. Kharbutli MS (Mount Sinai Medical Center, NY, NY); I. Merkatz, MD, S. Carter, MS (Montefiore Medical
Center, Bronx, NY); J. Hobbins, MD, L. Schultz, RN (University of Colorado Health Science Center, Denver, CO); M. Paidas, MD, J. Borsuk, MS (NYU Medical Center, NY, NY); D. Bianchi, MD, B. Isquith, MS, B. Berlin, MS (Tufts University, Boston, MA); J. Canick, PhD, G. Lam-bert-Messerlian, PhD, C. Duquette, RDMS (Brown Univer-sity, Providence, RI); R. Baughman, MS (University of North Carolina, Chapel Hill, NC); J. Hanson, MD, F. de la Cruz, MD (National Institute of Child Health and Human Development); K. Dukes, PhD, T. Tripp, MA, L. Sullivan, PhD (DM-STAT, Inc, Medford, MA); N. Wald, MD, A. Hackshaw, MSc, A. Rudnicka, PhD (Wolfson Institute of Preventive Medicine).