i
68405
Revealed Comparative Advantage of
Pakistan’s Agricultural Exports
Khalid Riaz, Hans G.P. Jansen and Sohail Malik
Public Disclosure Authorized
Public Disclosure Authorized
Public Disclosure Authorized
ii
TABLE OF CONTENTS
Executive Summary ...iii
I. Introduction ... 1
II. The Concept of Revealed Comparative Advantage ... 1
III. Comparative Advantage of Pakistan’s Agriculture in the World Market... 3
III.1 Pakistan’s main agricultural export categories ... 3
III.2 Revealed comparative advantage in world markets ... 4
III. Disaggregated Analysis ... 5
IV.1 Livestock products ... 5
IV.1.1 Meat & meat preparations ... 5
IV.1.2 Dairy products and eggs ... 6
IV.2 Cereals and cereal preparations ... 6
IV.3 Vegetables and fruits ... 9
IV. Regional Revealed Comparative Advantage Indices ... 11
V.1 Defining regional markets ... 11
IV.2 Measuring regional revealed comparative advantage ... 12
V. Spatial Patterns of Revealed Comparative Advantage ... 13
VI.1 Meats and meat products... 13
VI.2 Cereals ... 15
VI.3 Vegetables ... 16
VI.4 Oranges and mandarins ... 16
VI.5 Other fruits and fruit preparations ... 17
VI. Bilateral trade between Pakistan and Neighboring Countries ... 18
VII.1 Afghanistan ... 18
VII.2 India ... 19
VII.3 Iran ... 20
VII.4 China ... 20
VII.Top Export Markets for Selected Products... 21
VIII.1 Mangoes ... 21
VIII.2 Kinnow mandarins ... 22
VIII.3 Dates ... 22
VIII. Summary, Conclusions and Recommendations ... 23
References ... 27
iii
Executive Summary
Pakistan is widely believed to be underperforming as far as its agricultural export potential is concerned. However, analyses to support this allegation are very few, in part due to the lack of easily accessible data. In this paper we provide the first necessary step in the analysis of Pakistan’s comparative advantage in agricultural export markets. We use Balassa’s measure of Revealed Comparative Advantage to determine the competitiveness of selected agricultural products in overseas export markets. Unlike many other studies that analyze comparative advantage only at the world level, we were able to access detailed data from the IMF that allowed us to determine the degree of competitiveness of Pakistan’s agricultural products in specific export markets. The results indicate that at the world market level Pakistan has a comparative advantage in cereals (especially rice) and horticultural products but not in livestock products. However, once specific markets and individual products are considered, the picture is considerably more nuanced. For example, Pakistani meat does have a comparative advantage in the relatively nearby Gulf countries and dairy products from Pakistan compete well in other South Asian countries. Cheese produced in Pakistan even has made an inroad into high-income countries such as the USA and Europe which demonstrates the potential of moving up the processing chain. For horticulture products a picture emerges that suggests that while several Pakistani products (vegetables, dates, mango) are able to compete in fresh form in nearby markets (South Asia, Gulf countries) they are not competitive in more distant markets (Europe, USA). This is not only due to more stringent SPS standards in these markets: lack of consistent and high-quality supplies, and poor marketing strategies also play a role. On the other hand processed horticultural products have had more success in these higher income markets. The case of citrus is special in the sense that Pakistan has a strong competitive edge in kinnow mandarins but not oranges. But despite Pakistan being the world’s largest exporter of kinnow mandarins, these have trouble entering developed country markets, possibly due to their excessive seed content. Pakistan’s strongest overall comparative advantage lies in Afghanistan where geographical proximity, cultural ties and the continuing conflict situation make consumers rely heavily on products from Pakistan.
Finally, this study is just a first step; more in-depth and market-and product-specific research will be needed to determine the specific investments and policy measures needed to increase Pakistan’s competitive advantage in promising export markets and expand its market share.
1
I.
Introduction
Many analysts of the Pakistan economy in general the agriculture sector in particular believe that the country is punching below its weight as far as agricultural export performance is concerned. Specifically it is often argued that Pakistan has a comparative advantage in a number of agricultural commodities but fails to exploit this advantage to its fullest potential in overseas markets.
However, little or no analysis has been done that sheds some more light on this issue, in the sense of better specifying in which commodities and which markets Pakistan’s comparative advantage is strongest. This paper attempts to start filling that void by quantifying the degree of comparative advantage of Pakistan agricultural export products in major overseas markets. This quantification is a necessary first step in getting a better handle on the factors that may limit the extent to which Pakistan is able to enter markets where it has a comparative advantage. Expansion of Pakistan’s share in overseas export markets is crucial for further development of the country’s agricultural sector.
The main objective of the paper is to identify products where Pakistan has demonstrated comparative advantage, and to provide a first step towards understanding the factors that at present limit possibilities for further exploiting that advantage. The paper analyzes actual export flows and calculates measures of revealed comparative advantage. The focus in this paper being on agricultural trade, the analysis is based on international trade data that incorporates a unique degree of detail not seen before in trade analyses for Pakistan.
II.
The Concept of Revealed Comparative Advantage
Revealed comparative advantage (RCA) indices offer a useful way of analyzing a country’s comparative advantage, based on demonstrated (i.e. actual) export performance. This contrasts with other popular measures such as the domestic resource costs coefficients (DRCs) that are considered indicators of potential comparative advantage and often used in ex-ante types of analysis of export possibilities.1
1 The DRC ratio of a traded product is the ratio of the domestic social costs of export production to
foreign exchange earned (Bruno, 1963). The numerator is domestic resources and non-traded inputs valued at their opportunity costs, and the denominator is the net foreign exchange earned or saved (i.e. value added) by producing the product domestically. The DRC can be loosely interpreted as “the domestic resources needed to generate one unit of foreign exchange”. Since output and tradable inputs are valued at border (world market) prices, a DRC ratio smaller than one is indicative of “efficient” national production giving the country a “comparative advantage” in the product in question.
2
The original RCA measure was proposed by Balassa (1965) who defined the export performance of a specific product/industry from a country – as measured by revealed comparative advantage index – as the relative share of the country’s export of the product in the world export of the same product, divided by the overall share of the country in world exports. More specifically, the revealed comparative advantage index of product j exported from country i (RCAji) can be expressed as follows:
RCAji = (Xji/Xjw) / (Xi/Xw) (1)
where
Xji = exports of product j from country i Xjw = world exports of the product j Xi = exports of country i
Xw = world exports
The RCA index ranges from 0 to infinity with 1 as the break-even point. That is, a RCA value of less than 1 means that the product has no export comparative advantage, while a value above 1 indicates that the product has a “revealed” comparative advantage.2 It should be noted that the RCA index is not symmetrical in the sense that one cannot compare both sides of the break-even point.3
The conceptual RCA index defined above is quite flexible in terms of both product definition and geographic coverage of the markets considered. Various definitions of the ‘product’ can be used to compute the value of the index. For the purposes of this paper, the Standard International Trade Classification (SITC4) was used because it allows products to be defined at various levels of aggregation. Moreover, the flexibility of the index with respect to geographic coverage means that relative export performance can be studied at global or at regional levels.
The analysis in this paper spans a ten year period from 1999-2008 and the data were obtained from IMF’s trade database.5
2 Note that RCA
ji can also be written as (Xji/Xi) / (Xjw/Xw) which when larger than one can be
interpreted as “country i has a revealed comparative advantage in product j because the share of product j in country i’s total exports exceeds the share of product j in total world exports”.
3 The aspect of symmetry was addressed by Laursen (1998).
4 The SITC system was developed by the UN in 1962 with the intention of classifying traded products
not only on the basis of their material and physical properties and stage of processing but also their economic functions in order to facilitate economic analysis. From 2007 onwards the SITC consists of 10 one-digit sections, 67 two-digit divisions, 262 three-digit groups, 1,023 four-digit groups, and 2,970 five-digit headings. Section “0” is “Food and Live Animals”. For detailed information see Shaw (2009).
5
3
III. Comparative Advantage of Pakistan’s Agriculture in the World
Market
III.1 Pakistan’s main agricultural export categories
For the purposes of this study, Pakistan’s agricultural exports were taken to be products listed under the SITC’s ‘Food and live animals’ (code=0) category. However, not all of the sub-categories of products listed under this code are equally important from the perspective of analyzing Pakistan’s trade performance. The following categories were therefore selected at the SITC 2-digit level:
01 - Meat and meat preparations 02 - Dairy products and birds' eggs 04 - Cereals and cereal preparations 05 - Vegetables and fruit
Each of these categories has several sub-categories and more than 20 disaggregated products were considered for this study. On the other hand, in this preliminary investigation also some other agricultural products were excluded. Among these are cotton (SITC code 263) which is a key cash crop in Pakistan; fish (SITC code 03); hides and skins (SITC code 21); and cut flowers and foliage (SITC code 292.7). But while some of these are important products in the domestic market, their share in agricultural exports is relatively low.
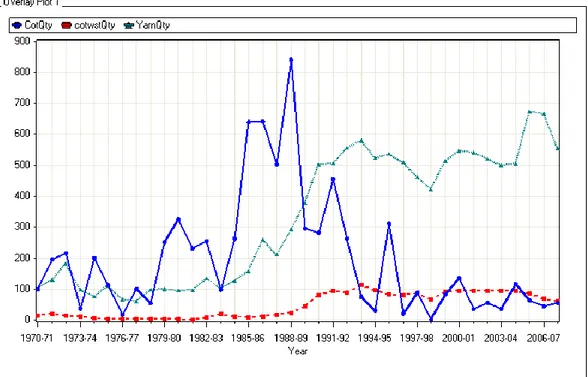
In this regard, the case of cotton is particularly interesting. Cotton exports declined drastically over time (see Figure 1) as the domestic textile sector absorbed an increasingly large share of domestic cotton production. However, moving up the value addition chain is only part of the more complex cotton situation in Pakistan. The other and perhaps more revealing aspect is that export performance deteriorated because cotton output stagnated, and even declined in some years, leading to progressively smaller and eventually vanishing exportable surpluses. The main reasons behind output stagnation were the leaf curl virus and other pest attacks, and country’s slow and unregulated adoption of BT cotton. Unlike India which has rapidly transformed itself into the second-largest exporter of cotton in the world, Pakistan’s cotton exports have been lagging. Pakistan’s cotton and textile economy has been the subject of a detailed recent study (Cororaton and Orden, 2008) and will receive no further attention in this paper.
4
Figure 1: Pakistan exports of cotton and cotton products
Source: Pakistan Economic Survey 2007-08
III.2 Revealed comparative advantage in world markets
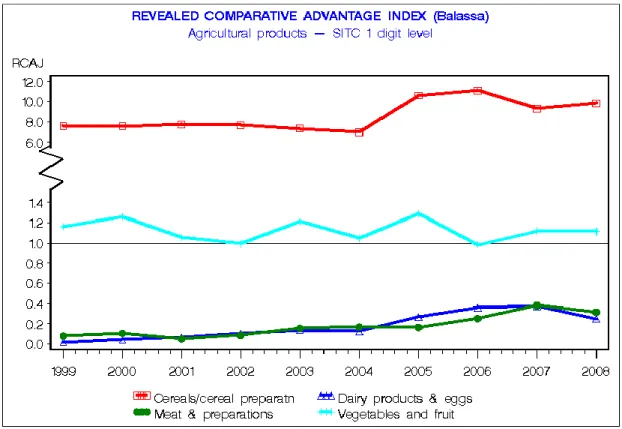
Figure 2 presents the evolution of the RCA index over the period 1999-2008 for all SITC 1-digit level agricultural products mentioned above. Over the last decade Pakistan did not enjoy relative comparative advantage in livestock products. The RCA index for ‘Meat & meat preparations’ and for ’dairy products & eggs’ did not exceed 0.4 which is significantly lower than the threshold level of 1.0. Given that Pakistan has a large bovine population and the country is the fourth largest producer of fresh milk in the world, the low levels of relative export performance in this product category merit close attention.
The RCA index for the ‘vegetable and fruits’ group remained above 1.0 throughout the decade (Figure 2). This suggests a revealed comparative advantage in the export of these products, which is according to expectations given Pakistan’s favorable agro-climatic conditions for horticulture production. However, a wide range of products originating from different regions in the country are included in this group. Therefore, identification of key export products among them is required in order for the analysis to have practical implications. An equally important issue concerns the export performance of specific products in specific markets. Both issues will be addressed in the more disaggregated analysis below.
5
During the previous decade, Pakistan also enjoyed a substantial comparative advantage in ‘cereals and cereal preparations’ (Figure 2). The RCA index for this category fluctuated between 7.0 and 11.0. The two key cereals in Pakistan are wheat and rice. Wheat is the main staple food in Pakistan and while rice is consumed mainly in rice growing districts, most rice is exported. Pakistani rice is of two types – the premium basmati rice, and the regular IRRI rice varieties. Unfortunately, the SITC data do not provide a break-up by type of rice. Apart from cereals (grains) the ‘cereals and cereal preparations’ group also includes cereal preparations, especially those made from wheat.
Figure 2: Relative export performance of main agricultural products
Source: Calculations based on IMF data
III.
Disaggregated Analysis
IV.1 Livestock products
IV.1.1 Meat & meat preparations
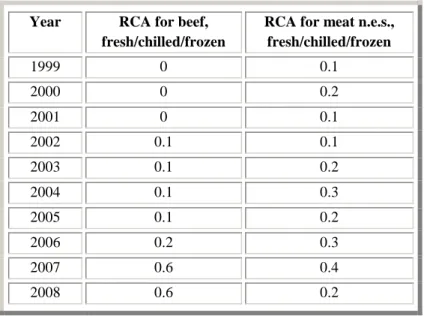
A more disaggregated analysis of the meat & meat preparations category was conducted for selected products at the three digit level including ‘Beef, fresh/chilled/frozen’ (SITC 011) and ‘Meat n.e.s., fresh/chilled/frozen’ (SITC 012). The RCA index for meat (012) did not exceed 0.4 throughout the decade (Table 1). The relative export performance of beef products (011) was similar to that of meat for most of the period under review even though RCA index values reached 0.6 by 2007.
6
More data are needed to determine if this trend can be sustained. The analysis of RCA in individual trading partner markets in section IV.1 below sheds more light on future export prospects for beef products.
Table 1 RCA values for beef and meat
Year RCA for beef,
fresh/chilled/frozen
RCA for meat n.e.s., fresh/chilled/frozen 1999 0 0.1 2000 0 0.2 2001 0 0.1 2002 0.1 0.1 2003 0.1 0.2 2004 0.1 0.3 2005 0.1 0.2 2006 0.2 0.3 2007 0.6 0.4 2008 0.6 0.2
IV.1.2 Dairy products and eggs
The RCA index for dairy products and eggs was consistently low throughout the decade even at the disaggregated level, except for 2002 when the RCA index for exports of the sub-category ‘Eggs, albumin’ (SITC 025) reached a value of 0.8. However, this momentum was lost in subsequent years and the RCA index had dropped to almost zero by 2008. The picture is somewhat more optimistic with respect to the sub-category ‘milk and cream and milk products other than butter or cheese’ (SITC 022) whose the RCA index reached a value of 0.7 in the second half of the past decade. Even though at the world market level Pakistani dairy products and eggs do not seem to have a competitive advantage, the situation is different once specific export markets are considered (see section VI.1 below).
IV.2 Cereals and cereal preparations
As noted earlier, Pakistan enjoys significant revealed comparative advantage in the production of cereals. However, it is necessary to look separately at the performance of wheat and rice and to disentangle asymmetric effects of domestic demand on their respective export performances.
Pakistani rice (SITC 042) exhibited a strong export performance during the past decade as evidenced by the RCA index of between 45 and 146. The highest values occurred towards the end of the decade – a period marked by the international
7
commodity price boom.6 A significant feature of this period consisted of the restrictions on rice exports by many exporting countries in an attempt to protect domestic consumers. Since the main staple food in Pakistan is wheat, increases in domestic rice prices did not quite have the same implications. Pakistan is a rice exporter and was able to increase its share in the thin international rice market as international supplies from competitors were reduced.
Table 2 RCA values for rice
Year RCA rice
1999 48.9 2000 56.3 2001 49.3 2002 44.8 2003 54.0 2004 50.8 2005 70.6 2006 75.5 2007 65.1 2008 146.0
Compared with rice, the relative export performance of wheat and wheat products is more complex. During the past decade the number of years in which Pakistan was a net wheat importer exceeded the number of years in which the country was a net wheat exporter (Figure 3). The huge increase in the value of wheat imports in the year 2008 was to a significant extent due to tripling of international wheat prices (World Bank, 2010).
Figure 3 Pakistan’s wheat trade 1999-2008
6
The export performance of rice was particularly strong during 2008 helped by the huge price increases of rice in the world market. See World Bank (2010).
-200,000 400,000 600,000 800,000 1,000,000 1,200,000 1,400,000 1,600,000 1,800,000 1999 2000 2001 2002 2003 2004 2005 2007 2008 Years
SITC 041: Wheat / meslin
Exports / Imports ($ 000)
8
Despite this erratic export performance, RCA indices for wheat (SITC 041) are significantly above 1 for four out of the nine years between 1999-2008, with the highest value of 5.6 recorded in the year 2002 (Table 3). The main reason for the fact that Pakistan’s revealed comparative advantage in wheat is significant while unstable at the same time, is that although the country is a large wheat producer (wheat production was 23.1 million tons in 2007-08) it also has a large and rapidly growing population (170 million) to feed. As a result even relatively small discrepancies in supply and demand can not only significantly change the value of the RCA index but also reverse trade flows altogether.
The other important issue relates to the largely undocumented wheat exports to Afghanistan. Wheat is routinely smuggled to Afghanistan from Pakistan in addition to any official exports. During 2007-08 the gap between Pakistani domestic and other countries’ domestic prices of wheat became increasingly large and sizable flows of wheat to neighboring countries (Afghanistan in particular) took place. Therefore RCA estimates that rely on official figures only (such as ours) tend to underestimate the relative export performance of Pakistan’s wheat sector. On the other hand, given that wheat prices have come down substantially after 2008, sustained increase in yields would be required to consolidate the comparative advantage in wheat.
Table 3 RCA indices for wheat and wheat products Year RCA wheat /meslin RCA flour/meal
wheat/meslin 2000 0.2 2.1 2001 1.8 15.3 2002 5.6 19.4 2003 1.6 15.2 2004 0 14.9 2005 - 25.6 2006 - 34.3 2007 2.4 20.5 2008 0.5 0.3
In addition to wheat grain, Pakistan also exports wheat flour. Data for the sub-category flour/meal wheat/meslin (SITC code 046) suggest that Pakistan enjoys a substantial RCA. Except for 20087, the RCA index for wheat flour exports was consistently above 1. In fact, in nearly all years the value of RCA index for this sub-category exceeded 15, with a highest value of 34.3 in 2003.
7
However, since only data regarding official exports are available, the RCA value for 2008 is likely to be an underestimate.
9
Considered together with the export performance of wheat grains, the strong comparative advantage of wheat flour exports raises a number of questions. For wheat flour to have greater revealed comparative advantage than wheat grains, either the wheat milling sector has to be efficient, or there have to be market distortions that influence trade flows. Pakistan’s wheat milling sector is widely recognized to be substantially over-capitalized and therefore cannot be considered very efficient. Many mills receive wheat at officially controlled release prices that includes a substantial subsidy element. This issue is explored further in the discussion regarding bilateral trade between Pakistan and neighboring countries in section VII.1 below.
IV.3 Vegetables and fruits
As mentioned above, Pakistan is widely considered to have a comparative advantage in horticulture production (SITC code 05). This is indeed confirmed by the average value of the RCA index of 1.13 during 1999-08 (see also Figure 2). Figure 4 separates out vegetables (SITC code 054) and fruits (SITC code 057). For the period 1999-2008 the average RCA index for vegetables was 1.2 and that for fruits was 1.75. Thus Pakistan had revealed comparative advantage in both vegetables and fruits but its competitiveness is stronger in the latter.
Figure 4 RCA indices for vegetables and fruits
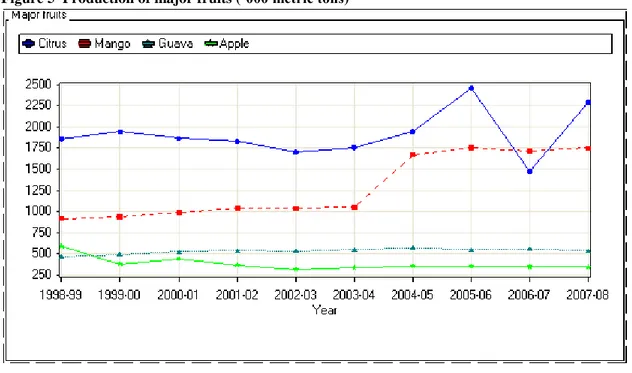
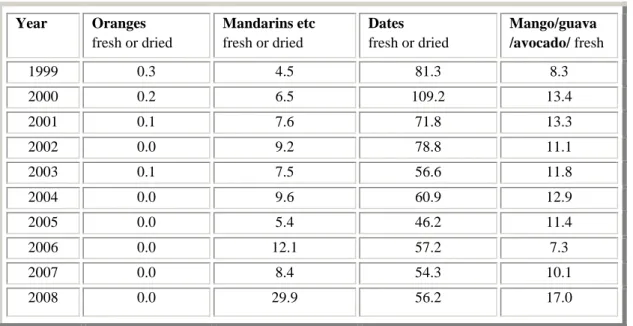
Pakistan’s major fruits include citrus, mangoes, dates, guava and apples. The production of citrus and mango exceeds that of other fruits8 and dominates Pakistan’s fruit exports (Figure 5). Pakistan produces a wide range of citrus varieties including several types of oranges (SITC code 05711 and consisting of several varieties such as
8 Over the 1999-08 period average annual production of citrus, mango, guava and apple was
respectively 1.9, 1.3, 05 and 0.4 million MT approximately; the combined annual average production of banana, apricot, and grapes during the same period was about 0.4 million MT.
Revealed Comparative Advantage Vegetables & fruits
0 0.5 1 1.5 2 2.5 1999 2000 2001 2002 2003 2004 2005 2006 2007 2008 Years RC A inde x Fruit/nuts, fresh/dried Vegetables, frsh/chld/frz
10
Succri, Mausami, Washington Navel, Jaffa, Red Blood, Ruby Red and Valencia Late) and mandarins (SITC code 05712).9 The latter consist mainly of the Kinnow variety which dominates citrus exports and indeed the relative export performance of other citrus species (oranges) is poor (Table 4). The increasing RCA values for mandarin (Kinnow) in recent years point towards growing prospects for trade expansion.
Figure 5 Production of major fruits (‘000 metric tons)
Pakistan is the world’s fourth largest producer and the second largest exporter of dates (SITC code 05796) (Jalbani, 2003). Not surprisingly the RCA analysis indicates that Pakistan enjoys a significant revealed comparative advantage in this fruit (RCA index varied between 46.2 and 109.2 during the period 1999-2008). Dates are grown throughout Pakistan and each region has its own varieties: Aseel, Karbala, Fasli, and Kupro date varieties are found in Sindh province; Balochistan province’s varieties include Begum Jangi, Muzawati, Jann Swore, Kehraba and Rabai; while Dhakki and Gulistan varieties are produced in North West Frontier Province (NWFP).
Finally, Pakistan is an important producer and exporter of mangoes (SITC code 5797). Although SITC code 5797 lumps mango, guava and avocados, Pakistani exports under this category consist largely of mangoes. Pakistan’s relative export performance in this category is quite strong (Table 4).
9
11
Table 4 RCA values for selected fruits
Year Oranges fresh or dried Mandarins etc fresh or dried Dates fresh or dried Mango/guava /avocado/ fresh 1999 0.3 4.5 81.3 8.3 2000 0.2 6.5 109.2 13.4 2001 0.1 7.6 71.8 13.3 2002 0.0 9.2 78.8 11.1 2003 0.1 7.5 56.6 11.8 2004 0.0 9.6 60.9 12.9 2005 0.0 5.4 46.2 11.4 2006 0.0 12.1 57.2 7.3 2007 0.0 8.4 54.3 10.1 2008 0.0 29.9 56.2 17.0
IV.
Regional Revealed Comparative Advantage Indices
V.1 Defining regional markets
This section introduces a spatial dimension into the analysis by calculating RCA indices for key regional export markets for key agricultural products from Pakistan. For this purpose, a regional classification of countries was developed based on the UN regional classification and other major economic groupings. The economic groupings selected were the European Union (EU), South Asian Association for Regional Cooperation (SAARC), Association of South East Asian Nations (ASEAN) and the Gulf Cooperation Council (GCC).
Some of the regional groupings such as the EU have highly uniform trade policies and no barriers to trade between member states. Other economic groupings have varying degrees of common trade policies. For example, while SAARC member countries are gradually introducing preferential trade arrangements for other members under the South Asia Free Trade Agreement (SAFTA), many obstacles remain (for an in-depth discussion of SAFTA, see Chapter III in World Bank 2010). In most cases, however, countries within a particular regional grouping have some common characteristics. For example, the EU is dominated by highly developed industrial economies and a number of economies in transition; ASEAN comprises mostly newly industrialized countries; and GCC is a grouping of oil-rich Middle Eastern states. These common characteristics generate similar demand patterns that provide a strong rationale for constructing regional (synthetic) RCA indices.
12
In addition to economic groupings, countries were also classified based on their respective geographic sub-regions. These sub-regional groups included Central Asia, North Africa, Sub-Saharan Africa and Latin America. Broad similarities in levels of economic development and other geographic characteristics within sub-regions provide some justification for this classification.
Partial overlap of economic groupings and regions made it necessary to classify countries in a sub-region that were not in the relevant regional economic grouping into ‘Rest of’ regional groups. The latter include Rest of East Asia (RO EASTASIA), Rest of Europe (RO EUROPE), Rest of Middle East (RO Middle East) and Rest of the World (RO World). Finally, some large countries were treated as entirely separate markets including USA, China, Japan, Russian Federation, Australia, Canada and Mexico.10
IV.2 Measuring regional revealed comparative advantage
The RCA index presented earlier in Section II (equation (1)) uses the world market as the reference market. In order to enable disaggregation of the analysis of revealed comparative advantage at the regional and bilateral levels, equation (1) was adapted as follows:
R R R RCAji X ji Xi X ji Xi (2)Here RCA jiR is the revealed comparative advantage index for exports of product j from country i into region R, and
R
X ji = Exports for product j from country i to region R
R
X i = Exports of country i to region R
X ji = Total exports of product j from country i X i = Total exports of country i
If RCA jiRexceeds one then we conclude that the country i has a comparative advantage in the export of product j to the reference market R. This is so because a
10
Mexico was taken as a separate market because the remaining two North American countries – USA and Canada – were similarly treated. The other possibility would have been to lump together all three as North American Free Trade Agreement (NAFTA) countries. However, the size of the US market and the importance of its trade relations with Pakistan weighted in against doing this.
13
value of this index greater than unity implies that the share of product j in country i’s exports to region R exceeds the share of product j in the country’s total exports.11 The reference market may be a region such as the EU or SAARC, or alternatively it could be a single country such as the USA or UAE.
V.
Spatial Patterns of Revealed Comparative Advantage
Having defined regional RCA in the previous section, the current section present patterns of comparative advantage for main categories of Pakistani agricultural exports with a view to identify product and market combinations where relative export performance has been demonstrably strong. The various tables in this section mention only those regions where Pakistani export products have a revealed comparative advantage (i.e. markets where RCA values exceed 1).
VI.1 Meats and meat products
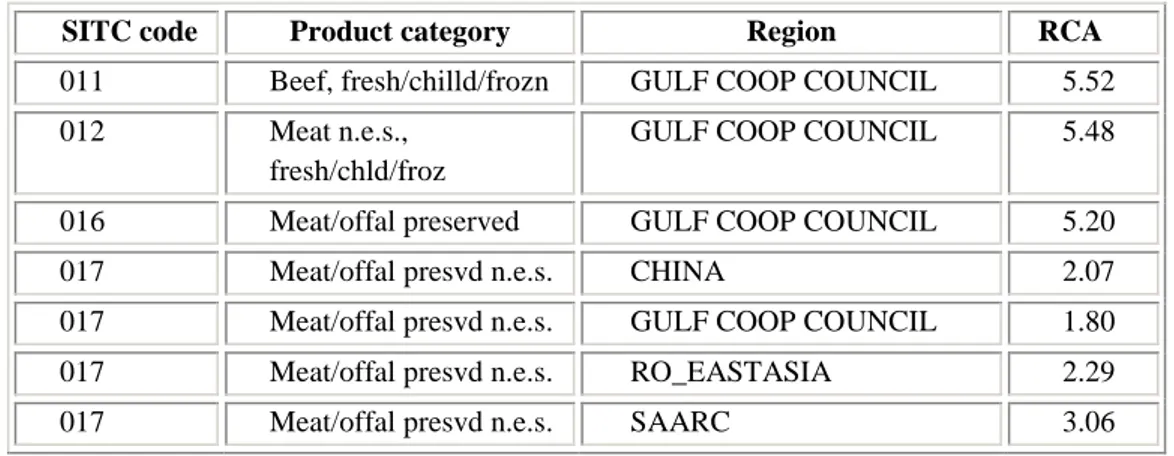
Although livestock contributes over half of Pakistan’s agricultural GDP, the country does not have a worldwide comparative advantage in meat and meat products (see Table 1 in section IV.1 above). Low productivity in the livestock sector, sizeable domestic demand, and the inability to meet overseas SPS requirements are some of the factors that explain the modest export performance. However, once comparative advantage is analyzed on a regional basis, it turns out that beef and meat exports from Pakistan do enjoy a comparative advantage in the GCC region with RCA indices exceeding 5 for both product categories (Table 5). This can largely be explained by the geographical proximity of the GCC region to Pakistan. In addition various types of meat offal find good markets in China and East Asia.
11 Note that RCAR
ji can also be written as (XRji/Xji)/(XRi/Xi) which resembles Balassa’s original
measure but narrows it down to the RCA of a country (in this case Pakistan) in a particular geographical area (in this case region R).
14
Table 5 Regional RCA of Pakistani meat products in different regions
SITC code Product category Region RCA
011 Beef, fresh/chilld/frozn GULF COOP COUNCIL 5.52
012 Meat n.e.s.,
fresh/chld/froz
GULF COOP COUNCIL 5.48
016 Meat/offal preserved GULF COOP COUNCIL 5.20
017 Meat/offal presvd n.e.s. CHINA 2.07
017 Meat/offal presvd n.e.s. GULF COOP COUNCIL 1.80
017 Meat/offal presvd n.e.s. RO_EASTASIA 2.29
017 Meat/offal presvd n.e.s. SAARC 3.06
Table 6 indicates that the dairy products and eggs category (SITC code 02) have strong revealed comparative advantage in the SAARC market only. The same is true for SITC code 022 which mainly consists of milk powder. On the other hand, a number of other sub-categories representing processed dairy products (milk powder, butter, cheese and curd) also enjoy a comparative advantage in several other markets, including some in developed countries. For example, butter, cheese and curd products (SITC codes 022 and 023) have strong revealed comparative advantage in both SAARC and GCC regions with the RCA measure approaching 4 in both cases. This is followed by good relative export performance in East Asia (non-ASEAN countries). But perhaps even more importantly, Pakistani exports of butter, cheese and curd enjoy a certain degree of comparative advantage in the high-income EU and US markets where consumers are particularly quality-conscious. This suggests that moving up the processing chain can allow penetration into markets of high-income regions.
Table 6 Regional RCA of dairy products&eggs and sub-categories
SITC code Product category Region RCA
02 Dairy products & eggs SAARC 4.57
022 Milk products excl
buttr/cheese
SAARC 5.07
023 Butter and cheese EU 1.08
023 Butter and cheese GULF COOP COUNCL 1.63
023 Butter and cheese RO_ESTASIA 2.47
023 Butter and cheese SAARC 2.93
024 Cheese and curd GULF COOP COUNCL 3.75
024 Cheese and curd USA 1.41
025 Eggs, albumin GULF COOP COUNCL 1.23
025 Eggs, albumin RO_MIDEAST 1.27
15
VI.2 Cereals
Although Pakistan is a large producer of wheat, it is not a significant wheat exporter mainly because of high domestic demand. Nevertheless, wheat exports to Afghanistan – through official and informal channels – take place on a regular basis, mainly driven by Afghanistan’s traditional (but highly variable) food grains deficit and Pakistan’s relative geographic proximity.12
This situation is reflected in the relatively high value of the RCA index of 2.4 for the SAARC region a whole (Table 7).
Table 7 Regional RCA for cereals
SITC code Product category Region RCA
041 Wheat/meslin ASEAN 1.37
041 Wheat/meslin GULF COOP COUNCIL 1.21
041 Wheat/meslin NORTHAFRICA 1.16
041 Wheat/meslin SAARC 2.42
041 Wheat/meslin SUBSAHAFRICA 1.71
042 Rice GULF COOP COUNCIL 2.31
042 Rice SUB SAHARAN AFRICA 1.10
043 Barley grain GULF COOP COUNCIL 1.96
043 Barley grain SAARC 4.54
044 Maize except sweet corn. ASEAN 3.86
044 Maize except sweet corn. GULF COOP COUNCIL 1.95
044 Maize except sweet corn. RO_WORLD 6.36
044 Maize except sweet corn. RO_WESTASIA 1.27
044 Maize except sweet corn. SAARC 1.59
Rice is Pakistan’s largest food export earner. From a regional perspective, promising export destinations for this product are in Middle East and sub-Saharan Africa (Table 7). However, at a more disaggregated level there are several individual countries that are good markets of Pakistani rice, as will become clear from the discussion of bilateral RCA indices in section VII below.
Over the last decade, maize productivity in Pakistan has been on an upward trend mainly due to the increased use of hybrid seeds. Table 7 shows that the RCA index for maize is highest in “Rest of the World” region (6.36), followed by the ASEAN region (3.86) and the Gulf countries (1.95). Just like rice the export performance of Pakistani maize in high income country markets is also fairly robust (see section VII).
12
The links between food security in Pakistan and Afghanistan are discussed in detail in World Bank (2010).
16
Barley grain exports seem largely to result from the proximity advantage in the SAARC (mainly Afghanistan) and GCC markets.
VI.3 Vegetables
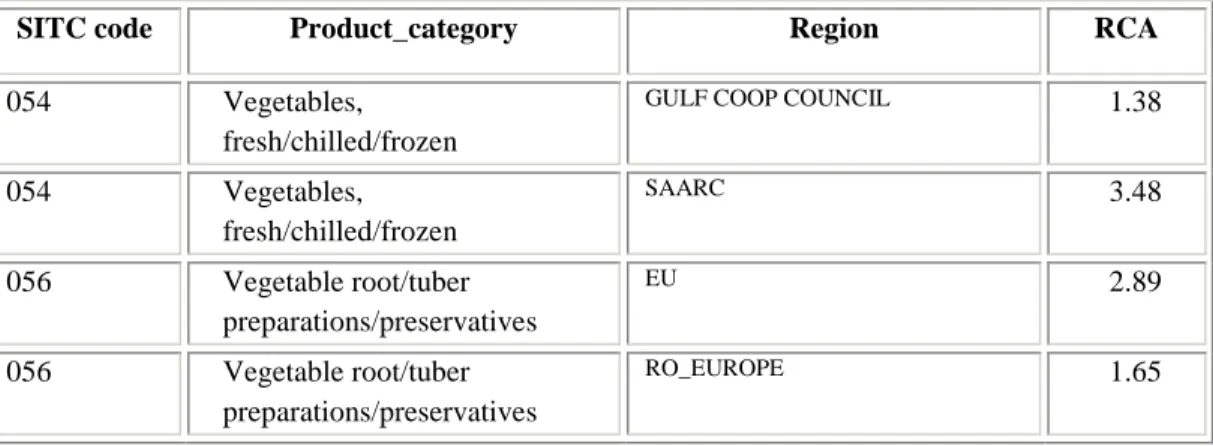
Exports in the fresh, chilled, and frozen vegetable category (SITC code 054) show revealed comparative advantage in South Asian and Gulf countries (Table 8). This pattern of revealed comparative advantage is a result of the transport cost advantage, limitations imposed by perishability of vegetables, and relatively lower SPS standards in these markets. At the same time the latter two factors also prevent exports to farther away (but higher value) markets in Europe and North America, at least for the time being. The transport cost advantage of Pakistani vegetable exports is less in the Gulf than within South Asia which is reflected in a lower value of the RCA index.
Table 8 Regional RCA for vegetables and processed vegetable products
SITC code Product_category Region RCA
054 Vegetables,
fresh/chilled/frozen
GULF COOP COUNCIL 1.38
054 Vegetables, fresh/chilled/frozen SAARC 3.48 056 Vegetable root/tuber preparations/preservatives EU 2.89 056 Vegetable root/tuber preparations/preservatives RO_EUROPE 1.65
Processed vegetable products not only have much longer shelf life and are less bulky, but the higher degree of processing also makes it possible to conform to more stringent quality requirements. Vegetable preparations and preserved vegetables enjoy relatively strong comparative advantage in the EU and non-EU European markets. This again underscores the fact that processing can help opening up markets in more developed countries.
VI.4 Oranges and mandarins
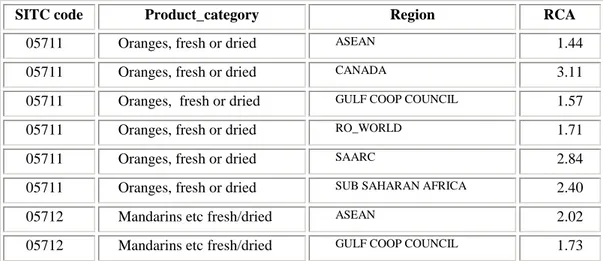
Pakistan is the largest exporter of Kinnow mandarin in the world. On the other hand, exports of (sweet) oranges are relatively minor, and strong export performance of Kinnow is limited to regional markets in the ASEAN and Gulf countries (Table 9).
17
Table 9 Regional RCA for oranges and mandarins
Outside of these regions there are individual country markets such as Iran where Kinnow exhibits strong relative export performance (see section VII). However, the strong revealed comparative advantage of Kinnow does not seem to exist in developed country markets. The reasons for this are more stringent SPS requirements, higher degree of bitterness in taste compared to oranges, and large numbers of seeds in the fruit.
VI.5 Other fruits and fruit preparations
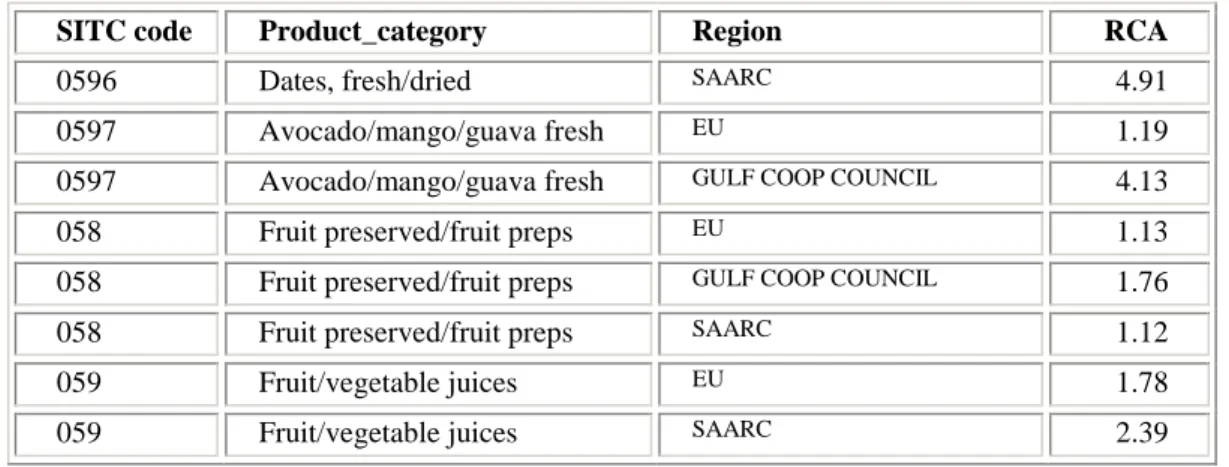
Pakistan has a substantial comparative advantage in the export of dates (SITC code 0596) to countries in the SAARC region (Table 10). In the case of Pakistan the category fresh ‘avocado/mango/guava’ (SITC code 0597) represents primarily mango exports. The revealed comparative advantage in this category is strong in markets in Europe and the Gulf countries (Table 10). For Pakistan this is the only example of a product with a rather modest level of processing13 that has strong revealed comparative advantage in developed country markets. This is attributable to the high quality of mango varieties grown in Pakistan. On the other hand, equally noteworthy is the fact that similar inroads have not been made into the US market, possibly due to more stringent SPS requirements and transport disadvantages. It has been observed that mangoes from Pakistan have ‘excellent eating qualities’ but inconsistent quality and relatively short shelf life (see e.g. Jansen 1991). As a result Pakistan mangoes fetch relatively low prices even in high quality markets (Collins et al., 2006). Table 10 also shows that preserved fruits, fruit preparations, and fruit juices have substantial revealed comparative advantage in the high income EU and GCC markets.
13
Mango processing largely consists of grading, cleaning, and packaging.
SITC code Product_category Region RCA
05711 Oranges, fresh or dried ASEAN 1.44
05711 Oranges, fresh or dried CANADA 3.11
05711 Oranges, fresh or dried GULF COOP COUNCIL 1.57
05711 Oranges, fresh or dried RO_WORLD 1.71
05711 Oranges, fresh or dried SAARC 2.84
05711 Oranges, fresh or dried SUB SAHARAN AFRICA 2.40
05712 Mandarins etc fresh/dried ASEAN 2.02
18
Table 10 Regional RCA for mangoes, other fruits, and fruit preparations
SITC code Product_category Region RCA
0596 Dates, fresh/dried SAARC 4.91
0597 Avocado/mango/guava fresh EU 1.19
0597 Avocado/mango/guava fresh GULF COOP COUNCIL 4.13
058 Fruit preserved/fruit preps EU 1.13
058 Fruit preserved/fruit preps GULF COOP COUNCIL 1.76
058 Fruit preserved/fruit preps SAARC 1.12
059 Fruit/vegetable juices EU 1.78
059 Fruit/vegetable juices SAARC 2.39
VI.
Bilateral trade between Pakistan and Neighboring
Countries
This section presents and discusses patterns of revealed comparative advantage with Pakistan’s principal neighbors: Afghanistan, China, India and Iran.
VII.1 Afghanistan
Pakistan provides the main transit trade route for land-locked Afghanistan. The most diversified pattern of comparative advantage of Pakistani products exists in the Afghan market (Table 11). Wheat flour has a RCA index value of 33. Grains from Pakistan, particularly wheat, also have strong comparative advantage in Afghanistan as indicated by RCA index values in the high teens and twenties. Although the RCA index value of 2.0 for rice indicates comparative advantage, the value is an order of magnitude smaller than that for other grains, reflecting preferences of the Afghan population that consumes mostly wheat. Milk powder is another product with a very high comparative advantage. Strong revealed comparative advantage is also evident in a range of processed products including butter and cheese, fruit/vegetable juices, preserved fruits and fruit preparations.
19
Table 11 RCA with Afghanistan
SITC code Product category RCA
017 Meat/offal preserved n.e.s. 11.6
022 Milk products excluding butter/cheese 34.9
023 Butter and cheese 29.1
025 Eggs, albumin 18.4
041 Wheat/meslin 17.0
042 Rice 2.1
043 Barley grain 29.8
044 Maize except sweet corn 16.0
045 Cereal grains n.e.s. 20.1
046 Flour/meal wheat/meslin 33.2
047 Cereal meal/flour n.e.s. 9.9
048 Cereal etc flour/starch 4.4
054 Vegetables, fresh/chilled/frozen 4.0
058 Fruit preserved/fruit preparations 3.9
059 Fruit/vegetable juices 9.6
05712 Mandarins etc fresh/dried 1.7
VII.2 India
India is a huge potential market where Pakistan enjoys a transportation cost advantage. The figures in Table 12 indicate the products with the strongest revealed comparative advantage: these include dates, vegetables and fruits (especially oranges). Exports of fruit and vegetable juices to India have shown a growing revealed comparative advantage since 2004.
Table 12 RCA with India
SITC code Product category RCA
023 Butter and cheese 1.9
025 Eggs, albumin 3.1
041 Wheat/meslin1 9.9
054 Vegetables, fresh/chilled/frozen 26.0
057 Fruit/nuts, fresh/dried 30.2
059 Fruit/vegetable juices 2.4
05711 Oranges, fresh or dried 14.8
05796 Dates, fresh/dried 90.4
1
20
VII.3 Iran
Rice exports provide a degree of stability to the otherwise rather erratic pattern of Pakistani exports to Iran (Table 13). Over the past decade, the RCA index for rice has been consistently high with an average of around 9, indicating strong revealed comparative advantage of Pakistani rice in Iran.
Table 13 RCA with Iran SITC
code
Product category RCA
042 Rice 9.1
048 Cereal etc flour/starch 1.2
054 Vegetables, fresh/chilled/frozen 5.6
057 Fruit/nuts, fresh/dried 2.0
059 Fruit/vegetable juices 4.8
05712 Mandarins etc fresh/dried 7.0
05797 Avocado/mango/guava fresh 1.5
Even though Pakistani vegetables also exhibit revealed comparative advantage in the Iranian market, the year-to-year pattern is highly variable. The same holds for fruit juices and fresh or dried fruits/nuts. The Iranian citrus market has opened up for Pakistani exports only recently. RCA index values for mandarin (Kinnow) were in excess of 10 during 2006-08 although the average for the past decade was 7.0. However, the risk of instability cannot be ruled out even in this category. For example, in early 2009 Iran raised import duties on Kinnow mandarins even though this increase was undone later that same year.
VII.4 China
Meat offal (SITC code 017) is the only agricultural product from Pakistan whose exports to China are significant as indicated by a RCA index value of 11.6. Even though the aromatic long-grain Basmati rice is a key export product from Pakistan to many countries throughout the world, it does not have market in China due to different preferences among Chinese rice consumers. Vegetables also have limited potential because China is not only the world’s largest producer and consumer of vegetables but also a large exporter. Pakistan may want to explore the prospects of mango exports to China. Pakistani mangoes have done well in high income markets in western countries and also in Brunei. There may well be good potential for Pakistani mangoes for developing a niche in the Chinese market.
21
VII.
Top Export Markets for Selected Products
This section identifies export markets for selected Pakistani agricultural products where revealed comparative advantage exists. The selected products include mangoes, Kinnow mandarins, and dates. For the purpose of market identification, two filtering criteria were employed. First, the selected markets have an average RCA greater than one during the period 1999-2008. Second, Pakistan has exported the product in question to the specific market during six or more years during that same period.
VIII.1 Mangoes
Mango exports from Pakistan exhibit strong revealed comparative advantage in Oman, Saudi Arabia, United Arab Emirates and Brunei. The value of the RCA index for mango for the Oman market is 15 and in the remaining three markets it ranges between 5 and (nearly) 7. In addition there are several other Middle Eastern markets where RCA index values are high. An interesting aspect of mango exports is their penetration into European markets. The RCA index value is 3.7 for Norway, 2.9 for Switzerland, and 2.8 for the UK. Pakistani exporters may want to team up with major supermarket chains in these countries to further increase their market share.
Table 14 RCA of mango in different markets Market No of years exported during 1999-2008 Mean RCA Oman 10 15.0 Saudi Arabia 10 6.8
United Arab Emirates 10 5.9
Brunei 8 5.5 Bahrain 10 4.4 Qatar 10 4.1 Norway 10 3.7 Maldives 10 3.6 Switzerland 10 2.9 United Kingdom 10 2.8 Kuwait 10 2.6 Singapore 10 2.0 Malaysia 10 1.0
22
VIII.2 Kinnow mandarins
The top markets for Pakistani Kinnow mandarins have been the Philippines and Indonesia with RCA index values of 39.2 and 25.0, respectively (Table 15). However, exports values to the Philippine market and the resulting RCA index values have been rather variable during the latter part of the 1999-2008 period.
Table 15 RCA of Kinnow mandarins in different markets
Market No of years exported during 1999-2008 Mean RCA Philippines 10 39.2 Indonesia 10 25.0 Singapore 10 8.3
Iran, Islamic Rep. 8 7.0
Sri Lanka 10 6.3
Malaysia 10 3.6
Bahrain 10 3.4
Saudi Arabia 10 3.0
Mauritius 10 2.9
United Arab Emirates 10 2.7
Romania 6 2.3
Afghanistan 10 1.7
Oman 9 1.3
Kuwait 10 1.2
The next tier of important markets for mandarins would include Singapore, Sri Lanka, and Iran where average RCA index ranged from 6.0 to 8.0. The Iranian market opened up only in 2006 and has a tremendous potential for future development. On the other hand, the comparative advantage of Pakistani mandarins in the Singaporean, Sri Lankan and also the Malaysia markets has eroded somewhat in the second half of the 1999-2008 period. The factors that are responsible for this decline in export performance are not quite clear and need to be identified through further research.
VIII.3 Dates
India is the largest importer of Pakistani dates. The transportation cost advantage and strong demand translate into an overwhelming revealed comparative advantage (RCA index value of 90) for Pakistani dates in India (Table 16). Although the size of the Nepali market is small compared to the Indian market, relative export performance of Pakistani dates there has also been quite strong. Pakistani dates also have revealed
23
comparative advantage in Denmark where export performance has been quite consistent in recent years. Pakistan exports dates to Paraguay but the performance in that market has been rather unstable.
Table 16 RCA of dates in different markets Market No of years exported during 1999-2008 Mean RCA Denmark 10 1.2 India 10 90.4 Maldives 7 1.1 Nepal 9 31.0 Paraguay 6 2.0
VIII.
Summary, Conclusions and Recommendations
Given its relatively fertile soils, diversity of agro-ecological conditions and significant water resources from the Indus Basin, Pakistan is widely believed to be underperforming as far as its agricultural export potential is concerned. However, analyses to support this allegation are very few, in part due to the lack of easily accessible data. In this paper we provide the first necessary step in the analysis of Pakistan’s comparative advantage in agricultural export markets. We use Balassa’s measure of Revealed Comparative Advantage to determine the competitiveness of selected agricultural products in overseas export markets. Unlike many other studies that analyze comparative advantage only at the world level, we were able to access detailed data from the IMF that allowed us to determine the degree of Pakistan’s agricultural competitiveness for disaggregated products in specific export markets. The results indicate that at the world market level Pakistan has a comparative advantage in cereals (especially rice) and horticultural products but not in livestock products. However, once specific markets and individual products are considered, the picture becomes considerably more nuanced.
Whereas relatively low yields in wheat and cotton combined with poor public policies towards these crops limit their export performance, Pakistan has traditionally been a significant player in the world rice market. However, even the relatively high value of the RCA index for rice is to a significant degree attributable to the fact that rice trades in a thin international export market. Further efforts may be made to further strengthen the revealed comparative advantage in rice by brand name marketing, better quality control, and measures of economic diplomacy (with a possible role of Pakistan’s embassies) aimed at increasing market access for Pakistan’s Basmati rice variety in high-end markets in Europe and North America.
24
Our analysis suggests that there is considerable scope for further strengthening Pakistan’s already considerable revealed comparative advantage in mandarin (Kinnow). Adoption of improved agronomic practices, control of citrus diseases, and targeted trade promotion campaigns in East-Asian and Central Asian markets can help. Development of seedless varieties of Kinnow and diversification into other citrus varieties (e.g. Clementine) with a view to penetrate the high-end citrus markets should be a medium term policy objective. Pakistan should also capitalize on the recently opened up Iranian market for mandarins. A measure of economic diplomacy would be needed to ensure that exports are not disrupted by sudden changes in import duties and other taxes in the importing country.
Besides fresh fruits exports, there exists considerable potential for increasing exports of processed citrus products. The citrus processing industry in Pakistan, while highly export oriented, is currently limited to grading, polishing and packing. In order to capitalize on the potential, there is need for developing a wide range of processed citrus products, including Kinnow juice and pulp, and by-products such as citrus peel oil. But serious quality control issues have to be addressed before the citrus processing industry diversification can be achieved. At present, the lowest quality Kinnow fruits are used for making juice, which is sold in the domestic market. This type of juice and other products of similar quality cannot be exported and there is a need to upgrade this industry before exports can be successful.
The relative export performance of mango is quite strong. Adoption of “good agricultural practice” protocols and subsequent certification by importers would help enhance export performance further. High quality mangoes should be marketed more aggressively in high-end markets; for example, Pakistan has high quality mangoes that may find a niche in Chinese fruit market if appropriate market development efforts are made. Choice brands of high quality mango nectar could also be developed as niche products for certain export markets.
Dates are one product where not only Pakistan has an extremely strong revealed comparative advantage but whose production is spread across all provinces. Dissemination of post harvest technologies among farmers in remote date-growing regions, and investments in modern processing and packaging facilities can help leverage this advantage. Pakistan may also try to expand the range of marketed date products.
Other fruits such as apples, peaches, grapes etc that are grown in Balochistan and NWFP have much weaker export performance. Access to modern marketing channels would seem essential for improving export volumes of these products.
Even though Pakistan has a revealed comparative advantage in vegetable exports, most of these exports go to neighboring countries which represent mostly low-value markets. There already exists some vegetable cultivation in tunnels in Pakistan but
25
most of this production is sold during the off-season in domestic markets. However, there is a need for investigating the prospects for exporting these vegetables during the off-season in overseas import markets.
Improved post harvest technologies and better cool chain infrastructure are needed to address perishability issues that currently limit the scope for exports of vegetables to more distant markets. Penetration into high-income developed country markets also requires mainstreaming good agricultural practices, certification and traceability. The traditional wholesale marketing system where produce is sold in the local Mandi markets before exports take place makes traceability virtually impossible. Institutional innovation that involves contract farming by, or on behalf of, exporting firms may help to resolve marketing obstacles.
Dairy products are another area of weak relative export performance. This is mainly caused by the predominance of traditional marketing channels that make quality assurance difficult, low milk yields from inadequately fed and mostly non-descript breeds of animals, and high domestic demand. The dairy processing sector is mostly inward-looking and where it does export (e.g. to Afghanistan) the main export product is UHT milk. In other words the industry currently seems to overlook the potential for exporting a wider range of dairy products (e.g. butter and cheese, and milk powder). But for this to happen there is need for technical improvements in the milk processing sector. On the other hand relatively small quantities of cheese produced in Pakistan have made an inroad into high-income countries such as the USA and Europe which demonstrates the potential of moving up the processing chain.
Analysis of bilateral and regional trading patterns reveals that processed products have relatively better prospects for penetrating high-income markets. These are precisely the products that use inputs acquired through non-traditional marketing channels. In the dairy sector, these channels are typically operated by large commercial dairy firms. But the product quantities that move through them are a very small proportion of total output. Expanding the coverage of non-traditional channels requires investments in cool chain infrastructure – preferably under public private partnership modalities – and improving the efficiency of private dairy firms so that they could sell more to middle income strata in urban areas.
With the exception of some limited exports to the Gulf, meat products are another area of weak export performance. Although domestic demand for meat is high, the real impediment to meat exports are SPS concerns: Pakistan needs to improve/upgrade its abattoirs and establish cold chains. Most importantly, it needs to ensure a disease-free livestock population. As a first step, disease free areas should be established and later expanded as animal health coverage improves. Moreover, efforts should be made to develop more productive animal breeds and improved fodder varieties.
26
Finally, it must be stressed that this study is just a first step; more in-depth and market-and product-specific research will be needed to determine the specific investments and policy measures needed to increase Pakistan’s competitive advantage in promising export markets and expand its market share.
27
References
Balassa, B. (1965). Trade Liberalisation and ´Revealed´ Comparative Advantage. Manchester School of Economics and Social Studies 33: 99-123.
Balassa, B. (1989). Comparative Advantage, Trade Policy and Economic Development. New York and London : Harvester Wheatsheaf. 343 pp.
Bruno, M. (1963). Domestic Resource Costs and Effective Protection: Clarification and Synthesis. Journal of Political Economy (80): 16-33.
Collins, R., T. Duanne, J. Campbell, P. Johnson and A.U. Malik (2006). Constraints Analysis of Pakistan’s Mango Supply Chains. Study carried out under the Agriculture Sector Linkages Program (SRA PLIA/2005/159). University of Queensland. Australia.
Cororaton, C. and D. Orden (2008). Pakistan’s Cotton and Textile Economy: Intersectoral Linkages and Effects on Rural and Urban Poverty. Research Report No. 158, International Food Policy Research Institute. Washington DC: IFPRI.
Jalbani, M.E. (2003). Dates: The Chief of all Fruits in the World. Pakistan and Gulf Economist (December): 2-15.
Jansen, H.G.P. (1991). Prospects for Horticultural Exports of Developing Countries in Asia: Quality, Competitiveness and the Environment. AVRDC Working Paper Series No.1, Asian Vegetable Research and Development Center (AVRDC), Taiwan, R.O.C., 33 pp.
Laursen, K. (1998). Revealed Comparative Advantage and the Alternatives as Measures of International Specialization. Danish Research Unit for Industrial Dynamics, Working Paper No. 98-30. Copenhagen.
Shaw, A. (2009). International Trade Data: Classification, Sources and Applications. Presentation at the Professional Development Seminar of the National Bureau of Economics (NABE), June 16-18 2009, Federal Reserve Bank of Dallas, Texas.
World Bank (2010). Food Price Increases in South Asia: National Responses and Regional Dimensions. Agriculture and Rural Development Unit, South Asia Region, World Bank. Washington DC: 143 pp.
28
Annex I Detailed RCA index values
SITC 2-digit products
Year Product Product_name RCA index
1999 01 Meat & preparations 0.1
2000 01 Meat & preparations 0.1
2001 01 Meat & preparations 0.1
2002 01 Meat & preparations 0.1
2003 01 Meat & preparations 0.2
2004 01 Meat & preparations 0.2
2005 01 Meat & preparations 0.2
2006 01 Meat & preparations 0.3
2007 01 Meat & preparations 0.4
2008 01 Meat & preparations 0.3
1999 02 Dairy products & eggs 0
2000 02 Dairy products & eggs 0
2001 02 Dairy products & eggs 0.1
2002 02 Dairy products & eggs 0.1
2003 02 Dairy products & eggs 0.1
2004 02 Dairy products & eggs 0.1
2005 02 Dairy products & eggs 0.3
2006 02 Dairy products & eggs 0.4
2007 02 Dairy products & eggs 0.4
2008 02 Dairy products & eggs 0.2
1999 04 Cereals/cereal preparatn 7.6 2000 04 Cereals/cereal preparatn 7.6 2001 04 Cereals/cereal preparatn 7.7 2002 04 Cereals/cereal preparatn 7.7 2003 04 Cereals/cereal preparatn 7.3 2004 04 Cereals/cereal preparatn 7 2005 04 Cereals/cereal preparatn 10.6 2006 04 Cereals/cereal preparatn 11.1 2007 04 Cereals/cereal preparatn 9.3 2008 04 Cereals/cereal preparatn 9.8
1999 05 Vegetables and fruit 1.2
2000 05 Vegetables and fruit 1.3
2001 05 Vegetables and fruit 1.1
2002 05 Vegetables and fruit 1
2003 05 Vegetables and fruit 1.2
2004 05 Vegetables and fruit 1
2005 05 Vegetables and fruit 1.3
2006 05 Vegetables and fruit 1
2007 05 Vegetables and fruit 1.1
29
SITC 3-digit products
Year Product Product_Name RCA Index
1999 011 Beef, fresh/chilld/frozn 0 2000 011 Beef, fresh/chilld/frozn 0 2001 011 Beef, fresh/chilld/frozn 0 2002 011 Beef, fresh/chilld/frozn 0.1 2003 011 Beef, fresh/chilld/frozn 0.1 2004 011 Beef, fresh/chilld/frozn 0.1 2005 011 Beef, fresh/chilld/frozn 0.1 2006 011 Beef, fresh/chilld/frozn 0.2 2007 011 Beef, fresh/chilld/frozn 0.6 2008 011 Beef, fresh/chilld/frozn 0.6 1999 012 Meat nes,fresh/chld/froz 0.1 2000 012 Meat nes,fresh/chld/froz 0.2 2001 012 Meat nes,fresh/chld/froz 0.1 2002 012 Meat nes,fresh/chld/froz 0.1 2003 012 Meat nes,fresh/chld/froz 0.2 2004 012 Meat nes,fresh/chld/froz 0.3 2005 012 Meat nes,fresh/chld/froz 0.2 2006 012 Meat nes,fresh/chld/froz 0.3 2007 012 Meat nes,fresh/chld/froz 0.4 2008 012 Meat nes,fresh/chld/froz 0.2
1999 022 Milk pr exc buttr/cheese 0
2000 022 Milk pr exc buttr/cheese 0.1
2001 022 Milk pr exc buttr/cheese 0.1
2002 022 Milk pr exc buttr/cheese 0.1
2003 022 Milk pr exc buttr/cheese 0.2
2004 022 Milk pr exc buttr/cheese 0.2
2005 022 Milk pr exc buttr/cheese 0.5
2006 022 Milk pr exc buttr/cheese 0.7
2007 022 Milk pr exc buttr/cheese 0.7
2008 022 Milk pr exc buttr/cheese 0.5
1999 025 Eggs, albumin 0.1 2000 025 Eggs, albumin 0.3 2001 025 Eggs, albumin 0.7 2002 025 Eggs, albumin 0.8 2003 025 Eggs, albumin 0.5 2004 025 Eggs, albumin 0.4 2005 025 Eggs, albumin 0.3 2006 025 Eggs, albumin 0.1 2007 025 Eggs, albumin 0 2008 025 Eggs, albumin 0 2000 041 Wheat/meslin 0.2 2001 041 Wheat/meslin 1.8 2002 041 Wheat/meslin 5.6 2003 041 Wheat/meslin 1.6 2004 041 Wheat/meslin 0
30
SITC 3-digit products
Year Product Product_Name RCA Index
2007 041 Wheat/meslin 2.4 2008 041 Wheat/meslin 0.5 1999 042 Rice 48.9 2000 042 Rice 56.3 2001 042 Rice 49.3 2002 042 Rice 44.8 2003 042 Rice 54 2004 042 Rice 50.8 2005 042 Rice 70.6 2006 042 Rice 75.5 2007 042 Rice 65.1 2008 042 Rice 146 2000 046 Flour/meal wheat/meslin 2.1 2001 046 Flour/meal wheat/meslin 15.3 2002 046 Flour/meal wheat/meslin 19.4 2003 046 Flour/meal wheat/meslin 15.2 2004 046 Flour/meal wheat/meslin 14.9 2005 046 Flour/meal wheat/meslin 25.6 2006 046 Flour/meal wheat/meslin 34.3 2007 046 Flour/meal wheat/meslin 20.5 2008 046 Flour/meal wheat/meslin 0.3 1999 054 Vegetables,frsh/chld/frz 1.6 2000 054 Vegetables,frsh/chld/frz 1.1 2001 054 Vegetables,frsh/chld/frz 1 2002 054 Vegetables,frsh/chld/frz 0.8 2003 054 Vegetables,frsh/chld/frz 1.8 2004 054 Vegetables,frsh/chld/frz 0.9 2005 054 Vegetables,frsh/chld/frz 2.1 2006 054 Vegetables,frsh/chld/frz 0.7 2007 054 Vegetables,frsh/chld/frz 1.1 2008 054 Vegetables,frsh/chld/frz 0.9 1999 057 Fruit/nuts, fresh/dried 1.6 2000 057 Fruit/nuts, fresh/dried 2.2 2001 057 Fruit/nuts, fresh/dried 1.8 2002 057 Fruit/nuts, fresh/dried 1.8 2003 057 Fruit/nuts, fresh/dried 1.6 2004 057 Fruit/nuts, fresh/dried 1.8 2005 057 Fruit/nuts, fresh/dried 1.5 2006 057 Fruit/nuts, fresh/dried 1.7 2007 057 Fruit/nuts, fresh/dried 1.7 2008 057 Fruit/nuts, fresh/dried 1.8
31
SITC 4 digit products
Year Product Product_Name
RCA Index
1999 0571 Citrus fruit fresh/dried 2.1
2000 0571 Citrus fruit fresh/dried 3
2001 0571 Citrus fruit fresh/dried 3.2
2002 0571 Citrus fruit fresh/dried 4
2003 0571 Citrus fruit fresh/dried 3.3
2004 0571 Citrus fruit fresh/dried 4.2
2005 0571 Citrus fruit fresh/dried 2.6
2006 0571 Citrus fruit fresh/dried 5.6
2007 0571 Citrus fruit fresh/dried 4.1
2008 0571 Citrus fruit fresh/dried 8.5
SITC 5 digit products
Year Product Product_Name
RCA Index 1999 05711 Oranges,fresh or dried 0.3 2000 05711 Oranges,fresh or dried 0.2 2001 05711 Oranges,fresh or dried 0.1 2002 05711 Oranges,fresh or dried 0 2003 05711 Oranges,fresh or dried 0.1 2004 05711 Oranges,fresh or dried 0 2005 05711 Oranges,fresh or dried 0 2006 05711 Oranges,fresh or dried 0 2007 05711 Oranges,fresh or dried 0 2008 05711 Oranges,fresh or dried 0
1999 05712 Mandarins etc frsh/dried 4.5
2000 05712 Mandarins etc frsh/dried 6.5
2001 05712 Mandarins etc frsh/dried 7.6
2002 05712 Mandarins etc frsh/dried 9.2
2003 05712 Mandarins etc frsh/dried 7.5
2004 05712 Mandarins etc frsh/dried 9.6
2005 05712 Mandarins etc frsh/dried 5.4
2006 05712 Mandarins etc frsh/dried 12.1
2007 05712 Mandarins etc frsh/dried 8.4
2008 05712 Mandarins etc frsh/dried 29.9
1999 05796 Dates, fresh/dried 81.3 2000 05796 Dates, fresh/dried 109.2 2001 05796 Dates, fresh/dried 71.8 2002 05796 Dates, fresh/dried 78.8 2003 05796 Dates, fresh/dried 56.6 2004 05796 Dates, fresh/dried 60.9 2005 05796 Dates, fresh/dried 46.2 2006 05796 Dates, fresh/dried 57.2 2007 05796 Dates, fresh/dried 54.3 2008 05796 Dates, fresh/dried 56.2 1999 05797 Avocado/mango/guava frsh 8.3
32 2000 05797 Avocado/mango/guava frsh 13.4 2001 05797 Avocado/mango/guava frsh 13.3 2002 05797 Avocado/mango/guava frsh 11.1 2003 05797 Avocado/mango/guava frsh 11.8 2004 05797 Avocado/mango/guava frsh 12.9 2005 05797 Avocado/mango/guava frsh 11.4 2006 05797 Avocado/mango/guava frsh 7.3 2007 05797 Avocado/mango/guava frsh 10.1 2008 05797 Avocado/mango/guava frsh 17