SELECTING MUTUAL FUND PERSISTENCE: THE GERMAN CASE
DISCOVERING PERSISTENT MANAGERS IN GERMANY
Jorge Sainz, Javier Otamendi, Pilar Grau and Luis Miguel Doncel Universidad Rey Juan Carlos, Campus Vicálvaro
Facultad de Ciencias Jurídicas y Sociales Departamento Economía Aplicada I
Paseo Artilleros s/n 28032 Madrid, Spain
E-mail: [email protected]
KEYWORDS
Model, π in the C-Ky, X-Y-Z Analysis, Persistence.
ABSTRACT
In mutual fund industry, managers’ ability to generate continuous value in excess compared with the benchmark index is a crucial aspect. Focusing on the German market in this research we apply several methods which let us to avoid statistical problems related to multiple hypothesis testing in traditional financial techniques. By doing so we obtain a threshold value λ that delimits what is considered the true null hypothesis. Our main result is that managers’ action is of little significance with only a small part of them adding excess value to mutual funds they run.
INTRODUCTION
The ability of mutual fund managers to beat the market has long been placed in doubt. Literature shows that only a relatively small percentage of the whole universe of mutual funds has been persistently better than the index they use as a benchmark. Nevertheless positive persistence measures may be upwards bias, referring as ability something that is more related to luck. This result may have several effects as it affects managers’ retributions which are related to performance and the marketing of the funds, also associated to traditional performance measures.
Traditional measures of persistence are based on Jensen’s alpha, where the ability of managers to obtain abnormal results is tested against the behaviour of the market, while including additional factors like size, or book to market or momentum or not. Although these measures have been widely used, they do not take into account the existence of lucky funds, that is, funds that have significant estimated alphas (positive or negative), but zero true alphas. The existence of those values misinterprets the real results on the behaviour of mutual funds and makes it necessary to correct the results by taking in account the statistical shortcomings of the method used to estimate individually the alphas, which strongly rests on the confidence interval chosen.
We estimate the true number of persistent funds whether that persistence by the managers is positive or negative. Previous European wide studies show that persistence as estimated by traditional methods is fairly low both in the positive and negative sides and that the number of funds that shows the ability of management strongly depends on the level of accuracy chosen for the sample. We are able to find the true number of funds that show persistence on the sample, regardless of the confidence level used on the description of the results.
This approach also improves the search of true alphas. Previous papers, as Kosowski, Timmermann, White, and Wermers (2006) for the US and Cuthbertson, Nitzsche and O’Sullivan (2005) for the UK use a more simple bootstrap technique to estimate the ability of managers on positive or negative marginal alphas, while the former is only appropriate for extreme alphas values (either positive or negative). Similar problems are also found on Bayesian analysis as the ones developed by Baks, Metrick, and Wachter (2001) and Pastor and Stambaugh (2002), that yield results that are only relevant on the margin. Additionally, in the Cuthbertson, Nitzsche and O’Sullivan (2006) case, as Nuttall (2007) shows, the results may erroneously identify funds as having skill they do not possess or vice versa, rendering inaccurate results on extreme cases.
In this paper we are going to follow the discoveries of Benjamini and Storey (Benjamini and Hochberg 1995; Benjamini and Yekutieli 2001; Storey 2002) in order to find whether those alphas obtained during the standard estimation process for persistence are actually attributable to the manager’s success or to the “false discovery rate”. In those cases we will reject to hypothesis that managers create value to investors, that is, they are getting paid for nothing.
PERFORMANCE MEASURES
Managers’ ability is commonly measured in different ways widely used in the industry, such as alphas, betas, Sharpe ratios, information ratios, etc. In analyzing performance, traditional measures rely on the capital
Proceedings 22nd European Conference on Modelling and Simulation ©ECMS Loucas S. Louca, Yiorgos Chrysanthou, Zuzana Oplatková, Khalid Al-Begain (Editors)
market line developed on the 1960s and became more sophisticated through the inclusion of various factors that take into account the evolution of stocks. Their advantage is that they are relatively simple to obtain and the results are easily comparable.
Traditional performance measures are based on the capital asset pricing model derived by Sharpe (1964) and Lintner (1965), who establish a linear relationship between the excess return of an investment and its systematic risk, including an alpha term:
it ft mt it i ft it
R
R
R
R
−
=
α
+
β
(
−
)
+
ε
(1)These measures, similar to the ones developed by Treynor and Mazuy, use the CAPM security line, with the intercept of the regression general expression. The Jensen a is interpreted as a measure of the funds’ performance with respect to the market benchmark chosen, where is the return in month t of the fund
i, the return on a one-month T-bill in the same month, is the return of the benchmark for the period t and it
R
ftR
mtR
itε
is the error term.To include styles of management Fama and French (1993) developed a model that incorporate two other factors: size (SMB) and book to market (HML) to which Carhart (1997) added a new variable that captures the momentum (tendency) factor (by using the difference between a portfolio that incorporate past winners minus a portfolio of past losers (MOM)):
it t i t i t i ft mt i i ft it R R R SMB HML MOM R − =α +β1( − )+β2 +β3 +β4 +ε (2)
Any of the models are estimated using Ordinary Least Square (OLS) regression. As it is well known, each estimated αi comes with its corresponding variance estimator, so that p-values that correspond to the null hypothesis of zero alpha are readily calculated. Individual p-values smaller than a pre-specified significance level γ indicate individual persistence, with the sign of the αi indicating positive or negative persistence. The number of persistent managers is obtained by repeating the test for each of the i=1…I managers of mutual funds independently.
SIMULATION METHOD TO ESTIMATE TRUE PERSISTENCE
What has been described in the previous section is known as individual, independent hypothesis testing and differs from multiple testing, which covers all the funds jointly.
In individual hypothesis testing, an observed value x is compared against a threshold value that result of the
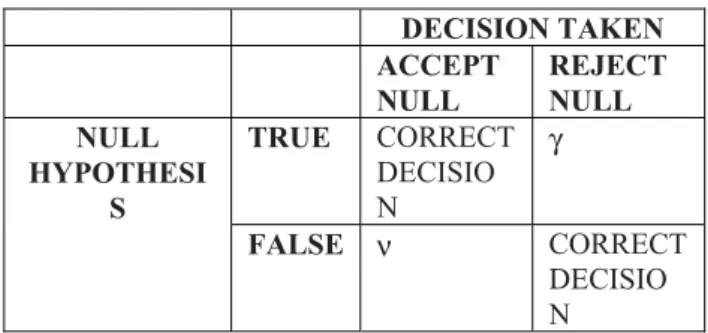
application of a significance level γ, and a decision is taken by deciding to reject or not reject (accept) the null hypothesis. It is well known that when taking this acceptance/rejection decision, two errors might be committed: rejecting the null hypothesis when it should have been accepted (probability=γ) or accepting it when it should have been rejected (probability=ν). The null hypothesis in this case is that the given mutual fund manager is not persistently different than the market (αi=0), whereas the alternative is that the
managers do really behave differently. Table 1 shows the decision problem in tabular form.
Table 1: Problem in Tabular Form
DECISION TAKEN ACCEPT NULL REJECT NULL TRUE CORRECT DECISIO N γ NULL HYPOTHESI S FALSE ν CORRECT DECISIO N
In multiple hypothesis testing (Table 2), the number of observed values is high (M) and the procedure should detect those null hypothesis that are really true (O) and those that are really false (A). If γ is used for each individual test, the probability of committing errors is greatly increased: the probability of accepting just the true null hypotheses is only (1-γ)O, and the probability
of rejecting all the ones that are false is only as high as (1-ν)A. Therefore, in other to take good decisions at the
aggregate level, it is necessary to lower γ to the point where (1-γ)O = Γ, Γ defined as the overall significance
level. If O is high and Γ is low, γ will be very close to zero, making it very complicated to reject any individual null hypothesis, thus committing decision errors of not rejecting false null hypothesis.
Table 2: Multiple Problem in Tabular Form ACCEPT H0,i REJECT H0,i TOTAL TRUE NULL P F O FALSE NULL N T A TOTAL W R M
Efforts have been made to attack the multiple hypothesis problem from different angles so that the chance of correctly accepting the truly significant alternative hypothesis (A) rises. That includes both the correctly rejected null hypothesis (T) and also those for which the null hypothesis is incorrectly accepted (N).
ii.
( )
( )
(
)
M
W
*
1
ˆ
ˆ
0λ
λ
λ
π
=
−
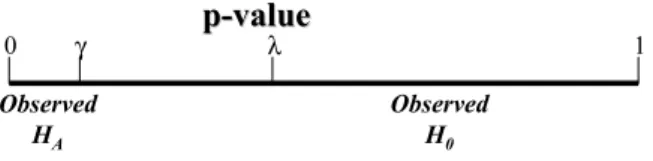
Two of these main efforts are those of Benjamini and Storey with their fight for controlling the FDR (False Discovery Rate), that is, the number of individual null hypothesis that are rejected that should have been accepted. First, Benjamini developed a sequential algorithm (Benjamini and Hochberg 1995, Benjamini and Yekutieli 2001), which later is improved by Storey (Storey 2002). The latter´s original idea is to include a threshold value λ that delimits what is considered true null hypothesis instead of using the individual γ to reject null hypothesis (Figure 1).
b. Calculate MSE(λ,
π
ˆ
0( )
λ
) and the (1-Γ)percentile of and using a
bootstrap procedure of B samples., in which ) ( ˆ *
γ
λb DR F p( )
λ
π
bˆ
0 and areestimated from a sample of I p-values out of the original p-values:
) ( ˆ *
γ
λb DR F pp
p-
-value
value
0 γ λ 1 Observed H0 Observed HA4. Calculate the “optimum λ”, λ*, by choosing the one with the smallest MSE(λ)
5. Calculate } ) 1 ( 1 { * ) r( Pˆ * ) ( ) ( ˆ 0 * M value p DR F p
γ
γ
γ
λ
π
γ
λ − − < − =Figure 1: γ and λ in the p-value axis
The sequential approach, which gives as a result the estimated number k of total true positive rejections of the null, as a function of Γ and λ, is as follows:
The joint application of the algorithms therefore allows to obtain both the number of persistante managers and a measure of how good the estimation is, measured by the pFDR.
1. Let p(1)<…<p(I) be the ordered, observed
p-values for the I hypothesis test
DATA AND SAMPLE DESCRIPTION
2. Find k such that:
kˆ= max{k: FˆDR(p(k))<Γ} = max{k: M k pk / ˆ0 ( )
π
<Γ} = max{k: M k p M p k i / ) 1 ( } { # ) (λ
λ
− > <Γ} = max{k: M k p M W k / ) 1 ( ) ( ) (λ
λ
− < Γ}Our dataset comprises 134 mutual funds registered in Germany. The monthly return data for the funds was provided by Morningstar, and the sample period under consideration covers 11 years, from January 1995 to December 2005. All mutual funds are measured gross of taxes, with dividends and capital gains, but net of fees, the Average Annual Return for the sample period was of 9,42% while its Standar deviation was 17,04. As market factors we use the DAX XETRA index and the one-month interest rate when calculating excess returns. To calculate the Fama and French (1993) factors we follow different strategies for each factor. For the HML we use the data from French’s open database estimated on local currency; to evaluate the SMB we use the differences on the returns of small and large capitalized stocks.
Storey (2002) later developed the bootstrap procedure to select the best combination of λ and Γ in terms of γ. In this procedure the mean square errors of the estimations of the FDR measure is minimized. The algorithm could be summarized as follows:
Table 1 summarizes the details of the different series used. The returns shown are that of an equally weighted portfolio that includes all the funds for that country. Results from the returns show that although the data for mutual funds and risk-free assets are quite similar, the data on the other benchmarks differ significantly, as we expected, similar to other European analyses (for example, Otten and Bams, 2002).
1. Set the individual significance level γ
2. Set the feasible range for λ and Γ
3. For each λ:
a. Estimate the proportion of hypothesis with a true null,
π
oi. = observed individual
tests with a p-value that exceeds the threshold λ
( )
λ
W
ˆ
Table 3: Summary Statistics For Different Factors And Benchmarks Used
Cross Correlations
Return STD Dev Fund Market Risk free SMB HML Mom
Fund 9.42 17.04 1.00 Market 13.56 21.47 0.93 1.00 Risk free 3.19 10.15 -0.19 -0.15 1.00 SMB 14.85 42.07 -0.17 -0.09 0.29 1.00 HML 9.50 19.38 -0.08 -0.14 0.03 -0.10 1.00 MOM 0.28 0.36 0.02 0.07 0.00 0.11 -0.19 1.00
Table 4: Summary Statistics For The Different Models of CAPM-Based Models
Alfa Market SMB HML Mom Adj R2 dist +/0/-
Jensen -0.08 0.75* - - - 0.86 1/84/15
Fama-French -0.07 0.73* 0.03*** -0.07 - 0.86 1/81/18
Carhart -0.04 0.74* 0.02*** 0.03 -0.01 0.82 0/80/20
*** Significant at the 1% level ** Significant at the 5% level * Significant at the 10% level
ESTIMATION OF ALPHAS
Table 2 reports the OLS results of these measures for an equally weighted portfolio that includes the whole sample and, in the last column, the percentage distribution of the sign of the statistically significant alphas of each method plus those alphas that are not different from zero. Germany has a fairly low percentage of abnormal performance over the period which is consistent with other studies.
The Fama and French factors (HML and SMB) are relevant across estimations and countries, especially for the SMB factor. Less relevant is the Carhart momentum, MOM, which shows little relevance across markets and no significance.
PERSISTENT MANAGERS IN GERMANY
The data just presented is therefore liable for an analysis of persistence, in particular, to calculate the significance of the alphas generated by any of the models (performance measures) presented in section 2. What follows are the analyses of the results that have been obtained after applying the simulation algorithm to the data for different combinations of country, method, Γ, γ, λ, which have been parameterized with the following values:
• Country={Germany}
• Method ∈{Carhart, FamaFrench, Jensen}
• Γ∈{0.005, 0.010, 0.025, 0.050, 0.100}
• γ∈{0.001,0.005,0.010, 0.025, 0.050}
• λ∈{0.050, 0.100, 0.150, …, 0.400,
0.450,0.500}
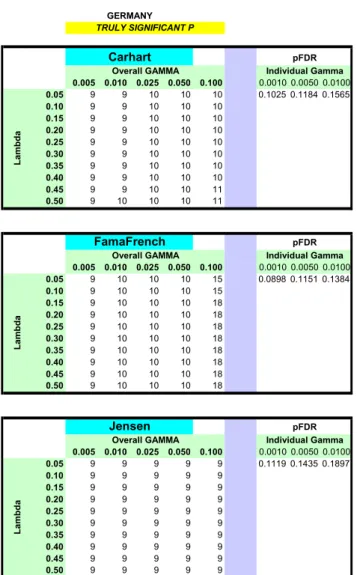
The results (Figure 2) indicate that 9 or 10 of the mutual fund managers show persistence (out of 134). The pFDR is reasonably low even for low values of lambda and individual gamma, growing with the individual lambda, giving the indication that the 10 managers are clearly outstanding and are not lucky.
CONCLUSIONS
To obtain positive persistence, that is, beating the market in a continuous way is the goal for mutual fund managers and they get well paid for that. Traditional methods show that in Germany there are some persistence in the returns. Those abnormal returns are the base both manager’s retributions and firms profits, but the result may be the consequence of statistical analysis chosen. Our results show that traditional methods have been overestimating the effect in persistence of managers, both positively and negatively, due to do not taking into account some statistical properties like confidence intervals decisions.
By applying a statistical procedure free of these handicaps to a large dataset of funds registered in Germany, we show that persistence is lower than realized on the German Mutual Fund Literature. Just 7.5% of managers add value to investors whereas more that 90% do not create significant benefits or these profits seem to be more related with luck than ability. Our choice of method yields relevance over the whole
distribution and not just in the margin, as the previous methodology used to evaluate this phenomenon. Still, this research is just a first step. Further research need to be posed on the development on more sophisticated measures that will yield more robust results. Also it would be worthwhile to analyse a wider sample of countries to obtain a cross markets analysis.
Individual Gamma 0.001 0.005 0.010 Lambda 0.050 0.100 0.150 0.200 0.250 0.300 0.400 0.500 Overall GAMMA 0.005 0.010 0.025 0.050 0.100 0.005 0.010 0.025 0.050 0.100 0.0010 0.0050 0.0100 0.05 9 9 10 10 10 0.1025 0.1184 0.1565 0.10 9 9 10 10 10 0.15 9 9 10 10 10 0.20 9 9 10 10 10 0.25 9 9 10 10 10 0.30 9 9 10 10 10 0.35 9 9 10 10 10 0.40 9 9 10 10 10 0.45 9 9 10 10 11 0.50 9 10 10 10 11 0.005 0.010 0.025 0.050 0.100 0.0010 0.0050 0.0100 0.05 9 10 10 10 15 0.0898 0.1151 0.1384 0.10 9 10 10 10 15 0.15 9 10 10 10 18 0.20 9 10 10 10 18 0.25 9 10 10 10 18 0.30 9 10 10 10 18 0.35 9 10 10 10 18 0.40 9 10 10 10 18 0.45 9 10 10 10 18 0.50 9 10 10 10 18 0.005 0.010 0.025 0.050 0.100 0.0010 0.0050 0.0100 0.05 9 9 9 9 9 0.1119 0.1435 0.1897 0.10 9 9 9 9 9 0.15 9 9 9 9 9 0.20 9 9 9 9 9 0.25 9 9 9 9 9 0.30 9 9 9 9 9 0.35 9 9 9 9 9 0.40 9 9 9 9 9 0.45 9 9 9 9 9 0.50 9 9 9 9 9 GERMANY TRULY SIGNIFICANT P Carhart Overall GAMMA Lambda Individual Gamma Lambda Jensen Lambda FamaFrench
Overall GAMMA Individual Gamma
Individual Gamma pFDR
pFDR
pFDR Overall GAMMA
Figure 2. Results for Germany
REFERENCES
Benjamini, Y. and Y. Hochberg. 1995. “Controlling the false discovery rate: a practical and powerful approach to
multiple testing.” Journal of the Royal Statistical Society
B 57, No. 1, 289-300.
Benjamini, Y. and D. Yekutieli. 2001. “The control of the false discovery rate in multiple testing under
dependency.” The Annals of Statistics 29, No. 4,
1165-1188.
Barras, L.; O. Scaillet; and R. Wermers. 2006. “False discoveries in mutual fund performance: Measuring luck
in estimated alphas.” Robert H. Smith School Research
Paper No. RHS 06-043
Carhart, M. 1997. “On persistence in Mutual Fund
Performance.” The Journal of Finance 52, No. 1, 57-82.
Cuthbertson, K.; D. Nitzsche; and N. O'Sullivan. 2005.
"Mutual Fund Performance: Skill or Luck?" Cass
Business School Research Paper.
Fama, E. and K. French. 1993. “Common Risk Factors in the
Returns on Bonds and Stocks”, Journal of Financial
Economics 33, 3-53.
Kosowski, R.; A. Timmermann; R. Wermers; and H. White. 2006. “Can Mutual Fund ‘Stars’ Really Pick Stocks?
New Evidence from a Bootstrap Analysis.” Journal of
Finance, 61, 2551-2595.
Lintner, J. 1965. “The Valuation of Risk Assets on the Selection of Risky Investments in Stock Portfolios and
Capital Budgets.” Review of Economics and Statistics 47,
13-37.
Otten, R., and M. Schweitzer. 2002. “A Comparison Between the European and the U.S. Mutual Fund Industry.”
Managerial Finance 28, 14-35.
Pastor, L and R. Stambaugh. 2002. “Mutual Fund
performance and seemingly unrelated assets.” Journal of
Financial Economics, 63, 315-349.
Sharpe, W. 1964. “Capital Asset Prices: A Theory of Market
Equilibrium Under Conditions of Risk.” Journal of
Finance, 19, 425-442.
Sharpe, W. 1991. “The Arithmetic of Active Management.”
The Financial Analysts’ Journal 47, 7-9.
Storey, J. D. 2002. “A Direct Approach to False Discovery
Rates.” Journal of the Royal Statistical Society B 64,
479-498.
AUTHOR BIOGRAPHIES
JAVIER OTAMENDI received the B.S. and M.S. degrees in Industrial Engineering at Oklahoma State University, where he developed his interests in Simulation and Total Quality Management. Back in his home country of Spain, he received a B.S. in Business Administration and a Ph.D. in Industrial Engineering. He is currently a simulation and statistics consultant and university professor at the Rey Juan Carlos University in Madrid.
JORGE SAINZ has a BS in Economics, from University Complutense of Madrid. Latter he attended University of Rochester in New York obtaining a Master in Business Administration and Finance. Back in Spain he got a Ph.D. in Economics from the Rey Juan Carlos University and a LL.B. from UNED. He has worked as Chief Economist for CIMD and Product Manager at Yahoo!, were he headed Yahoo! Finance in Spain for several years. Currently he is Associate Professor at URJC in Madrid and invited Professor at UOC, Barcelona. His research focuses on financial
markets and the effect of ICT on product innovation and pricing. His e-mail address is : [email protected] and his Web-page can be found at
http://www.economiaaplicada.com/.
LUIS MIGUEL DONCEL obtained a BS in Economics, from University Complutense of Madrid. to obtain Master in Economics and Finance from the University of York. He got a Ph.D. in Economics from the Rey Juan Carlos University with a research about foreign exchange rates and simulation. Currently he is a lecturer at Rey Juan Carlos University. His research focuses on
financial markets and Simulation. His e-mail address is: [email protected]
PILAR GRAU recived a BS in Economics at University Complutense of Madrid. Later on she got a Ph.D. in Economics from the same university with a research about nonlinearites and chaos in financial markets. Currently she is a lecturer at Rey Juan Carlos University. Her research focuses on computational finance and stochastic modeling of financial time series. Her e-mail address is: [email protected]