D
EMANDP
ULL ANDS
UPPLYP
USHIN
P
ORTUGUESEC
ABLET
ELEVISIONN
ETWORKS:
A
VAR
A
PPROACHJOÃO LEITÃO*
Universidade da Beira Interior (UBI) Departamento de Gestão e Economia (DGE)
Covilhã, Portugal
Abstract
In this paper a Vector Autoregressive Model is applied to the most representative Portuguese cable television operators, in order to obtain a dynamic analysis of the interactivity established between the supply and the demand of network services, through the strategy of vertical integration of services. The results reveal the existence of two driving forces in the Portuguese main cable networks, on the one hand, the supply push which contributes to the enhancement of the basic cable demand, and on the other hand, the demand pull which intensifies the introduction of new vertically integrated services. In the two case studies, it is also detected that vertical integration of services has a negative impact on the price of the basic cable television service.
Key Words: Cable Television, Vector Autoregressive Model, Cointegration.
JEL: C32, C51, L96.
*
Mailing address: Universidade da Beira Interior, Pólo das Ciências Sociais e Humanas, Departamento de Gestão e Economia, 6200 209 Covilhã, Portugal. E-mail: [email protected].
The author is grateful to Carlos Osório (UBI - Portugal), José R. Pires Manso (UBI - Portugal), José Ricardo B. Nogueira (UFPE – Brazil), José Luis Miralles Marcelo (UNEX - Spain), and José Luis Miralles Quirós (UNEX - Spain) for helpful comments on previous versions of this paper. A special debt of gratitude is due to Carlos Osório and José Luis Miralles Marcelo for the positive incentives and constructive comments on the initial draft. The usual caveat applies.
DEMAND PULL AND SUPPLY PUSH IN PORTUGUESE CABLE TELEVISION NETWORKS:
AVARAPPROACH
1.INTRODUCTION
With the emerging of the open network paradigm, it is expected that the strategies of the cable television operators will be guided by the dynamics of the interactivity between the supply and the demand of network services, promoted by the vertical integration of services, which embraces the integration of different and complementary functions, on the same distribution network.
In this paper an econometric study of the main Portuguese cable television networks is presented, in order to better understand the interactivity of the supply and the demand of network services, obtained through the implementation of the vertical integration of services strategy. To this effect, two cases are confronted (the incumbent one: TV Cabo; and the entrant one: Cabovisão), in order to analyse the relations between the penetration rate of the cable television service, the demand for the basic service, the price, and the vertical integration of services. The same model is used for identifying the factors that contribute to the reinforcement of the interactivity logic between the supply and the demand of network services, both in a bigger dimension network (the incumbent one), and in a smaller dimension network (the entrant one). In addition to this, an analysis of the impact of the strategy of vertical integration of services on the pricing of the basic cable television service is made.
In the first section, a brief literature review about some empirical studies of Cable Television in the USA is made, and a summary review of the literature relating to the econometric instrument used in both case studies, the Vector Autoregressive (VAR) model; is also made. In the second section, the methodology, the objectives, the hypotheses in this study, and the specifications of the selected model, are presented. In the third section, the econometric study is developed, following an empirical strategy which contemplates the development of three sequential phases, namely, the determination of the integration order of the variables, the definition and the estimation of the VAR model, and the presentation of the main results of the dynamic analysis. Finally, the conclusions are presented, taking into consideration a comparative analysis between the results obtained for the incumbent, and for the entrant.
2.LITERATURE REVIEW 2.1.EMPIRICAL STUDIES
The problematic regarding the estimation of the penetration rate of the basic cable television service was developed in the pioneer studies of Comanor and Mitchel (1971), Park (1972), and Pacey (1985), applied to the main cable television operators in the USA. These studies pointed out that the price influences, significantly, the basic demand1, and that the number and the quality of the channels offered also influences, positively, the demand level. These findings formed the basis of the carrying out of studies concerning the relation between the demand and the price, as well as of the impact of the regulatory dispositions on the price of this kind of service.
In this context, the study of Mayo and Otsuka (1991) must be noted, concerning the US Cable Television Industry, where the relations between demand, price, and regulatory practice, are analysed, before the deregulation2.
The authors of that study concluded that the pricing of the basic cable television service depends on operator market power, demand conditions (including the complementarities between the basic and the premium service) and on associated regulatory dispositions.
The results also revealed the existence of some variability in the effects on the alternative ways of regulating the price of the basic service, which led to the conclusion that this price was influenced not only by the marginal cost, and the demand conditions of the premium services, but also by the complementarities between the basic and the premium services. In order to accomplish the price cap established by the regulatory agency, the operators responded with a reduction of the variety of the television channels or with an increase in the price of the premium services which were tied to the basic service (Mayo and Otsuka, 1991).
Waterman and Weiss (1997) pointed out the implications of the situation of vertical integration by the four main US cable operators on performance, on price, and on promotion strategies.
1
This effect respects the traditional Demand Law, which states that: for an increase in the pricecorresponds a decrease in the demanded quantity.
2
In the USA, the subscription prices were deregulated in The Cable Act of 1984; they were re-regulated in the Cable Act of 1992, and they became again deregulated with the adoption of the Telecommunications Act of 1996.
The main results revealed that vertically integrated operators offered a smaller diversity of television channels, in terms of the basic service. These kinds of operators also favoured the premium television channels, in which they had participated. In this sense, they have included frequently the referred channels in the offering of premium cable channels, and also have implemented more aggressive promotional campaigns, which were complemented by the practice of discount prices for the premium channels that were vertically integrated by the cable operator (Waterman and Weiss, 1997).
Chipty (2001) found that the cable operators vertically integrated with premium television channels3 offered, on average, one less premium service, and one or two fewer basic services than the remaining operators. These operators sell the premium packages more successfully, but they offer services with smaller diversity, at higher prices. They stimulate the demand for premium services, through the supply of smaller and cheaper basic packages. The operators integrated with the basic channels4 sell the basic packages more successfully, and in spite of their tendency for excluding certain cable television services from their distribution networks, they stimulate the demand through the supply of some basic packages with a bigger diversity, using a smaller duplication of programs and a greater number of premium services.
Furthermore, Chipty (2001) considers that the sign of the effect of the vertical integration on price is not clear, due to the fact that the operators select so much of the price based upon the quality level of the final service offered to the consumers. On the one hand, the basic integration has a positive effect on the basic price, but a negative effect on the average price of the premium services. On the other hand, the premium integration has a negative effect on the basic price but, even so, has a positive effect on the average price of the premium services.
3
That is, the premium operators.
4
2.2.VECTOR AUTOREGRESSIVE MODEL
The VAR model5 is especially applied to the analysis of time series and it has been used in an extensive way by several economists, for analysing data, forecasting and making statistical inference.
In the vision of Sims (1980), the VAR model permits the determination of the existence of interrelations between the set of endogenous variables included in the system. The main advantage of using this kind of model derives from the capacity to analyze the dynamic response of the endogenous variables of the system, through the use of the analysis of Variance Decomposition, and the Impulse-Response Functions.
The Variance Decomposition of the forecast error, in terms of the components associated with the different disturbances, provides the identification of the sources of the fluctuation of variables. The Impulse-Response Functions intended as dynamic multipliers reveal the variation of the endogenous variables, which is provoked by a unitary impulse in random disturbances of the system (Ballabriga, 1991; Watson, 1994).
In the ambit of the analysis of the long and short term economic relations, several pioneer works should be mentioned which discuss the cointegration concept, namely, Granger (1983), Granger and Weiss (1983), and Engle and Granger (1987).
The construction of cointegrated models involves two fundamental steps, namely, the determination of the cointegration degree (that is, the number of unit roots in the model), and the estimation of the unknown parameters (Lütkepohl, 1999).
3.METHODOLOGY
3.1.OBJECTIVES
The Portuguese Cable Television Sector is an appropriate unit of analysis for making a contrast between the strategies of the operators: incumbent, versus entrant; taking into consideration the coexistence of integrated operators, and non integrated operators, in terms of the physical activities, and the simultaneous practice of vertical integration of services.
5
For revisions about the main developments of the VAR Model, see Holtz-Eakin, Newey and Rosen (1988), Lütkepohl (1991, 2004), Banerjee, Dolado, Galbraith and Hendry (1993), Hamilton, (1994), Canova (1995), Hendry (1995), Johansen (1995), Hatanaka (1996), Favero (2000), and Canova and Ciccarelli (2003).
In the scenario of vertical integration of services performed by each operator, which use package tie-in sales of different network services, for example, television, Internet, fixed telephone and other complementary services which are technologically-related.
In this sense, we present a dynamic analysis6 of the impact on the strategy of pricing for the basic service arising from the implementation of the vertical integration strategy of services, both for a vertically-integrated operator, and for an operator which is not vertically- -integrated.
In a broad sense, the interest of this study is, fundamentally, based on the fact that the Cable Television Sector has a significant weight in the Portuguese Services Communications Structure, and the need for analyse the different strategies implemented by the main cable television operators, in terms of the organization of activities, the installed network, and pricing. In a more specific sense, we will be analysing the dynamic relation between the penetration rate of the cable television service and the basic demand, as well as the relation between the basic demand and the vertical integration of services. Furthermore, we aim to understand the effect due to the implementation of the strategy of vertical integration of services on the price of the basic service.
3.2.HYPOTHESES
Taking into consideration the fact that there is a mixture of television services offered in the Portuguese Cable Television Sector, Internet and fixed telephone through bidirectional networks, which may generate network externalities, and incorporating the visions of Katz and Shapiro (1985), Hayashi (1992), Economides and Himmelberg (1995) and Economides (1996), in relation to the problem concerning the realized expectations, given the referred network externalities, it interests to identify and clarify the existence of dynamic and interactive forces between the supply and the demand, as was proposed, in theoretical terms, by Geroski (2003), as well as the resultant implications, in terms of the vertical integration of services and pricing strategies, on the part of the cable television operators.
In the present study, the following hypotheses are considered:
- Hypothesis 1: The penetration rate of cable television services presents a positive relation with the price of the basic service.
6
This analysis is obtained through the application of a VAR Model, which allows performing an interpretative analysis of the external shocks to the system.
- Hypothesis 2: The vertical integration of services has a negative effect on the price of the basic service.
- Hypothesis 3: The penetration rate of cable television services has a positive relation with basic demand.
- Hypothesis 4: The basic demand intensifies the vertical integration of services.
- Hypothesis 5: The basic demand has a negative relation with price, in the bigger dimension network.
- Hypothesis 6: The basic demand has a positive relation with price, in the smaller dimension network.
4.THE ECONOMETRIC STUDY
In this item, an econometric study7 is developed for the two main cable television operators in Portugal, TV Cabo (since the 1stT: 1995, until the 3rdT:2003)8 and Cabovisão (from 4thT: 1996, until 3rdT:2003), using the same selected VAR model.
4.1.INTEGRATION ORDER OF THE VARIABLES
An important subject for using the VAR model is the analysis and evaluation of the time series used in the study, since the VAR model presupposes that this series is stationary. First, we will evaluate if the time series are integrated or not, and, then, if so, we will determine the integration order of the variables, in order to find the best way for making it stationary.
7
The data was collected from Autoridade Nacional de Comunicações (ANACOM).
8
For example, the period between the first Trimester of 1995 and the third Trimester of 2003, is represented by: 1stT: 1995, till the 3rdT:2003).
To determine the integration order of the variables, we will consider the tests proposed by Dickey and Fuller (1979), which will establish the specifications of a model including an endogenous lagged variable, expressed by the following:
t t
t Y
Y = ρ −1+ε (1.)
Therefore, the following null hypothesis is tested: H0:ρ =ρ0, ρ0 <1 (2.)
This test can be made, using the t statistic, or the following statistic: ) 1 , 0 ( ˆ ˆ 0 N S ≈ − ρ ρ ρ (3.)
where ρˆ is the estimate of the ordinary least square, for the parameter ρ; and Sρˆ is the estimate of the standard deviation of ρˆ .
According to Dickey and Fuller (1979), to test the null hypothesis (of existence of a unit root), against the alternative hypothesis, three different models should be taken into consideration, namely:
t t
t Y
Y = ρ −1+ε (without constant, and without tendency) (4.) t
t
t Y
Y =µ+ρ −1+ε (with constant, and without tendency) (5.) t
t
t t Y
Y =µ+β +ρ −1+ε (with constant, and with tendency) (6.)
In practice, the tests proposed by Dickey and Fuller (1979) consist of the estimation of the three equations previously presented (4., 5., and 6.), through the use of the method of the Ordinary Least Square (OLS), and of the realization of the forementioned test of statistical
significance (H0:ρ =1). In an alternative way, we may estimate the following equations: t t t Y Y =γ +ε ∆ −1 (7.) t t t Y Y =µ+γ +ε ∆ −1 (8.) t t t t Y Y =µ+β +γ +ε ∆ −1 (9.)
where γ =ρ−1; in this case, the test of the null hypothesis H0:ρ =1, is equivalent to the test of the hypothesis H0:γ =0. The alternative hypothesis isexpressed by H1:γ <0.
An alternative to the forementioned DF tests is the use of the Augmented Dickey-
-Fuller Test (ADF), including a minimum number of lags in the dependent variable, in order
to eliminate the possible observance of error autocorrelation.
Marques (1998) advocates that, during the first phase of the ADF tests, we should
follow the same logic as the simple DF tests, whereas, in the second phase, we should carry
out the tests of the null hypotheses. So, we consider the results obtained through the estimation of the three following models:
t j t p j j t t Y Y Y =γ + δ ∆ +ε ∆ − − = −
∑
1 1 1 (10.) t j t p j j t t Y Y Y =µ+γ + δ ∆ +ε ∆ − − = −∑
1 1 1 (11.) t j t p j j t t t Y Y Y =µ+β +γ + δ ∆ +ε ∆ − − = −∑
1 1 1 (12.)In the DF
( )
γ tests and the ADF( )
γ tests, the null hypothesisH0:γ =ρ−1=0, is tested, against the alternative hypothesisH1:γ <0. The non-rejection of H0, when γˆ is nonsignificant, leads to the conclusion that the time series is not stationary (that is, integrated), or that it presents a unit root.
In order to specify the model which provides the best adjustment, we make use of two different information criteria, that is, the Akaike Information Criteria (AIC), and the Schwarz
Bayesian Criteria (SBC), in order to select the model which minimizes the values obtained for
the forementioned criteria.
For detecting error autocorrelation, the LM test is used, and we also calculate the
probability of the Q statistic, originally, proposed by Ljung and Box (1979), taking into
consideration the correlograms generated from the estimation process. Next, the results of the
Table 2. – The DF Tests and the ADF Tests, with constant and with tendency, at a 5% significance level – TV Cabo (bp variable)
DF Tests and ADF Tests Variable Observedδ Lags Criticalδ
AIC SBC PQ(12) LM Test
bp -2,6236 0 -3,5484 -5,1195 -4,9848 0,150
LM1=0,7177 LM4=0,4454
Notes:
[1] The bp variable is the price of the basic cable television service.
[2] The time series that is used here corresponds to the natural logarithm of the variable in study.
[3] The number of lags included in the models, is the one which provides the elimination of the error autocorrelation. [4] The critical value was collected from MacKinnon (1996).
Since the observedδ , in module, is smaller than the correspondent critical value, in module, too, so theH0 is not rejected, at a 5% significance level
( )
α . From this, we can conclude that the time series( )
bp is integrated, or that it has a unit root.Table 3. – The DF Tests and the ADF Tests, with constant and without tendency, at a 5% significance level – TV Cabo (pen and bd variables)
DF Tests and ADF Tests
Variables Observed δ Lags Critical δ AIC SBC PQ(12) LM Test
pen -2,4546 3 -2,9604 -2,7764 -2,5451 0,504 LM1=0,5216 LM4=0,0989 bd -2,7175 1 -2,9540 1,4985 1,6346 0,848 LM1=0,3304 LM4=0,4665 Notes:
[1] The pen variable is the penetration rate of the cable television service; and the bd is the variation of the number of subscribers of the cable television service.
[2], [3], and [4] are applied in a similar way.
As the observedδ , in module, is smaller than the critical values, in module, so the H0
is not rejected, at a 5% significance level, from this we can conclude that the time series
( )
pen and( )
bd are also integrated, or that they have a unit root.The endogenous variables that are going to be included in the VAR model, for the incumbent operator, such as, the penetration rate (pen), the variation of the demand for cable
television (bd), and the price of the basic service (bp), are not stationary, or integrated. The
variables, in first differences, are stationary, so the three time series, in study, are integrated of order 1, or I(1).
In the case study of Cabovisão, the results obtained from the process of determination of the integration order of the variables, are transcribed in the tables presented below.
Table 4. – The DF Tests and the ADF Tests, with constant and with tendency, at a 5% significance level – Cabovisão (bp variable)
DF Tests and ADF Tests Variable Observed δ Lags Critical δ
AIC SBC PQ(12) LM Test
bp -2,9654 0 -3,5875 -4,6194 -4,4754 0,112
LM1=0,2858 LM4=0,6529
In this case, the observedδ , in module, is smaller than the critical value, in module, so the H is not rejected, at a 5% significance level. From this, we can derive that the time 0
series (bp) is integrated, or that it has a unit root.
Table 5. – The DF Tests and the ADF Tests, with constant and without tendency, at a 5% significance level – Cabovisão (pen and bd variables)
DF Tests and ADF Tests Variables Observed δ Lags Critical δ
AIC SBC PQ(12) LM Test pen -0,9982 2 -2,9862 -2,0316 -1,8366 0,351 LM1=0,7856 LM4=0,8722 bd -2,5216 0 -2,9762 2,7557 2,8517 0,837 LM1=0,7674 LM4=0,7288
Since the δ observed, in module, are smaller than the critical values, in module, so the 0
H is not rejected, at a 5% significance level. From this, in the entrant case, we can also
derive that the time series (pen, and bd), are integrated, or that they have a unit root.
Therefore, the variables that are going to be included in the VAR model applicable to the entrant are not stationary, or integrated. The variables, in first differences, are also stationary. This find confirms that the original series are I(1).
4.2.THE VARMODEL
After determining the integration order of the variables, which reveal that the totality of the variables is integrated of order 1, we proceed to present the VAR model that is going to
be tested. The VAR model is constituted by a system with four equations, including four endogenous variables, shown in the following way:
t k p p t p k p p t p k p p t p k p p t p t t pen bd bp vis u pen 1 1 1 1 1 1 1 1 1 1 + + + + Ω + =
∑
∑
∑
∑
= − = − = − = − θ σ β α t k p p t p k p p t p k p p t p k p p t p t t pen bd bp vis u bd 2 1 2 1 2 1 2 1 2 2 + + + + Ω + =∑
∑
∑
∑
= − = − = − = − θ σ β α t k p p t p k p p t p k p p t p k p p t p t t pen bd bp vis u bp 3 1 3 1 3 1 3 1 3 3 + + + + Ω + =∑
∑
∑
∑
= − = − = − = − θ σ β α t k p p t p k p p t p k p p t p k p p t p t t pen bd bp vis u vis 4 1 4 1 4 1 4 1 4 4 + + + + Ω + =∑
∑
∑
∑
= − = − = − = − θ σ β α (13.)where: pen is the penetration rate of the Cable Television Service or network density,
calculated by the quotient between the number of subscribers and the number of cabled households;
bd is the variation of the number of subscribers of the basic cable television service; bp is the price of the basic cable television service;
vis is the dummy variable concerning the vertical integration of services (equal to 0, if does
not exist vis, and equal to 1, otherwise);
p = 1,…,k is the number of lags, taking k as the optimal number of lags (pmax);
and t is the corresponding trimester.
4.2.1. Optimal Number of Lags
Now, we proceed to the selection of the optimal number of lags (pmax), considering the
results of five different information criterias, namely, the Likelihood Ratio (LR), the Final
Prediction Error (FPE), the Akaike Information Criteria (AIC), the Schwarz Bayesian Criteria
(SBC), and the Hannan and Quinn Criteria (HQ). Firstly, we present the results concerning to
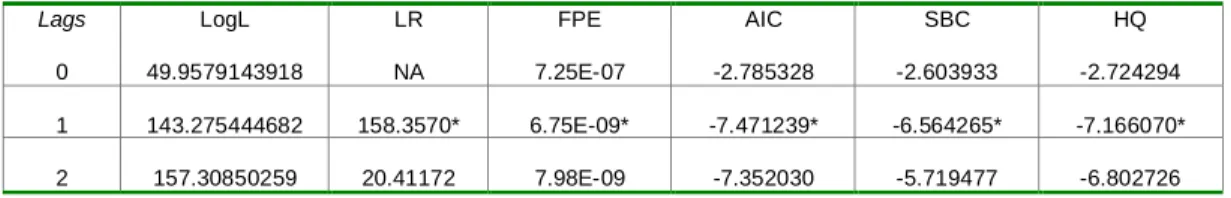
Table 6. – Selection of the Optimal Number of Lags – TV Cabo
Lags LogL LR FPE AIC SBC HQ
0 49.9579143918 NA 7.25E-07 -2.785328 -2.603933 -2.724294 1 143.275444682 158.3570* 6.75E-09* -7.471239* -6.564265* -7.166070* 2 157.30850259 20.41172 7.98E-09 -7.352030 -5.719477 -6.802726
Legend: NA = Not Available; * It identifies the optimal number of lags selected by each information criteria.
In order to determine the existence (or not) of error autocorrelation, we present the results of the LM tests, and the probabilities of the Q statistic (PQ(12))9, and the probabilities of the corresponding adjusted value (PQ(12) Ad.).
Table 7. – Detection of Error Autocorrelation in the TV Cabo VAR Model
Legend: * It identifies the number of lags which provides the minimization of the values of the information criterias: AIC and SBC.
By the results of the tests for detecting an hypothetic error autocorrelation, simulating VAR models, with 1 and 2 lags, respectively, we found that the VAR model should be
estimated, using just 1 lag, since this option provides the minimization of the values of the
information criterias: AIC and SBC; guaranteeing also the inexistence of error autocorrelation.
In what concerns to the case of Cabovisão, the results obtained from the process for selecting the optimal number of lags (pmax) are transcribed in the Table 8. presented below.
Table 8. – Selection of the Optimal Number of Lags – Cabovisão
Lags LogL LR FPE AIC SBC HQ
0 9.80377157291 NA 7.52E-06 -0.446444 -0.252891 -0.390708
1 64.1135519039 87.73118 4.03E-07 -3.393350 -2.425584* -3.114668
2 88.3902574284 31.74646* 2.35E-07* -4.030020* -2.288040 -3.528393*
Legend: Nd = Not Available; * It identifies the optimal number of lags selected by each information criteria.
9
In the present case, we have a reduced number of observations; therefore, it is not convenient to use a big number of lags. For this reason, we consider only the probability of 12 coefficients of autocorrelation to be equal to zero (Marques, 1998).
Lags AIC SBC PQ(12) PQ(12) Ad. Teste LM
1 -5,9975* -4,3649* 0,9994 0,8772 LM1= 0,2598 LM4= 0,2009
2 -5,6593 -3,2775 0,9986 0,8494 LM1= 0,0864 LM4= 0,3000
In order to determine the occurrence (or not) of error autocorrelation, the results of the
LM tests are presented, as well as the probabilities associated to the Q statistic (PQ(12)) and
to the corresponding adjusted value (PQ(12) Ad.).
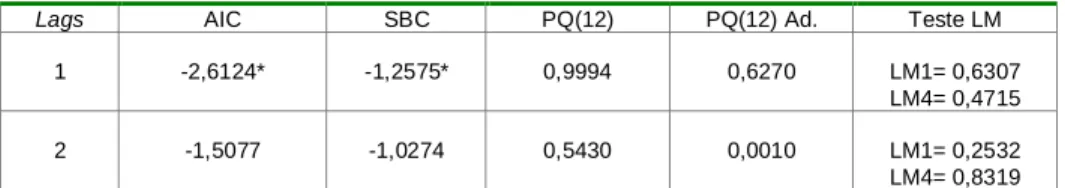
Table 9. – Detection of Error Autocorrelation in the Cabovisão VAR Model
Lags AIC SBC PQ(12) PQ(12) Ad. Teste LM
1 -2,6124* -1,2575* 0,9994 0,6270 LM1= 0,6307 LM4= 0,4715 2 -1,5077 -1,0274 0,5430 0,0010 LM1= 0,2532 LM4= 0,8319
Legend: * It identifies the number of lags which provides the minimization of the values of the information criterias: AIC and SBC.
Lütkepohl (1999) states that the AIC overestimates the order, in an asymptotic way,
with positive probability, whereas the SBC provides the estimation of the order, in a
consistent way, if the VAR process for generating information has a finite order. Therefore, we proceed with the estimation of a VAR model, with one lag, taking into consideration, on the one hand, the result of the SBC, and on the other hand, the reduced number of
observations (only, 28 trimesters), and the use of four variables in the estimation process. Besides, by carrying out several tests, it was verified that this model provides the minimum values for the AIC and the SBC, without occurrence of error autocorrelation.
4.2.2. Cointegration Tests
Based on the cointegration concept developed by Engle and Granger (1987), if from a VAR model there results a unique cointegrating vector, then this reveals the existence of a long term economic relation between the variables, in study, which is expressed, in mathematical terms, by a system constituted by I(1) variables (not stationary), which produce
a linear combination that is stationary, or I(0).
In the methodology proposed by Johansen (1988, 1991), and Johansen and Juselius (1990), it is established the possibility of existence of more than one cointegrating vector, through the determination of the largest possible number of cointegrating vectors, in function of the totality of the endogenous variables included in the system. For this purpose, it can be taken as a reference, a VAR model with an order equal to p, including a Y vector with an
order n, which contains the totality of the variables (integrated of order 1, that is, I(1))
expressed by the following:
∑
= − + Φ + = p i t i t i t Y Y 1 ε µ (15.)where Yt is the vector of integrated variables of order 1, of the type (nx1); Φi is the matrix of the parameters (nxn); µ is the vector of the deterministic terms; and εt is the vector of the white noise residuals (nx1).
The error correction model is expressed in the following way:
∑
− = − − + Π + Γ∆ + = ∆ 1 1 p i t i t i t t Y Y Y µ ε (16.)where Γ is the matrix of short term relations; and Π is the matrix of long term relations.
The rank of Π (that is, r) corresponds to the number of linearly independent vectors,
that is, the number of cointegrating vectors, obtained from the endogenous variables included in the Yt vector . In this context, we can consider three possible scenarios:
a) If r
( )
Π =0, then there are no stationary combinations. In this case, we should estimate a VAR model with the variables expressed in first differences.b) If r
( )
Π =n, then the Y vector is stationary. In this case, we should estimate a VAR tmodel with the variables expressed in level.
c) If r
( )
Π =r<n, then there are r cointegrating vectors which correspond to the number ofequilibrium relations, in the long term.
Based on the principle of the maximum likelihood, for making significant contrast between the number of Eigenvalues of the Π matrix, we are going to consider the following statistics (Johansen and Juselius, 1990):
i) The Trace Statistic
(
λTrace)
(17.)This statistic provides the contrast between the null hypothesis
( )
H0 , that is, the number of cointegrating vectors is smaller or equal to r, and the alternative hypothesis( )
H1 , that is, the number of cointegrating vectors is bigger than r, that is, H0:r≤r0, against0 1:r r
ii) The Max-Eigenvalue Statistic
(
λMax)
(18.) These statistics provide the contrast between the( )
H0 , that is, the number of cointegrating vectors is equal to r, and the( )
H , that is, the number of cointegrating vectors is 1equal to r+1, that is,H0:r=r0 againstH1:r=r0+1.
In the case of TV Cabo, the results of the cointegration tests proposed by Johansen and Juselius (1990) are transcribed in the Table (10.) presented below.
Table 10. – Cointegration Tests – TV Cabo
Hypothesis Hypothesis Critical Values
EV H0 H1 λλλλMax H0 H1 λλλλTrace λλλλMax λλλλTrace
0.568603 r=0 r=1 27.74401 r=0 r>0 58.49374* 27.07 47.21 0.411969 r=1 r=2 17.52219 r≤1 r>1 30.74973* 20.97 29.68 0.272025 r=2 r=3 10.47714 r≤2 r>2 13.22754 14.07 15.41 0.079967 r=3 r=4 2.750401 r≤3 r>3 2.750401 3.76 3.76
Notes:
[1] The time series that are used, correspond to the natural logarithms of the variables pen, bd, bp, and the dummy regarding the vis. [2] The first column corresponds to the Eigenvalues (EV).
[3] The critical values of the statistics of the Trace Statistic and of the Max-Eigenvalue Statistic, at a significance level of 5%, were collected from Osterwald-Lenum (1992).
* It denotes the rejection of the initial hypothesis, at a significance level of 5%.
By observing the third line of the Table (10.), we see that the values obtained for Max--Eigenvalue Statistic and for the Trace Statistic are smaller than the critical values. Therefore, the
( )
H0 relating to the existence of two cointegrating vectors cannot be rejected, against the( )
H concerning to the existence of at least three cointegrating vectors, at a confidence level 1 of 95%. The integrated variables of order 1 have similar behaviours in the long term, and theirrepresentation is according to the two cointegrating vectors which will be incorporated in the VAR model, as error correction terms.
In what concerns the case of Cabovisão, the results of the cointegration tests are seen in the Table (11.) presented below.
Table 11. – Cointegration Tests – Cabovisão
Hypothesis Hypothesis V. Críticos
EV H0 H1 λλλλMax H0 H1 λλλλTrace λλλλMax λλλλTrace
0.622683 r=0 r=1 25.34141 r=0 r>0 50.91245* 27.07 47.21 0.389837 r=1 r=2 12.84475 r≤1 r>1 25.57104 20.97 29.68 0.295874 r=2 r=3 9.120738 r≤2 r>2 12.72630 14.07 15.41 0.129489 r=3 r=4 3.605558 r≤3 r>3 3.605558 3.76 3.76
Notes:
[1], [2], and [3] are applied in the same way.
From the analysis of the second line of Table (11.), we note that the observed values for the Max-Eigenvalue Statistic and for the Trace Statistic are smaller than the critical values. Thus, the null hypothesis, which states the existence of a unique co-integrating vector, cannot be rejected, with a confidence level of 95%.
According to the results previously presented, the variables I(1) included in the system
present a similar behaviour in the long term, and the corresponding representation is in conformity with the only one cointegrating vector, which will be included later in the VAR model with an error correction term (ECT).
4.3.THE DYNAMIC ANALYSIS
In the present item, an interpretative analysis is made of the totality of the endogenous variables included in the model, which permits us to make a dynamic simulation of the effects originated by the shocks in the different random disturbances of the system, and to show the importance of each shock by the portion of the variance of the forecast error explained by each endogenous variable.
4.3.1. Granger Causality
The causality relations, defined in the terms originally proposed by Granger (1969), represent the capacity of a variable (X) included in the system, to assist the forecast of another
variable (Y), equally included in the system.
According to Sims (1980, p.29), «a test for block-exogeneity has special interest, in the context of a VAR model, because it examines how it will account for the observed cyclical variability of the economy».
In the present case, the contrast of the significance of each causality relation is made, observing the values of the statistics, at two significance levels, 5% and 10%, respectively, whereas in the detection of the significance of the ECT, the t statistic is used.
In the case of TV Cabo, the use of the exogeneity tests yielded the results presented in Table (12.), where the values corresponding to the penetration rate of cable television service (pen), the variation of the number of subscribers to the basic cable television service (bd), and
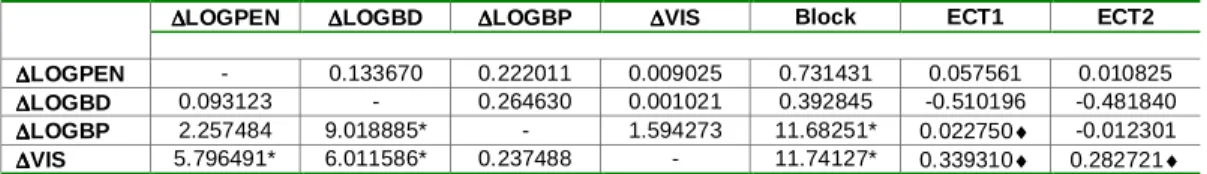
Table 12. – The Granger Causalities Contrasts – TV Cabo
∆∆∆∆LOGPEN ∆∆∆∆LOGBD ∆∆∆∆LOGBP ∆∆∆∆VIS Block ECT1 ECT2
∆∆∆∆LOGPEN - 0.133670 0.222011 0.009025 0.731431 0.057561 0.010825
∆∆∆∆LOGBD 0.093123 - 0.264630 0.001021 0.392845 -0.510196 -0.481840
∆∆∆∆LOGBP 2.257484 9.018885* - 1.594273 11.68251* 0.022750♦ -0.012301
∆∆∆∆VIS 5.796491* 6.011586* 0.237488 - 11.74127* 0.339310♦ 0.282721♦
Notes:
[1] For a better understanding of Table (12.), consider the variable or the block, expressed in each column, as being the independent variable (that is, the origin of the causality), and the variable presented in line, as being the dependent variable (that is, the destiny of the causality).
[2] The causality contrasts are made through the application of the χ2 statistic, with one degree of freedom, whereas the significance contrasts applied to the coefficients of the error correction terms (ECT1, and ECT2), are made through the use of the t statistic.
* Significance level: 5%.
♦ The coefficient is significant, since the absolute value of the t statistic t is bigger than the critical value.
Analysing the Granger Causality Contrasts applied to the case of TV Cabo, we can observe that the variation of the basic demand (bd) causes, in a Granger sense, the price of the
basic service (bp), at a significance level of 5%. Considering the price of the basic service
(pb) as the dependent variable, the block of variables constituted by the remaining variables
included in the system, namely, the penetration rate (pen), the variation of the basic demand
(bd), and the vertical integration of services (vis), causes, in a Granger sense, the price of the
basic service, at a significance level of 5%.
With regard to unidirectional causality, defined in the sense ∆bd →∆bp (that is, demand → price), we see confirmation of the fact that the dynamics of the demand of the network services affect the pricing strategy implemented by the incumbent, making use of package tie-in sales of vertically-integrated services, which allows a greater valorisation of these services, on the part of the subscribers.
In terms of unidirectional causalities, the observance of a causality defined in the sense ∆bd →∆vis must be stressed (that is, demand → vertical integration of services), which is justifiable by the effect of the demand pull. This effect is produced by the contribution of the basic demand for intensifying the vertical integration of services, expressing the interactivity between the demand of this kind of network services and the vertically-integrated supply, on the part of the incumbent.
There is also detected a unidirectional causality which is defined in the sense
vis
pen→∆
∆ (that is, penetration rate → vertical integration of services), which is justified by the strategic choice of the incumbent, reinforcing the network density, which precedes the introduction of new vertically-integrated services.
Concerning to the joint-causality revealed by the remaining variables relative to the strategy of vertical-integration of services, we observe that the mixed action of the demand, of the price of the basic service, and of the increase of the network density, as a mechanism for reinforcing the market power does precede the implementation of the strategy of vertical integration of services, on the part of the incumbent.
As concerns the block of the remaining variables, the existence of a relation of independence was verified among the variables. This situation can be justified by the reduced number of observations that is used in the present study.
In the case of Cabovisão, the application of the blocks-exogeneity tests provided the results that are presented in Table (13.), where the values of the total of the variables were, previously, logarithmized.
Table 13. – The Granger Causalities Contrasts – Cabovisão
∆∆∆∆LOGPEN ∆∆∆∆LOGBD ∆∆∆∆LOGBP ∆∆∆∆VIS Block ECT1
∆∆∆∆LOGPEN - 1.995735 5.765997* 0.429301 6.329231** -0.219605♦
∆∆∆∆LOGBD 0.036362 - 1.061835 0.086733 1.524532 0.204241
∆∆∆∆LOGBP 0.281001 0.231371 - 0.080154 0.614640 0.052112♦
∆∆∆∆VIS 0.000246 0.778378 0.088809 - 1.491488 -0.169091
Notes:
[1] For a better understanding of Table (13.), consider the variable or the block, expressed in each column, as being the independent variable (that is, the origin of the causality), and the variable presented in line, as being the dependent variable (that is, the destiny of the causality).
[2] The causality contrasts are made through the application of the χ2 statistic, with one degree of freedom, whereas the significance contrasts applied to the coefficients of the error correction term (ECT1), are made through the use of the t statistic.
* Significance level: 5%. ** Significance level: 10%.
♦ The coefficient is significant, since the absolute value of the t statistic t is bigger than the critical value.
Using the analysis of the causality contrasts, we found a unidirectional causality defined, in the sense, ∆bp→∆pen (that is, price → penetration rate). From here, we conclude that the price of the basic service causes, in a Granger sense, the penetration rate (which measures the network density), at a significance level of 5%.
Considering the network density as the dependent variable, we observed that the block of the remaining variables included in the system causes, in a Granger sense, the penetration rate (network density), at a significance level of 10%. For the remaining blocks of variables we found the existence of relations of independence.
4.3.2. Variance Decomposition of Cholesky
Next, in the case of TV Cabo, the results of the variance decomposition of Cholesky, for 4, 8, 12, and 24 Trimesters, are presented, taking into consideration the percentage weights, for each possible causality relation10.
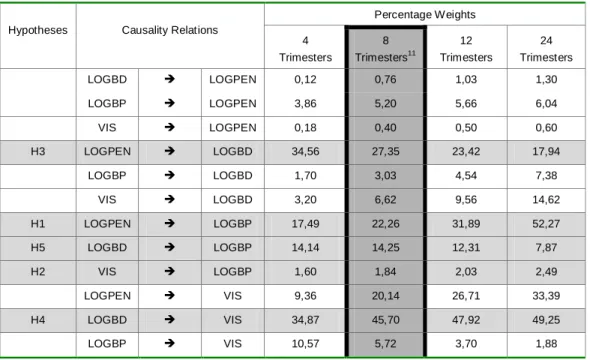
Table 14. – Percentage Weights of the Causality Relations – TV Cabo
Percentage Weights Hypotheses Causality Relations
4 Trimesters 8 Trimesters11 12 Trimesters 24 Trimesters LOGBD LOGPEN 0,12 0,76 1,03 1,30 LOGBP LOGPEN 3,86 5,20 5,66 6,04 VIS LOGPEN 0,18 0,40 0,50 0,60 H3 LOGPEN LOGBD 34,56 27,35 23,42 17,94 LOGBP LOGBD 1,70 3,03 4,54 7,38 VIS LOGBD 3,20 6,62 9,56 14,62 H1 LOGPEN LOGBP 17,49 22,26 31,89 52,27 H5 LOGBD LOGBP 14,14 14,25 12,31 7,87 H2 VIS LOGBP 1,60 1,84 2,03 2,49 LOGPEN VIS 9,36 20,14 26,71 33,39 H4 LOGBD VIS 34,87 45,70 47,92 49,25 LOGBP VIS 10,57 5,72 3,70 1,88
Considering the analysis based on the variance decomposition of Cholesky, proposed by Sims (1980), we conclude that only the price has a direct and significant impact on the penetration rate (that is, the network density).
For a forecast horizon with 8 trimesters, the direct impact over the network density (logpen), was calculated at 0,76%, by action of the basic demand (logbd); at 5,20%, through the price (logbp), and at 0,40%, across the vertical integration of services (vis). Thus, the price presents a causality relation relative to the network density. The same does not happen with the two other variables.
The network density and the vertical integration of services have a direct and significant impact on the basic demand, whereas the price of the basic service does not present a significant impact on the behaviour of the basic demand.
10
For a graphic representation about the Variance Decomposition of Cholesky (24 Trimesters) – TV Cabo, please see the Graph 1, of the Annex 1.
11
We only consider as direct and significant impacts over the variance of the forecast error, values bigger than 5%, for a forecast horizon with 8 Trimesters (Goux, 1996, p.671).
For a forecast horizon of 8 trimesters, the direct impact on the demand (logbd) was calculated at 27,35%, by action of the network density (logpen), at 6,62%, across the vertical integration of services (vis), and at 3,03%, through the price of the basic service (logbp).
Although the network density has the most significant impact on the basic demand; it presents a decreasing effect, along the forecast horizon. This fact confirms the importance of the supply push as a mechanism for expanding the subscribers mass, and for attaining the interactivity between the supply and the demand of network services. The vertical integration of services presents a persistent and growing effect on the basic demand, which reinforces the logic of the operator in offering, more and more, new vertically-integrated services, in order to expand the number of subscribers to the basic demand, which works as an obligatory anchor for the subscription to other complementary and integrated services.
For a forecast horizon of 8 trimesters, we found that the direct impact on the price of the basic service (logbp), was calculated at 22,26%, by action of the network density (logpen), at 14,25%, across the basic demand (logbd), and at 1,84%, through the vertical integration of services (vis).
Consequently, the results obtained by the analysis of the variance decomposition confirm the previously detected unidirectional causalities of the network density, and of the demand, relative to the vertical integration of services.
For a forecast horizon of 8 trimesters, the direct impact on the vertical integration of services (vis) was calculated at 20,14%, across the network density (logpen), at 45,70%, by action of the basic demand (logbd), and at 5,72% through the price (logbp).
From this, we conclude that the basic demand presents a strong causality relative to the strategy of vertical integration of services, implemented by the incumbent, which signals the importance of the demand pull in the diffusion of new vertically integrated services.
In the case of Cabovisão, the results of the variance decomposition, for 4, 8, 12, and 24 Trimesters, are transcribed in the Table 15 12.
12
For a graphic representation of the Variance Decomposition of Cholesky (24 Trimesters) – Cabovisão, please see the Graph 2, of the Annex 2.
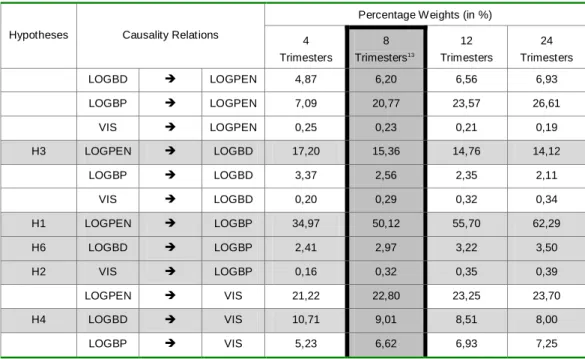
Table 15. – Percentage Weights of the Causality Relations – Cabovisão
Percentage Weights (in %) Hypotheses Causality Relations
4 Trimesters 8 Trimesters13 12 Trimesters 24 Trimesters LOGBD LOGPEN 4,87 6,20 6,56 6,93 LOGBP LOGPEN 7,09 20,77 23,57 26,61 VIS LOGPEN 0,25 0,23 0,21 0,19 H3 LOGPEN LOGBD 17,20 15,36 14,76 14,12 LOGBP LOGBD 3,37 2,56 2,35 2,11 VIS LOGBD 0,20 0,29 0,32 0,34 H1 LOGPEN LOGBP 34,97 50,12 55,70 62,29 H6 LOGBD LOGBP 2,41 2,97 3,22 3,50 H2 VIS LOGBP 0,16 0,32 0,35 0,39 LOGPEN VIS 21,22 22,80 23,25 23,70 H4 LOGBD VIS 10,71 9,01 8,51 8,00 LOGBP VIS 5,23 6,62 6,93 7,25
The analysis of the causality relations revealed that the variation of the basic demand, and the price have a direct and persistent effect on the penetration rate (or, network density). For 8 trimesters, the direct impact on the network density (logpen) was calculated at 6,20%, by action of the basic demand (logbd), at 20,77%, through the price (logbp), and at just 0,23%, across the vertical integration of services (vis).
Taking into consideration the previous finding related to the existence of a unidirectional causality relation between the price and the network density, we observe that the price has the most significant and persistent impact on the network density, while the effect due to the variation of the basic demand just increases 2,06 percentage points, in the forecast period between the 4th and the 24th trimesters.
In what concerns the analysis of the causality relations between the variables of the second block, we must stress that the network density only has a significant impact on the basic demand. The price and the vertical integration of services do not present a direct and significant impact on the basic demand.
13
As it was, previously, considered in the incumbent case, we also consider as direct and significant impacts on the variance of the forecast error, values bigger than 5%, for a forecast horizon with 8 Trimesters (Goux, 1996, p.671).
For 8 trimesters, we observe that the network density (logpen), presents the most significant impact, reaching 15,36%, being followed by the price (logbp) at 2,56%, and in the last place, the vertical integration of services (vis), which only contributes 0,29% of the explained variance of the forecast error of the basic demand (logbd).
In terms of the direct impacts on the price of the basic service (logbp), we must stress that the network density (logpen) is the one which presents a more significant and persistent effect, since after 8 trimesters, it contributes for 50,12% of the explained variance of the forecast error of the price.
All the variables show a significant impact on the vertical integration of services. This situation is confirmed by the contributions obtained for the explanation of the variance of the forecast error of the vertical integration of services (vis), where a forecast horizon with 8 trimesters, which were calculated at 22,80%, through the network density (logpen), at 9,01%, by the action of the basic demand (logbd), and at 6,62%, across the price (logbp).
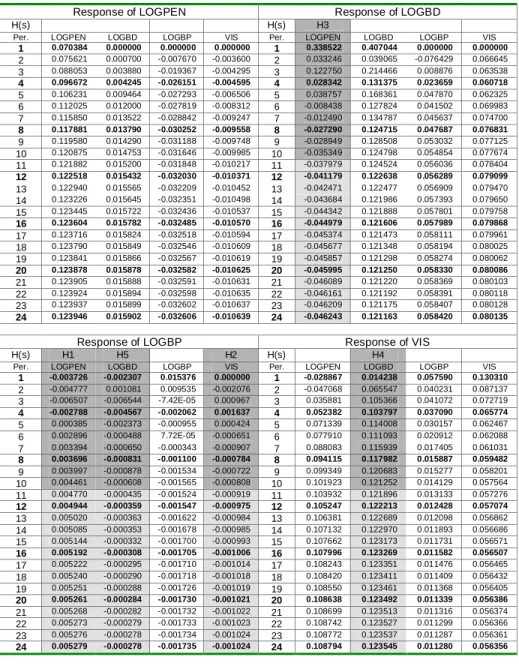
4.3.3. Impulse-Response Functions
In the case of TV Cabo14, the values of the Impulse-Response Functions, provide the interpretations that are presented here. Firstly, the response of the price relative to the impulses in the penetration rate is relatively insignificant, showing a negative impact after the shock that lasts until the 4th trimester. Although the response of the price relative to the impulses in the penetration rate is negative in the first four trimesters, the sign of the causality weight is positive15.
This is in contrast to the result obtained through the variance decomposition, which has revealed the existence of a significant impact of the penetration rate on the price of the basic service. From here, the deduction of a positive relation between the penetration rate and the price can be made, that is, for an increase in the network density; there is a corresponding increase in the price of the basic service.
Secondly, the response of the price relative to the innovations which occurred in the vertical integration of services is null, in the present period, becoming negative, in the second period. Later on, it is positive, assuming negative values starting from the 6th trimester.
14
For more details, please consult the Table 16, of the Annex 1.
15
According to Goux (1996), the signal of the causality weight is obtained through the sum of the values of the coefficients of the impulse-response functions, which are obtained for a forecast horizon of 10 trimesters.
The negative relation between the vertical integration of services and the price of the basic service confirms the statistical inference of the analysis of the variance decomposition, which pointed out the existence of a non-significant impact of the vertical integration of services on the price.
In the case of TV Cabo, the strategy of vertical integration of services assumes special importance in maximizing the profits obtained by this operator, which is vertically integrated in the Grupo PT, since this situation facilitates the supply of additional services with increased value for the subscribers, obtaining a reduction in the production costs through the property of complementary monopolies16 conjugated with a solid brand image of the Mother- -Company, which permits the reinforcement of the market power of the incumbent.
Thirdly, the response of the basic demand relative to the impulses in the penetration rate is positive and significant, only reaching a negative value starting from the 6th trimester. This result confirms the main results of the analysis of the variance decomposition. On the one hand, this positive relation reveals the importance of the supply push promoted by the incumbent, through the expansion of the number of cabled households which provides the utilization of the interactivity between the supply and the demand of network services, considering that the supply “pushes” the additional subscription of vertically integrated network services, through the same cable distribution network. On the other hand, this confirms the capacity that the monopolist has to influence the consumers' expectations, forcing the referred consumers to subscribe to the services offered through the bigger dimension network.
Fourthly, the response of the vertical integration of services relative to the impulses in the basic demand is positive and significant, assuming a stable value starting from the 15th trimester. This confirms the result obtained through the analysis of the variance decomposition, which has, previously, indicated the existence of a direct and significant impact of the basic demand on the vertical integration of services.
The importance of the effect of demand pull on the implementation of the strategy of vertical integration of services implemented by the incumbent, referred by Geroski (2003), is also ratified. This effect is expressed by the fact that the basic demand “pulls” the introduction of new vertically integrated services.
16
This situation reflects the dominant position exercised by the historic operator: Portugal Telecom (PT); in the different Telecommunications Subsectors in Portugal, and the simultaneous property of the national fixed telephone network, and the cable network.
Fifthly, the response of the price in relation to the impulses in the basic demand is negative and not very significant. This result is in contrast with the inference obtained through the analysis of the variance decomposition, which has revealed the existence of a significant impact of the demand on prices of the basic service.
In the case of Cabovisão, the values of the impulse-response functions revealed that the response of the price in relation to the impulses in the penetration rate, assumes a positive value, which becomes stable from the 14th quarter onwards. This finding confirms the inference obtained through the variance decomposition. Thus, a positive relation between the penetration rate and the price of the basic service is observed, that is, for every increase in the network density of the entrant, there is a corresponding increase in the price of the basic service.
Furthermore, the response of the price relative to the impulses in the vertical integration of services is null, in the present moment, and it is positive, in the second period, starting later to be negative, but insignificant, from the 3th period; and assuming a stable value, from the 11th trimester. This result confirms the statistical inference of the analysis of the variance decomposition, which confirms the existence of a non-significant effect of the vertical integration of services on the price of the basic service.
As concerning the response of the basic demand relative to the impulses in the penetration rate, this is positive and significant, being stable from the 13th trimester onwards. The result obtained through the analysis of the variance decomposition confirms that the penetration rate has a significant effect on the basic demand. This effect can be explained by the fact that the entrant has available a smaller dimension network. This situation provides the internalization of the positive network externalities observed in the initial phases of the distribution network (that is, the release and the expansion phases).
The response of the vertical integration of services relative to the impulses in the basic demand is positive and significant, assuming a stable value, from the 10th trimester onwards. This result is confirmed by the analysis of the variance decomposition, which pointed out the existence of a direct and significant impact of the basic demand on the vertical integration of services, nevertheless the weight of the causality to be smaller than the one detected in the incumbent case.
The response of the price of the basic service relative to the impulses in the demand is positive and non-significant, assuming a stable value, from the 10th trimester onwards. This result is confirmed by the inference obtained through the analysis of the variance decomposition, which pointed out the existence of a non significant impact of the demand on the price. According to the result obtained through the analysis of the variance decomposition, this impact is not very significant, and in comparative terms, it is also smaller than the one that was observed in the incumbent case.
In the entrant case, the discovery that the price of the basic service has a positive relation with the demand, can be justified by the reduced number of subscribers and by the internalization of the strong network externalities that are observed in the initial phases of the distribution network. This comparative result can be justified, on the one hand, by the reduced mass of subscribers owned by the entrant, which attenuates the effect of the demand as a “catalytic” mechanism for the vertical integration of services and, on the other hand, by the observance of a smaller rhythm of diffusion of new vertically integrated services, taking into consideration the possible occurrence of different forms of interactivity between the supply and the demand of services which are transacted through the cable television networks.
5.CONCLUSIONS
From the development of the econometric study applied to the main Portuguese Cable Television Networks, we conclude that the economic variables, in our study, are integrated of order one, and therefore, not stationary. The variables are also cointegrated, denoting the existence of long term economic relations.
In the incumbent case, in what concerns the results of the causality contrasts, three main findings deserve a special mention. First, the demand causes in a Granger sense, the price of the basic service, which reveals the negative impact of the demand on the price. Second, the network density causes in a Granger sense, the vertical integration of services. This ratifies the previous importance of the expansion of the network, in terms of the number of cabled households, which works as a form of supply push. Third, the demand causes in a Granger sense, the vertical integration of services. This ratifies the arguments presented by Geroski (2003), which show the importance of the demand pull for determining the speed of reaction, in terms of the diffusion of new vertically integrated services, on the part of the incumbent.
In the entrant case, the price of the basic service causes in a Granger sense the penetration rate. This allows verifying the importance of the price as a signalling mechanism of the quality of the offered services, and as a financing element of the expansion of the horizontal network dimension.
The differences observed in the causality contrasts reveal the advantage of being the first, obtained by the incumbent, which is "forced" to intensify the vertical integration of services, whereas the entrant implements a strategy which gives a special importance to the physical expansion of the network.
In what concerns to the hypotheses, in study, we have to enhance the existence of a positive relation between the penetration rate and the price of the basic service (see the Hypothesis 1). This finding is in contrast with the results obtained in the studies applied to the cable television industry in the USA, accomplished by Comanor and Mitchel (1971), Park (1972), and Pacey (1985), which pointed out the existence of a negative relation between the penetration rate and the price of the basic service.
In the two Portuguese case studies, the results revealed the importance of increasing the network density (during the initial phases: release, and expansion), in determining the increases in the price of the basic service.
In what concerns the relation between the vertical integration of services and the price of the basic service (see the Hypothesis 2), we find out, in both cases, that the vertical integration of services has a negative impact on the price, nevertheless that impact is observed to be not very significant. This result is in contrast with the results obtained by Mayo and Otsuka (1991), Rubinovitz (1993), and Anstine (2001), which advocated the existence of a positive relation between the price of the basic service and the diversification of cable television offering. Even so, the result now obtained confirms, partially, the findings of Chipty (2001), which pointed out that the premium integration (as it happens in the incumbent case) has a negative effect on the price of the basic service, that is, the operator which practices vertical integration, with premium activities, has an incentive for diversifying the premium services, and for stimulating the demand for these kinds of services, through the offering of smaller basic packages, making use of lower prices.
In both cases, the penetration rate and the demand for the basic service present a positive relation (see the Hypothesis 3). However, compared with the results obtained in the incumbent case, in terms of the coefficients obtained through the impulse-response functions, the penetration rate assumes a greater importance in determining the basic demand in the entrant case. Nevertheless, in both cases, we empirically confirm the theories presented by Geroski (2003), who establishes the importance of the contribution of the supply push for increasing the demand of network services.
The dynamics of the basic demand for promoting even more vertical integration of services (see the Hypothesis 4), assumes a considerable impact, in both cases. This ratifies the thesis of Geroski (2003), which states that the demand pull contributes to an intensification of the rhythm of diffusion of new vertically integrated services.
Finally, we should stress the differences observed in the two cases, in terms of the relation between the basic demand and the price (see the Hypotheses 5, and 6). In the incumbent case, the existence of a negative relation between the demand and the price of the basic service is detected. This finding justifies the partial covering of the national territory, in order to avoid the pressure for decreasing the price of the basic service. In the entrant case, the existence of a positive relation is observed (although the impact of the demand on the price is not very significant). This result is justifiable by the smaller dimension of the entrant network, and by the occurrence of strong network externalities, which are more easily internalized by the entrant, during the release phase of this distribution cable television network.
REFERENCES
ANSTINE, D. (2001), “How Much Will Consumers Pay? A Hedonic Analysis of the Cable Television Industry”, Review of Industrial Organization, 19 (2001): 129 – 147.
BALLABRIGA, F. (1991), “Instrumentacion de la Metodologia VAR”, Documentos de
Trabajo del Banco de España, Banco de España, Servicios de Estudios, N. º 9108, Madrid.
BANERJEE, A.; DOLADO, J.; GALBRAITH, J.; HENDRY, D. (1993), Cointegration, Error
Correction, and the Econometrics Analysis of Non-Stationary Data, Oxford University Press,
New York.
CANOVA, F. (1995), “The Economics of Vector Autoregressions”, In HOOVER, K. (ed.)
Macroeconometrics: Tensions and Prospects, Kluwer, Amsterdam: 30 – 69.
CANOVA, F.; CICCARELLI, M. (2003), “Panel index VAR models: Specification, Estimation, Testing and Leading Indicators”, CEPR Discussion Paper, N.º 4033, August 2003, London.
CHIPTY, T. (2001), “Vertical Integration, Market Foreclosure, and Consumer Welfare in the Cable Television Industry”, The American Economic Review, Vol. 91, N. º 3, June 2001: 428 – 453.
COMANOR, W.; MITCHELL, B. (1971), “Cable Television and the Impact of Regulation”,
Bell Journal of Economics, Vol. 2 (1971): 154 – 212.
DICKEY, D.; FULLER, W. (1979), “Distribution of the estimators for autoregressive Time series with Unit Root”, Journal of the American Statistical Association, 74: 427-431.
ECONOMIDES, N. (1996), “The Economics of Networks”, International Journal of Industrial Organization, Vol. 14, n.º 6, October, 1996: 673 – 699.
ECONOMIDES, N.; HIMMELBERG, C. (1995), “Critical Mass and Network Evolution in Telecommunications”, In BROCK, G. (ed.), Toward a competitive Telecommunications Industry: Selected Papers from the 1994 Telecommunication Policy Research Conference, University of Maryland, College Park, July 1995: 31 – 42.
ENGLE, R.; GRANGER, C. (1987), “Cointegration and Error Correction: Representation, Estimation and Testing”, Econometrica, 55: 251 – 276.
FAVERO, C. (2000), Applied Macroeconometrics, Oxford University Press, Oxford. GEROSKI, P. (2003), The Evolution of New Markets, Oxford University Press, Oxford. GOUX, J-F. (1996), “Le canal étroit du crédit en France”, Revue D’Économie Politique, 106(4), Juill-Août, 1996 : 655 – 681.
GRANGER, C. (1969), “Investigating Causal Relations by Econometric Models and Cross-Spectral Methods”, Econometrica, 37: 424 – 438.
GRANGER, C. (1983), “Co-Integrated Variables and Error-Correcting Models”, unpublished
UCSD Discussion Paper: 83 – 13.
GRANGER, C.; WEISS, A. (1983), “Time Series Analysis of error-Correcting Models”, In
Studies in Econometrics, Time series, and Multivariate Statistics, New York: Academic Press:
255 – 278.
HAMILTON, J. (1994), Time Series Analysis, Princeton University Press, Princeton, New Jersey.
HATANAKA (1996), Time-Series-Based Econometrics: Unit Roots and Cointegration, Oxford University Press, New York.
HAYASHI, K. (1992), “From Network Externalities to Interconnection – The Changing Nature of Networks and Economy”, In ANTONELLI, C. (ed.) The Economics of Information, Elsevier Science Publishers: 195 – 215.
HENDRY, D. (1995), Dynamic Econometrics, Oxford University Press, New York.
HOLTZ-EAKIN, D.; NEWEY, W