Software Risk Management
Practices – 2001
Peter Kulik and Catherine Weber, KLCI August 2001
1.0 Summary
This paper summarizes the results from the Software Risk Management Study performed in the second quarter of 2001 by KLCI. More than 260 software organizations worldwide participated; the results suggest that the vast majority of participants are finding value today in implementing risk management practices:
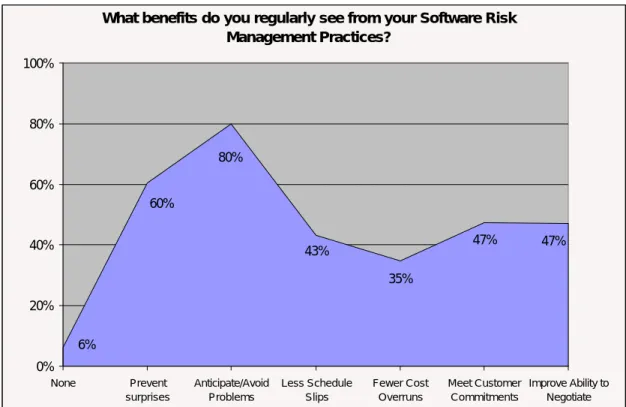
Ø 97% of the participants currently have procedures in place to identify and assess risk Ø 80% identified anticipating and avoiding problems as a primary benefit
Figure 1 summarizes the value that organizations reported to be deriving from their risk management practices.
Figure 1 – Benefits from Software Risk Management Practices
The following sections of this paper discuss: • Participant Demographics
• Risk Management Practices
• Risk Identification and Management Tools
What benefits do you regularly see from your Software Risk Management Practices? 80% 6% 60% 43% 35% 47% 47% 0% 20% 40% 60% 80% 100% None Prevent surprises Anticipate/Avoid Problems Less Schedule Slips Fewer Cost Overruns Meet Customer Commitments Improve Ability to Negotiate
2.0. Participant Demographics
A total of 268 individuals participated in this research study from a wide variety of software organizations worldwide. As shown in Figure 2, almost two-thirds of the respondents have a Project Management office, more than two-thirds have defined Project Management Processes, and 70% have defined Software Development Processes. Participants average 38 concurrent projects and an average of 17 software developers involved per each project.
The participants were self-selecting and solicited by various methods including an e-mail announcement to those registered at http://www.klci.com, and availability to all visitors on KLCI’s website. Respondents included corporations such as Xerox, Motorola, and Lexis Nexis; and government agencies such as the US Navy and NASA. Participants came from a variety of countries including Australia, Canada, France, India, United Kingdom, and United States. Additional demographic information about participants is shown in Figure 2.
Does your organization have a Project Management office (or equivalent)?
64% 36%
Yes No
Does your organization have defined project management processes?
68% 32%
Yes No
Does your organization have defined software development processes?
70% 30%
Yes No
3.0. Risk Management Practices
Participant feedback suggests a well-recognized need for organizations to identify and assess risk. 97% of participants reported stated that they used some approach to identify and assess risk as part of managing software projects.
The most common approach used by respondents is informal risk identification and assessment. The approaches are defined as follows, with a breakdown shown in Figure 3:
Ad-hoc: Identify risks as they appear and manage informally
Informal: Discuss with project staff and document risks Periodic: Use of repeatable procedures to identify and quantify risks Formal: In-depth assessment of risks by independent individuals
Figure 3 - Current Approach Used to Identify and Assess Risks
In addition, many participants described in qualitative terms why they use a particular procedure. Feedback included:
• Common reasons for use of an “Informal” approach included: Ø Lack of procedure
Ø Adequately meets project needs (Project Size/Complexity) Ø Young/immature organization
Ø Team Focus
• Common reasons for use of a “Periodic” approach included: Ø Regularity of assessment
Ø Essential step of project
Ø Used to keep customer/management informed Ø Controls Costs
Today, how do you identify and assess risk in
your software projects?
14% 28% 37% 18% 3% 0% 20% 40% 60% 80% 100%
4.0. Risk Identification and Management Tools
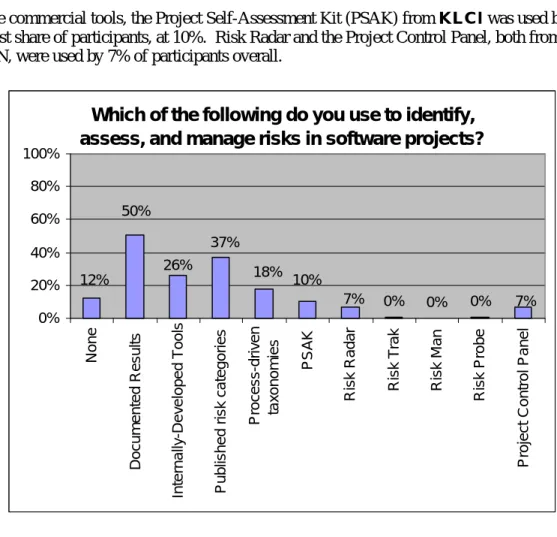
As summarized in Figure 4, 88% of participants use at least one method and/or tool to identify, assess, and manage risks. The most common “tool” used by half of the respondents is
documented results from past projects. In addition, more than one-third of participants reported use of published lists or categories of likely risks. Also, more than one-fourth of the respondents reported use of internally-developed propriety tools.
Of the commercial tools, the Project Self-Assessment Kit (PSAK) from KLCI was used by the highest share of participants, at 10%. Risk Radar and the Project Control Panel, both from SPMN, were used by 7% of participants overall.
Figure 4 - Current Methods/Tools Used to Identify and Assess Risks Other methods or tools identified by participants included:
Ø
BrainstormingØ
Past experience from projectsØ
Risk +Ø
Rational Unified ProcessWhich of the following do you use to identify,
assess, and manage risks in software projects?
0% 0% 0% 50% 12% 26% 37% 18% 10% 7% 7% 0% 20% 40% 60% 80% 100% None Documented Results
Internally-Developed Tools Published risk categories
Process-dri
ven
taxonomies
PSAK
Risk Radar Risk Trak Risk Man Risk Probe
4.0. Risk Identification and Management Tools (
continued
)
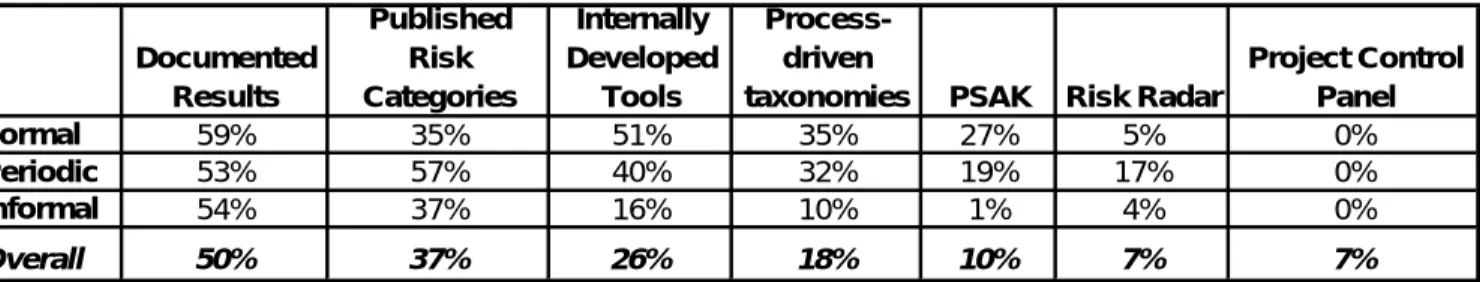
Figure 5 – Methods/Tools Used by Risk Identification Approach
Figure 5 summarizes the tool usage profile of participants who follow the Formal, Periodic, and Informal approaches. Some observations include:
Ø Documented results of past projects are the most common method of risk identification identified by participants in all categories.
Ø Organizations who follow Formal and Periodic approaches are: Ø More likely to have internally-developed tools
Ø More likely to use process-driven taxonomies in risk identification
Ø The largest proportion of participants using Risk Radar from SPMN were those following the Periodic approach.
Ø The Project Self-Assessment Kit (PSAK) from KLCI is the leading packaged tool used by participants following the Formal and Periodic approaches, used by 27% and 19% of participants in these categories, respectively.
Documented Results Published Risk Categories Internally Developed Tools Process-driven
taxonomies PSAK Risk Radar
Project Control Panel Formal 59% 35% 51% 35% 27% 5% 0% Periodic 53% 57% 40% 32% 19% 17% 0% Informal 54% 37% 16% 10% 1% 4% 0% Overall 50% 37% 26% 18% 10% 7% 7%
5.0. Risk Management Tool Preferences
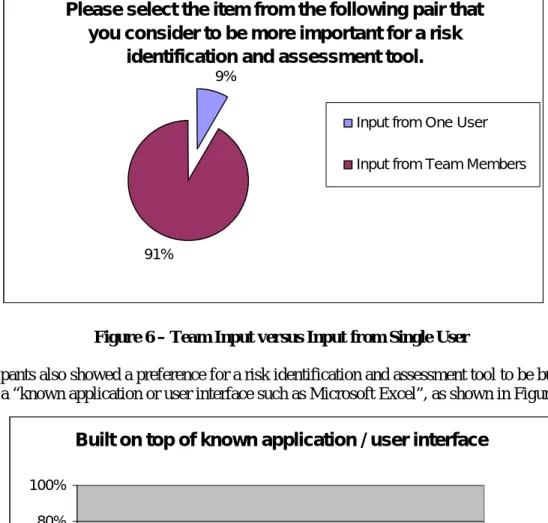
A common motivation noted for the use of the Informal approach (see Figure 3) was to better involve team members to help identify and assess risk. Figure 6 shows a clear preference among participants to include team input in risk assessment.
Figure 6 – Team Input versus Input from Single User
Participants also showed a preference for a risk identification and assessment tool to be built on top of a “known application or user interface such as Microsoft Excel”, as shown in Figure 7.
Please select the item from the following pair that
you consider to be more important for a risk
identification and assessment tool.
9%
91%
Input from One User Input from Team Members
Built on top of known application / user interface
11% 41% 30% 12% 6% 0% 20% 40% 60% 80% 100% 1 - Not Important 2 3 - Neutral 4 5 - Critically Important
6.0.
Conclusion
Study results suggest that most software organizations are undertaking activities to identify, assess, and manage risk in software projects. 97% of participants report that they currently use some procedure to identify and assess risks in their organization. Two-thirds of participants used approaches that include the following aspects:
Ø Involve project staff Ø Document risks
Ø Use repeatable procedures for identification and quantification of risk The top benefits of Risk Management reported by participants included:
Ø Anticipating and avoiding problems Ø Preventing surprises
Ø Helping meet customer commitments
The results also suggest that participants see benefits from using tools to aid risk identification and management, with 88% of participants reporting use of a tool. The most commonly used tools are documented results of past projects and published risk categories/lists. Among commercial tools, the Project Self-Assessment Kit from KLCI was used by the greatest proportion of participants.