Bagging Model with Cost Sensitive Analysis
on Diabetes Data
Abstract
Diabates patients might suffer from an unhealthy life, long-term treatment and chronic complicated diseases. The decreasing hospitalization rate is a crucial problem for health care centers. This study combines the bagging method with base classifier decision tree and cost sensitive analysis for diabetes patients’ classification purpose. Real patients’ data collected from a regional hospital in Thailand were analyzed. The relevance factors were selected and used to construct base classifier decision tree models to classify diabetes and non-diabetes patients. The bagging method was then applied to improve accuracy. Finally, asymmetric classification cost matrices were used to give more alternative models for diabetes data analysis.
Keyword: Rdiabetes, feature selection, classification, bagging, cost sensitive analysis.
1. INTRODUCTION
Diabetes symptoms occur because the body cannot use glucose properly. The body cells normally use glucose for energy under the control of the hormone insulin. For people who have diabetes, the body cannot use glucose efficiently; as a result, their blood sugar levels rise. In the long term, if not treated properly, this will result in the destruction of blood vessels and may lead to serious complications. The International Diabetes Federation (IDF) reported that over 371 million people have diabetes. However, 50% of people with diabetes are undiagnosed. In 2012, an estimated 4.8 million people died due to diabetes. They also point out that
Punnee Sittidech
*
, Nongyao Nai-arun
**
, and Ian T. Nabney
***
over 471 billion USD were spent on healthcare for diabetes [1]. The World Health Organization (WHO) also reported that diabetes is an increasing public health challenge for Thailand. One in thirteen adult Thais has diabetes. Moreover, diabetes can damage the heart, eyes, kidneys, nerves and blood vessels [2]. The Ministry of Public Health of Thailand reported that the non-communicable chronic diseases (including heart diseases, cancer and diabetes) have become the leading causes of morbidity and mortality among Thais [3]. In the past decade (2001-2010), the incidence of diabetes patients tends to continuously increase. The ratio of diabetes patient was 277.7 per 100 thousand in 2001 and 954.2 per 100 thousand in 2010. Therefore, the increasing rate of diabetes from 2001-2010 is 3.4 times within a ten year period.
Several researchers have widely applied classification models in medical data analysis and led to a substantial amount of useful researches. Classification is a technique used for discovering classes of unknown data. There are various methods for classification such as decision trees, naïve bayes, k-nearest neighbors, support vector machine, and back propagation neural network. These techniques have been applied on Diabetes Data [4, 5]. The results show that the highest accuracy is from decision tree algorithm. Decision tree supervised learning is one of the most popular classification techniques because it is easy to understand and interpret by end users [6, 7]. In high dimensional and large quantities of raw data, feature selection can help improve classification performance with minimal effort [8]. The basic idea of the algorithms is to search through all possible combinations of features in the data to find the subset of
features that works best for prediction. The selection is done by reducing the number of features of the feature vectors, keeping the most meaningful discriminating ones, and removing the irrelevant or redundant ones [9, 10, 11]. Huang et al. [12] used feature selection and classification model construction on type 2 diabetic patients’ data. The results revealed that feature selection via supervised model construction was used to rank the attributes affecting diabetes. In their experiment, naïve bayes processes the data fastest but decision tree is the most stable classifier.
To improve the accuracy of a single classifier, the ensemble methods such as bagging and boosting can be applied by combining the results of induced classifiers with different training subset. This methodology can be done easily parallelized. These independent methods aim either at improving the predictive power of classifiers or decreasing the total execution time [13]. In bagging method, each base classifier is trained on a sample subset taken with a replacement from the training set. Then, some kind of voting is used to combine all base classified outputs. Liang and Zhang [14] investigated the performance of the bagging method. The results showed that bagging performs well on most datasets, except extremely imbalanced and large datasets. Nai-arun and Sittidech [3] proposed ensemble learning model for diabetes classification by comparing bagging and boosting methods. It is found that the accuracy of bagging with decision tree is better.
Nevertheless, in some application domains, accuracy is less important than misclassification. Asymmetric classification cost has to be considered. Ghosh and Hasley [15] used asymmetric classification cost matrices in predicting diabetes with cost matrix learning methods by changing the classification probability value on the classification cost matrix and rebalancing the training set to introduce more negative cases. The results show comparable values of both predictive accuracy and expected classification cost. Kukar and Kononenko [16] presented methods for cost-sensitive learning and their experimental results show
successfully minimized misclassification costs.
In this paper, real diabetes patients’ data set was analyzed using data mining techniques including feature selection for diabetes patients’ classification purpose. The relevance factors were used to construct a decision tree model to classify diabetic and non-diabetic patients. Moreover, bagging method was applied to improve accuracy. Finally, asymmetric classification cost matrices were used to give more alternative models for diabetes data analysis. The remainder of this paper is organized as follows. Overviews of feature selection methods are introduced. Bagging method using base classifier decision tree classification with cost sensitive analysis is briefly described. Then, the experimental studies are presented and discussed. Finally, conclusions are drawn and further work is indicated.
2. METHODOLOGY
2.1 Feature Selection Algorithms
Feature selection is one of the most essential and important preprocessing steps in pattern classification. It is to find a minimum set of attributes such that the resulting probability distribution of the data classes is as close as possible to the original distribution obtained using all attributes. Modeling on a reduced set of attributes has an additional benefit. It reduces the number of attributes appearing in the discovered patterns, helping to build the classification model easier [17, 18, 19]. It is also an effective dimensionality reduction technique in order to remove noise features. Therefore, it can reduce the cost of the classification [20]. This is normally achieved by combining attribute subset evaluators with a search method [7]. Feature selection, when used along with any learning model, can help improve model performance with minimal effort. Hence, by selecting useful features from the data set, we essentially reduce the number of features or attributes needed for the classification problem of interest.
There are many feature selection algorithms and also several approaches to evaluate the goodness of a feature
subset. In this research experiment, three easy and popular feature selection techniques were applied to the data set as explained in the following sections.
2.1.1 Correlation Feature Selection
Correlation Feature Selection (CFS) evaluates the value of a subset of attributes by considering the individual predictive ability of each feature based on the degree of redundancy between them. It uses a search algorithm along with a function to evaluate the merits of feature subsets. Subsets of features that are highly correlated with the predicting class, while having low inter-correlation, are preferred. Hence, the heuristics by which CFS measures the goodness of feature subsets takes into account the usefulness of individual features for predicting the class label, along with the level of inter correlation among them [21, 22].
2.1.2 Information Gain Feature Selection
Information Gain Feature Selection (IGFS) evaluates attributes by measuring their information gain with respect to the predicting class [4]. It is used to select the test attribute at each node of the decision tree classification. A decision tree is a simple structure where non-terminal nodes represent tests on one or more attributes and terminal nodes reflect decision outcomes. To select a feature among all others, information gain of each attribute is computed. Then, expected information needed to classify a tuple in the data set is selected.
2.1.3 Gain Ratio Feature Selection
Gain Ratio Feature Selection (GRFS) has a similar methodology as Information Gain Feature Selection. The information gain measure prefers to select attributes that have a large number of values. GRFS solves the drawback of information gain applied to attributes that can take on a large number of distinct values. It is a modification of the information gain that reduces its bias by taking the number and size of branches into account when choosing the significant attributes [23]. Therefore, it is the ratio between the information gain and the intrinsic value. The attribute with the highest gain ratio is selected as the splitting attribute [4].
2.2 Decision Tree Model
Classification is an important task in data mining that involves decision or forecast in an unknown or a feature situation. It is the process of modeling different data classes or estimating target values to predict the class of objects or the expected value of unknown attribute [24, 25]. Among several classification algorithms, decision tree learning is one of the most popular methods. A model based tree was proposed by Quinlan [26]. Decision Tree is a supervised learning technique that uses the data which the answers have already known and used for building the tree [27]. Its quality is highly associated with the classification accuracy reached on the training data set, as well as the size of the tree [28] Decision tree algorithms are two-phase processes [4]; (1) Building phase and (2) Pruning phase. More details of these two steps follow.
2.2.1 Building Phase
Decision tree structures are built or constructed in top-down recursive divide-and-conquer strategy manner. Its structure includes nodes and branches modeling from the training data. The algorithm will find the most powerful feature that will be used to separate training data into two or more subsets based on the values of that feature. The first node is called the root node. Each data subset then continues separated until a termination criterion is satisfied [4, 5]. The resulting decision tree consists of four primary features which are (1) Root node: an attribute selected as the base to build the tree upon, (2) Internal node: attributes that resides on the inner part of the tree, (3) Branches descending from a node: possible values for the attribute the branch initiates, and (4) Leaf nodes: the predefined classes. The training data set is recursively expanded by greedily selecting the best attribute for splitting the data that has arrived in the current node. The data set is partitioned until all the instances in a partition belong to the same class or stop growing the tree early if the goodness measure is less than a threshold.
2.2.2 Pruning Phase
2.4 Cost Sensitive Analysis
Accuracy is a popular evaluation performance of a classifier. However, in many medical applications which are an imbalanced class distribution problem and unequal costs of the misclassification errors in different classes are very crucial. Hence, accuracy might not be an only measurement to be considered in the performance of medical data sets [31]. Varying costs associated with misclassification is important for practical applications. Reweighting training instances according to the total cost assigned to each class with minimum expected misclassification. Performance can often be improved by using bagging method to improve the probability estimates of the base classifier [32, 33].
In cost-sensitive learning, the costs of true positive (TP), false positive (FP), false negative (FN) and true negative (TN) can be given in a cost matrix [34]. A cost matrix usually has the structure when there are two classes, as shown in Table 1. The annotation C(x,y) to represent the misclassification cost of classifying an instance from its actual class y into the predicted class x (positive is 1 and negative is 0). The cost of TP and TN are always diagnosed as important when an instance is predicted correctly. FP and FN are diagnosed as misclassify and, in some cases, it is worth to take account in adjusting the classification model to reduce FP and FN misclassification [12, 31].
3. EXPERIMENTS AND RESULTS
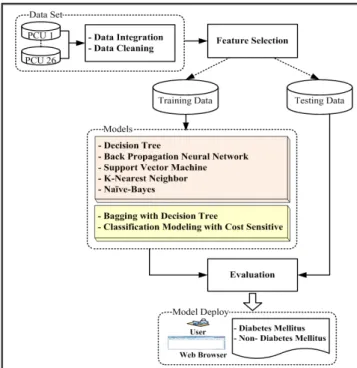
The process of our experiments is shown in Figure 1. The following section describes the data set, the experimental settings and their results.
reflect anomalies in the training data due to noise or outlier. Tree pruning methods address this problem of over-fitting the data. Such methods typically uses statistical measures to remove the least reliable branches, generally resulting in faster classification and more generality, which is an improvement in the ability of the tree to correctly classify independent data set. There are two common pruning strategies; (1) Pre-pruning approach; a tree is pruned by halting its construction early. Upon halting, the node becomes a leaf. The leaf may hold the most frequent class among the others and (2) Post-pruning approach; a tree node is pruned by removing its branches from a fully grown tree. The pruned node becomes a leaf and is labeled by the most frequent class among its former branches. The process is recursively pruned back specific branches of the large tree in order to avoid over-fitting and make the tree model more generality.
2.3 Bagging
Bagging (bootstrap aggregating) is a well-known ensemble method introduced by Leo Breiman to reduce the variance of a predictor [11]. It aims to increase accuracy by generating multiple versions of a classifier and using these to get an aggregated classification. A training set which is generated by a random draw with the replacement of examples. Each of these data sets is used to train with the base classifiers. The outputs of the models are combined to create a single output. Mostly the aggregated classification come from the classified results that is the most often (voting method) in case of categorical data. The aggregation averages over the versions in case of numerical data. Bagging usually produces a combined model that often performs better than the single model built from the original single data [11, 29]. It has been applied by many researchers. Machová, et.al. [30] explored the bagging method on binary decision trees, which enable an improvement of the classification performance. Ling and Sheng [31] investigated the performance of bagging in terms of learning from imbalanced medical data. Their experiment indicated that bagging outperforms when using the base classifier decision tree.
Actual Class
Predicted Class
Class 1 Class 2
Class 1 C(1,1) or TP C(1,0) or FN
Class 2 C(0,1) or FP C(0,0) or TN
feature selection (IGFS), and (3) Info Gain feature selection (GRFS), combined with ranker method. The results displayed in Table 3 show a comparison of the ranked attributes of all the original 15 attributes. From the results, only first 11 ranked attributes can be used as the input attributes to model decision tree and the accuracy is increased from 93.90% to 93.98%.
3.1 Data Set
In this study, a data set was collected from Sawanpra charak regional hospital, Thailand, which consists of 26 primary care units (26 PCU) during 2011-2013 (24 months). The data were cleaned by outlier elimination, inconsistent data transformation, and incomplete data imputation. Then, these data were integrated. The final data set consists of 48,763 instances, diabetes (20,743 instances) and non-diabetes (28,020 instances) and there are 15 input attributes as shown in Table 2.
3.2 Feature Selection
The original data set, which consists of 15 input attributes, was analyzed using simple decision tree algorithm. The classification performance is 93.90% accurate. It is quite a good result at this beginning stage. However, sometimes, input attributes may be irrelevant features; defined as those features not having any influence on the output classes. Therefore, we further analyzed the data set using feature selection algorithms to remove some irrelevant predictors from these 15 attributes.
The three feature selection algorithms used in this paper were: (1) Correlation feature selection (CFS), (2) Gain Ratio
No Attributes Description Values
1 SEX Sex 1: Male 2: Female 2 MSTATUS Status 1: Single, 2: Married 3 EDUCATE Education 1: No degree 2: Have degree
4 BGROUP Blood group 1: Group A 2: Group B3: Group AB 4: Group O 5 SMOKE Smoke 1: No smoke 2: Smoke 6 ALCOHOL Drink Alcohol 1: No drink 2: Drink 7 DMFAMILY Diabetes Mellitus History Family 1: Yes 2: No
8 HTFAMILY Hypertension History
Family 1: Yes 2: No 9 AGE Age (Year) Mean(49.44), S.D.(18.43),
Min/Max (16/109) 10 BMI Body Mass Index (kg/m2) Mean(26.51), S.D.(6.05), Min/Max (15/59)
11 WEIGHT Weight (kg) Mean(68.00), S.D.(16.10), Min/Max (36/160) 12 HEIGHT Height (cm) Mean(160.12), S.D.(7.79),
Min/Max (130/190) 13 WAIST_CM Waist Circumference
(cm)
Mean(90.83), S.D.(14.72), Min/Max (50/183) 14 BPH Systolic Blood Pressure
(mmHg) Mean(119.86), S.D.(15.28), Min/Max (70/198) 15 BPL Diastolic Blood Pressure (mmHg) Mean(76.03), S.D.(10.35), Min/Max (41/149)
Table 2. Attributes Description
3.3 Bagging with Decision Tree Base Classifier
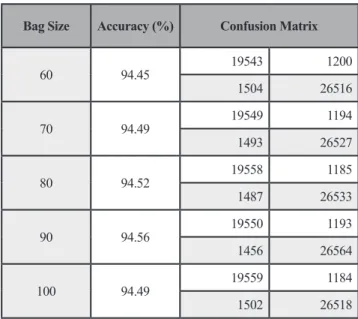
The data set consisted of 48,763 instances of two classes; diabetes (20,743 instances) and non-diabetes (28,020 instances) and only 11 first ranked input attributes were used to implement the bagging with decision tree base classifier model. Cross-validation (10-fold) was performed on each modeling in order to avoid the over-fitting problem and obtain more reliable experimental results. Pre-pruning approach was applied by setting the confidence factor and minimum number of instances in the leaf nodes. Each classifier is trained on a sample of instances taken with a replacement from the training set. In this experiment, we also test various bag sizes from 60% to 100% of the original training set. The accuracy (94.56%) when using 90% bag size was the best among others as shown in Table 4. Then, bagging models were tested in various number of iteration until the model was stable at 70 iterations with the accuracy of 94.74% as
Attribute
Ranking CFS IGFS GRFS
1 WAIST_CM WAIST_CM WAIST_CM
2 BMI BMI BMI
3 WEIGHT WEIGHT WEIGHT
4 AGE AGE DMFAMILY
5 DMFAMILY DMFAMILY AGE
6 HTFAMILY BPH HTFAMILY
7 BPH HTFAMILY ALCOHOL
8 EDUCATE BPL EDUCATE
9 ALCOHOL EDUCATE BPH
10 SMOKE ALCOHOL SMOKE
11 BPL SMOKE BPL
12 MSTATUS HEIGHT HEIGHT
13 BGROUP MSTATUS MSTATUS
14 SEX BGROUP BGROUP
15 HEIGHT SEX SEX
Table 3. Feature Selection Results shown in Table 5.
3.4 Classification Modeling with Cost Sensitive Analysis
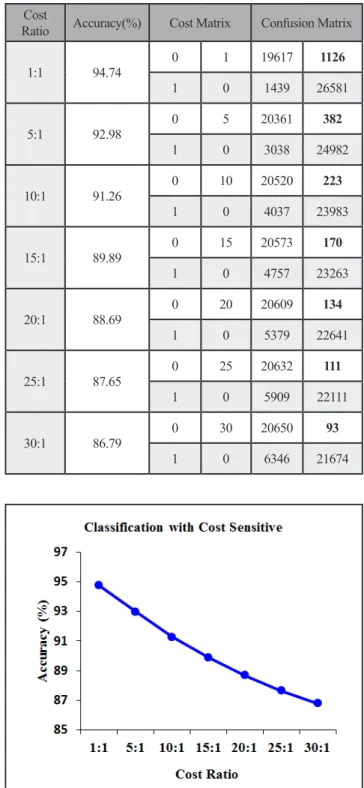
Even though the accuracy is more than 90%, we considered in focusing of misclassification cost. The wrong prediction cases are still important criteria expected in medical diagnostics situation. Since in the case of diabetes, the cost of false negatives is higher than false positive, as the disease can progress very rapidly when the patient was left untreated [15]. If the diabetes patients are diagnosed as non-diabetes patients, they will be untreated for years resulting being bad health and may lose their lives. It is much more serious than the non-diabetes patients are diagnosed as diabetes patients. Therefore, asymmetric classification cost was considered in this paper. The corrected prediction cases are fine. However, the patient who could delay in the correct treatment must have some cost penalty. The cost matrix given with this experiment is as in Table 6. The asymmetric classification costs ratio of FN over those of FP at 5:1, 10:1, 15:1, 20:1, 25:1, and 30:1. The evaluation of classification models used these cost ratios including 1:1 ratio (symmetric cost) presented in Table 7. Figure 2 demonstrates that classification model accuracy decreases when asymmetric cost ratio of FN:FP increases. These can be alternative choices based on certain situations. However, an appropriate cost sensitive ratio depends on discretion of doctors.
Bag Size Accuracy (%) Confusion Matrix
60 94.45 19543 1200 1504 26516 70 94.49 19549 1194 1493 26527 80 94.52 19558 1185 1487 26533 90 94.56 19550 1193 1456 26564 100 94.49 19559 1184 1502 26518
Many relevant methods and concepts could be added for increasing in medical informatics and for improving the decision making. Visualization tools can help extract some hidden information from high dimensional and large data sets. Repeating the experiments on different datasets with varying settings is also suggested as future work.
Cost
Ratio Accuracy(%) Cost Matrix Confusion Matrix
1:1 94.74 0 1 19617 1126 1 0 1439 26581 5:1 92.98 0 5 20361 382 1 0 3038 24982 10:1 91.26 0 10 20520 223 1 0 4037 23983 15:1 89.89 0 15 20573 170 1 0 4757 23263 20:1 88.69 0 20 20609 134 1 0 5379 22641 25:1 87.65 0 25 20632 111 1 0 5909 22111 30:1 86.79 0 30 20650 93 1 0 6346 21674
4. CONCLUSION AND FUTURE WORK
In this paper, we introduced some feature selection algorithms to take into account for selecting relevance factors on the sample data. Among various classification techniques, decision tree model gave the highest accuracy. Then, bagging method was used to get aggregated results from decision tree base classifier to improve classification accuracy. Alternative models using asymmetric classification cost ratios were presented when misclassification problem addresses more serious than accuracy value. The models are helpful for doctors to diagnose patient hospitalization probability and to suggest some possible treatments to help improve health care quality.
Iterations Accuracy (%) Confusion Matrix
10 94.56 19550 1193 1456 26564 20 94.68 19591 1152 1442 26578 30 94.54 19561 1182 1477 26543 40 94.57 19565 1178 1469 26551 50 94.69 19611 1132 1453 26567 60 94.71 19610 1133 1445 26575 70 94.74 19617 1126 1439 26581 80 94.64 19587 1156 1454 26566
Table 5. Iteration of Bagging Training
Actual Class Predicted Class
Diabetes Non-diabetes Diabetes 0 FN = 1, 5, 10, 15, 20, 25, 30
Non-diabetes FP = 1 0
Table 6. Diabetes Cost Sensitive Matrix
Table 7. Classification with Cost Sensitive
[10] H. C. Yang and C. H. Lee. “A Text Mining Approach on Automatic Generation of Web Directories and Hierarchies.” In Proceedings of the IEEE/WIC International Conference on Web Intelligence, 2003. [11] Y. Yimingand and O. P. Jan. “Comparative Study of
feature selection in Text Categorization.” In Proceedings of Fourteenth International Conference on Machine Learning, pp. 412-420, 1997.
[12] Y. Huang, P. McCullagh, N. Black and R. Harper. “Feature Selection and Classification Model Construction on type 2 Diabetic Patients’ data.”
Artificial Intelligence in Medicine, pp. 251-262, 2007.
[13] L. Breiman. Bagging Predictors. Machine Learning,
pp. 123-140, 1996.
[14] G. Liang and C. Zhang. “Empirical Study of Bagging Predictors on Medical Data.” In 9th Australasian Data
Mining Conference, Vol. 121, pp. 31-40, 2011. [15] B. Ghosh and J. Hasley. “Using Asymmetric
Classification Cost Matrices in Predicting Diabetes.”
In International Conferences on Decision Support Systems (ICDSS), 2007.
[16] M. Kukar and I. Kononenko. “Cost-Sensitive Learning with Neural Networks.” In 13th European Conference
on Artificial Intelligence, pp. 445-449, 1998.
[17] S. Chakrabarti, E. Cox, E. Frank, R. H. Guting, J. Han, X. Jiang, M. Kamber, S. Lightstone, S. Nadeau, T. P. Neapolitan, R. E. Pyle, D. Refaat, M. Schneider, T. J. Teorey and I. H. Witten. Data Mining: Know It All, Morgan Kaufmann Publishers, USA, 2008.
[18] A. G. K. Janecek, W. N. Gansterer, M. A. Demel and G. F. Ecker. “On the Relationship Between Feature Selection and Classification Accuracy.” JMLR Workshop and Conference, Vol. 4, pp. 90-105, 2008.
[19] L. Ladha and T. Deepa. “Feature Selection Methods and Algorithms.” Computer Science and Engineering (IJCSE), Vol. 3, No. 5, pp. 1787-1797, 2011.
[20] B. Krishnapuram et al. “A Bayesian Approach to Joint Feature Selection and Classifier Design.” IEEE
5. ACKNOWLEDGMENT
We are grateful to Sawanpracharak Regional Hospital for granting useful data sets and to the Hospital staff for their professional discussions. We also thank the Faculty of Science, Naresuan University, Thailand for the oversea research funding.
6. REFERENCES
[1] International Diabetes Federation. Retrieved March 12, 2013, Available online at http://www.idf.org/ diabetesatlas/5e/the-global-burden 2013.
[2] World Health Organization. Retrieved January 25, 2013, Available online at http://www.who.int/features/2012/ story_diabetes_ thailand/en/ 2013.
[3] Ministry of Public Health. Annual Report 2011, Bureau of Policy and strategy, Ministry of Public Health, Nonthaburi, Thailand, 2011.
[4] N. Nai-arun and P. Sittidech. Ensemble Learning Model for Diabetes Classification. Advanced Materials Research, (931-932), pp. 1427-1431, 2014.
[5] N. Nai-arun. “An Application of Data Mining Techniques for Diabetes Mellitus Prediction : Case study in Sawanpracharak Regional Hospital.” Thesis in Computer Science, Naresuan University, Thailand, 2014.
[6] J. Han, M. Kamber and J. Pei. Data Mining: Concepts and Techniques, 3rd ed. Morgan Kaufman Publishers. USA, pp. 327-329, 2012.
[7] P-N. Tan, M. Steinbach and V. Kumar. Introduction to Data Mining. Addison Wesley, 2006.
[8] R. A. Caruana and D. Freitag. “How Useful is Relevance? Technical report.” in Fall’94 AAAI Symposium on Relevance, New Orleans, 1994. [9] K. Selvakuberanet, M. Indradevi and R. Rajaram.
“Combined Feature Selection and classification: A novel approach for the categorization of web pages.”
Journal of Information and Computing Science, Vol. 3, No. 2, pp. 083-089, England, UK, 2008.
Transactions on Pattern Analysis and Machine Intelligence, Vol. 26, No. 9, pp. 1105-1111, 2004. [21] M. A. Hall. “Correlation-based Feature Selection for
Machine Learning.” In thesis for the degree of Doctor of Philosophy at The University of Waikato, 1990. [22] M. A. Hall and L. A. Smith LA. “Practical feature
subset selection for machine learning.” In C. McDonald (Ed.), Computer Science’ 98 Proceedings of the 21st
Australasian Computer Science Conference ACSC’98, Berlin: Springer, Perth, 4-6 February, pp. 181-191, 1998. [23] G. K. Asha, A. S. Manjunath and M. A. Jayaram.
“Comparative Study Of Attribute Selection Using Gain Ratio And Correlation Based Feature Selection.”
International Journal of Information Technology and Knowledge Management, Vol. 2, No. 2, pp. 271-277, 2010. [24] T. Thanaruk. Introduction to Concept and Techniques
in Data Mining and Application to Text Mining, M&M Laser Print Part., LTD. 1st ec. Thailand, 2011.
[25] C. S. Sang. Practical Applications of Data Mining,
Jones & Bartlett Publishers, America, 2012.
[26] J. R. Quinlan. Induction of Decision Tree. Reading in Machining Learning, 1986.
[27] J. Michael et al. Data Mining Techniques: For Marketing, Sales, and Customer Relationship Management. 2nd ed. Wiley, 2004.
[28] A. L. Symeonidis and P. A. Mitkas. Agent Intelligence Through Data mining. Springer Science and Business Media, USA, 2005.
[29] I. H. Witten and E. Frank. Data Mining: Practical Machine Learning Tools and Techniques, 2nd ed,
Morgan Kaufmann Publishers, USA, 2005.
[30] K. Machová, F. Barčák and P. Bednár. “A Bagging Method using Decision Trees in the Role of Base Classifiers.” In Acta Polytechnical Hungarica, Vol. 3, No. 2, 2006.
[31] C. X. Ling and V. S. Sheng. “Cost-Sensitive Learning and the Class Imbalance Proble.” Encyclopedia of Machine Learning, C.Sammut (Ed.), Springer, Canada, 2008.
[32] N. Abe, B. Zadrozny and J. Langford. “An Iterative Method for Multi-class Cost-sensitive Learning.”
KDD’04, pp. 22-25, USA, 2004.
[33] M. Hall, E. Frank, G. Holmes, B. Pfahringer, P. Reutemann and I. H. Witten. The WEKA Data Mining Software: An Update; SIGKDD Explorations,
Vol. 11, Issue 1, 2009.
[34] C. ElKan. “The Foundations of Cost-Sensitive Learning.” In Proceedings of the 17th International Joint
Conference on Artificial Intelligence, Vol. 2, pp. 973-978, 2001.