eupa open proteomics 3 (2014)183–194
Available
online
at
www.sciencedirect.com
ScienceDirect
j o u r n a l ho me p ag e :h t t p : / / w w w . e l s e v i e r . c o m / l o c a t e / e u p r o t
Proteomic
and
meta-transcriptomic
study
on
lymph
node
metastasis
in
gastric
cancer
Hiroshi
Ichikawa
a,b,
Tatsuo
Kanda
c,
Shin-ichi
Kosugi
b,
Yasuyuki
Kawachi
d,
Toshifumi
Wakai
b,
Tadashi
Kondo
a,∗aDivisionofPharmacoproteomics,NationalCancerCenterResearchInstitute,5-1-1Tsukiji,Chuo-ku,Tokyo
104-0045,Japan
bDivisionofDigestiveandGeneralSurgery,NiigataUniversityGraduateSchoolofMedicalandDentalSciences,
1-757,Asahimachidori,Chuo-ku,Niigata-shi,Niigata951-8510,Japan
cTsubameRosaiHospital,633,Sado,Tsubame-shi,Niigata959-1228,Japan
dNagaokaChuoGeneralHospital,2041,Kawasakimachi,Nagaoka-shi,Niigata940-8653,Japan
a
r
t
i
c
l
e
i
n
f
o
Articlehistory:
Received28November2013 Receivedinrevisedform 21February2014 Accepted10March2014 Availableonline15March2014
Keywords:
Gastriccancer
Lymphnodemetastasis Label-freeproteomics Beta-3integrin Transcriptome
a
b
s
t
r
a
c
t
Toexaminetheproteomicbackgroundoflymphnodemetastasis(LNM)ingastriccancer, weperformedproteinexpressionprofilingofpairednon-tumor,primarytumor,andLNM tissues.Usingalabel-freeproteomicapproach,wegeneratedproteinexpressionprofilesof 3894uniqueproteinsandidentified109differentiallyexpressedproteins.Functional path-wayanalysisofthedifferentiallyexpressedproteinsshowedthatmembersofthebeta-3 integrin(ITGB3)pathwayweresignificantlyenriched.AberrationsofITGB3werereported invariousmalignancies;however,ITGB3inLNMtissueshasnotbeenexaminedtodate. DifferentlevelofITGB3expressionwasconfirmedin20gastriccancercasesbyWestern blotting.WeanalyzedthemRNAlevelsofthedifferentiallyexpressedproteinsbyusinga publicmRNAexpressiondatabase;38.8%oftheproteinsexamined,includingthoseinvolved inoxidationandreduction,showedcorrelationbetweenproteinandmRNAlevels.Proteins withoutsuchcorrelationincludedfactorsrelatedtocelladhesion.Ourstudysuggestsanovel rolefortheintegrinpathwayinthedevelopmentofLNMingastriccancerandindicated possiblebenefitsofobservationaltranscriptomicanalysisforproteomicstudies.
©2014PublishedbyElsevierB.V.onbehalfofEuropeanProteomicsAssociation(EuPA). ThisisanopenaccessarticleundertheCCBY-NC-NDlicense (http://creativecommons.org/licenses/by-nc-nd/3.0/).
1.
Introduction
Gastriccancer isthe fourth mostcommon cancerand the second leading cause of cancer-related deaths worldwide [1]. Lymph node metastasis (LNM) is an early event of
∗ Correspondingauthorat:DivisionofPharmacoproteomics,NationalCancerCenterResearchInstitute,5-1-1Tsukiji,Chuo-ku,Tokyo 104-0045,Japan.Tel.:+81335422511x3004;fax:+8135475298.
E-mailaddress:takondo@ncc.go.jp(T.Kondo).
the metastatic process andis mostcommonlyobservedin metastaticgastriccancer[2,3].TheLNMstatusisoneofthe most important prognostic factors for gastric cancer, and the 5-year survival rate for LNM-positive gastric cancer is 33.2%[4,5].Theseobservationssuggestthatthe understand-ingofthemolecularmechanismsofLNMcanleadtoanovel
http://dx.doi.org/10.1016/j.euprot.2014.03.001
2212-9685/©2014PublishedbyElsevierB.V.onbehalfofEuropeanProteomicsAssociation(EuPA).Thisisanopenaccessarticleunderthe CCBY-NC-NDlicense(http://creativecommons.org/licenses/by-nc-nd/3.0/).
prognosticindicatorortherapeuticapproachforthetreatment ofgastriccancer.
Metastasis of tumorcells consistsof multiple selection steps. Subpopulationsof cancercells withhigh metastatic potentialmaymigratefromtheprimarysitetodistanttissues, wherecells adaptivetoforeignmicroenvironmentsclonally proliferateinmetastaticsites[6].Toelucidatethemolecular mechanisms underlying these multistage events, genome-wide screening has been performed to identify genetic differences between the primarytumors and the LNM tis-suesingastriccancer[7,8].Thesestudieshavesuggestedthe existenceofcomplexgeneticabnormalitiesrelatedtogastric cancermetastasis.
Theproteomeisafunctionaltranslation ofthegenome. Thegenomic aberrations ofcancercells are transcribed to the transcriptome, translated tothe proteome, then deter-mining cancer phenotypes. In this sense, the proteome is a functional translation ofthe genome, directly regulating tumorbehavior.Proteomicstudiescangenerateuniquedata about the final productsof genome information. The pro-teomicstudyhasbeenemployedtoelucidatethemechanisms underlying LNM development in several types of cancers, andvariousintriguingfindingshavebeenreported[9]. There-fore, the investigations by the proteomic approach will be importantclues tounderstand the molecular mechanisms underlyingLNMingastriccancer.Theseapproacheswill fur-thertheunderstanding ofbiologicalmechanismsingastric cancerprogressionandwilleventuallybenefitcancerpatients. Inthisstudy,weaimedtoelucidatetheproteomic back-groundofLNMingastriccancer.Proteinexpressionprofiles consisting of 3894 unique proteins were generated using sodium dodecyl sulfate (SDS)-PAGE-based protein separa-tionfollowedbyLC–MS/MS.Usingalabel-freequantification method,weidentified109differentiallyexpressedproteinsin theLNMtissues.Functionalpathwayanalysisdemonstrated thatproteinsinvolvedinthebeta-3integrin(ITGB3)pathway weresignificantlyenrichedwithinLNM,andtheexpression patternofITGB3ingastriccancerprogressionandmetastasis wasexaminedbyWesternblotting.Theapplicationof meta-transcriptomicsrevealedthepossibletrendsofproteinswith concordantanddiscordantexpressionbetweenproteinsand mRNA.
2.
Material
and
methods
2.1. Clinicalsamples
Thisstudyincluded20patientswithgastriccancer.Matched and unmatched pairs of tumors, non-tumor and LNM tis-sueswereused;pairedtissuesfromtwocaseswereusedfor proteomicstudies, and all sampleswere usedfor Western blotting.ThepatientsunderwentsurgeryatNiigata Univer-sityMedicalandDentalHospitalandtheaffiliatedinstitutions inNiigataprefecture(NagaokaChuoGeneralHospital, Nan-bugoGeneralHospital,NagaokaRedCrossHospital,Nippon DentalUniversityMedicalHospital,NiigataCityGeneral Hos-pital,TachikawaGeneralHospital,ShibataHospital,Saiseikai NiigataDainiHospital,SakamachiHospital,Kashiwazaki Gen-eral Hospital and Medical Center). All patients underwent
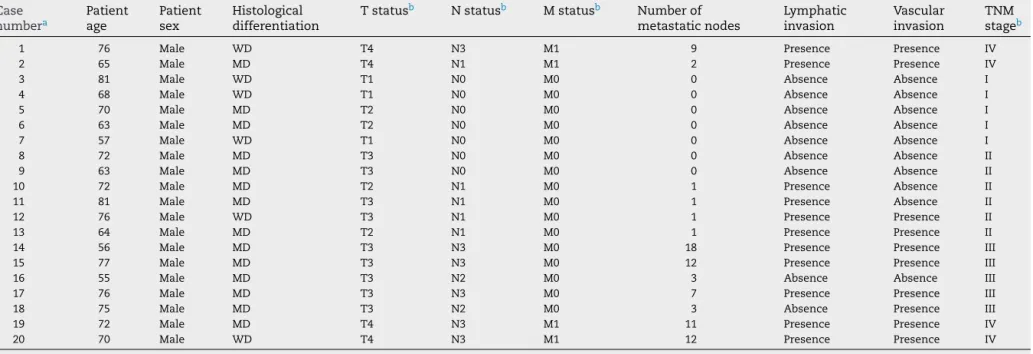
surgicalresectionin2010andhadnohistoryofcancer treat-ments involving systemic therapy. At the time of surgery, tissue fragments were grossly resected from the primary tumors,andthematchednon-tumormucosatissueslocated atleast5cmawayfrom thetumormargins werecollected. Allthetissueswereimmediatelysnap-frozeninliquid nitro-gen and storedat −80◦C untiluse. TheLNM tissues were cutinto twopieces; onewasembeddedinOCT compound (Sakura Finetechnical, Tokyo, Japan) for histological iden-tification of tumor metastasis, and another was used for proteomicstudyandWesternblotting.Bystainingfrozen sec-tionswithhematoxylin–eosin,weconfirmedthatthelymph node metastatic tissueshad at least50% tumorcells.The tumorswereclassifiedonthebasisofthehistologicalstage, accordingtotheInternationalUnionagainstCancer tumor-node-metastasis (TNM) classification, 7th edition [10]. The clinicopathologicaldatafor20casesarepresentedinTable1. ThisstudywasapprovedbytheEthicalReviewBoardofthe NiigataUniversityFacultyofMedicine,theaffiliated institu-tionsofNiigataUniversityMedicalandDentalHospital,and NationalCancerCenter.Informedconsentwasobtainedfrom allthepatientsateachinstitution.
2.2. Proteinexpressionprofiling
Frozensampleswere crushed topowder inliquidnitrogen witha Multi-beadsshocker(YasuiKikai,Osaka, Japan)and treated withlysis buffercontaining 6M urea,2M thiourea, 3% CHAPS, and 1% Triton X-100. After the mixtures were centrifugedat15,000rpmfor30min,thesupernatantswere recoveredandusedinsubsequentproteinexpressionstudies. Protein expression profiles were generated by the LC–MS/MSmethod.Sixtymicrogramsofeachproteinsample wasseparatedonaready-made12.5%SDS-PAGEgel(ATTO, Tokyo,Japan).Eachgellaneswerecutinto48piecesofequal size by GridCutter (Gel Company, San Francisco, CA) and subjectedtoin-geltrypticdigestionasdescribedpreviously [11].Trypsindigestsweresubjectedtoliquidchromatography coupledwithanalysiswithaLTQ-OrbitrapXLmass spectrom-eter(ThermoFisherScientific,SanJose,CA).AcquiredMSand MS/MS spectra (Thermoraw files) were analyzed with the ProgenesisLC-MSsoftware,version3.4(Nonlinear,Dynamics, Newcastle, UK).Profile dataofMS scanswere transformed to peak lists with respective peak m/z values, intensities, abundances(areasunderthepeaks),andm/zwidth.MS/MS spectraweretreatedsimilarly.
After selecting one sample as the reference, the reten-tion timesofall theothersamplesusedintheexperiment were alignedbymanuallycreatingthreetofivelandmarks, followedbyautomaticalignmentofallretentiontimesto max-imaloverlayofthe2Dfeaturemaps.Featureswithonlytwo or threecharges wereincluded infurtheranalyses.MS/MS spectrawereexportedfromtheProgenesissoftwareas Mas-cotgenericfiles(mgf)andwereusedforpeptideidentification bysearchingtheSWISS-PROTdatabase(Homosapiens,471,472 sequencesintheSprot57.5.fastafile)byusingtheMascot soft-ware(version2.2;MatrixScience,London,UK).Thefollowing searchparameterswereused:toleranceoftwomissedtrypsin cleavages,variablemodificationsonthemethionineresidue (oxidation,+16Da),maximumprecursorionmasstolerance
e u p a o p e n p r o t e o m i c s 3 ( 2 0 1 4 ) 183–194
185
Table1–Clinicalandpathologicaldataofthegastriccancerpatientswhoparticipatedinthisstudy. Case numbera Patient age Patient sex Histological differentiation
Tstatusb Nstatusb Mstatusb Numberof
metastaticnodes Lymphatic invasion Vascular invasion TNM stageb
1 76 Male WD T4 N3 M1 9 Presence Presence IV
2 65 Male MD T4 N1 M1 2 Presence Presence IV
3 81 Male WD T1 N0 M0 0 Absence Absence I
4 68 Male WD T1 N0 M0 0 Absence Absence I
5 70 Male MD T2 N0 M0 0 Absence Absence I
6 63 Male MD T2 N0 M0 0 Absence Absence I
7 57 Male WD T1 N0 M0 0 Absence Absence I
8 72 Male MD T3 N0 M0 0 Absence Absence II
9 63 Male MD T3 N0 M0 0 Absence Absence II
10 72 Male MD T2 N1 M0 1 Presence Absence II
11 81 Male MD T3 N1 M0 1 Presence Absence II
12 76 Male WD T3 N1 M0 1 Presence Presence II
13 64 Male MD T2 N1 M0 1 Presence Presence II
14 56 Male MD T3 N3 M0 18 Presence Presence III
15 77 Male MD T3 N3 M0 12 Presence Presence III
16 55 Male MD T3 N2 M0 3 Absence Absence III
17 76 Male MD T3 N3 M0 7 Presence Presence III
18 75 Male MD T3 N2 M0 3 Absence Presence III
19 72 Male MD T4 N3 M1 11 Presence Presence IV
20 70 Male WD T4 N3 M1 12 Presence Presence IV
WD,welldifferentiated;MD,moderatelydifferentiated.
a Thesamplesincase1and2wereusedtocreatetheproteinexpressionprofiles,andthoseincase1to20wereusedforWesternblottinganalysis.
of±10ppm,andfragmentionmasstoleranceof±0.8Da. Pro-teinswithaMascotscoreof34ormorewereconsideredas positivelyidentified.Peptidesearchresultswerere-imported totheProgenesissoftware.
For protein quantification, only nonconflicting peptides (i.e.,peptides occurringinonlyoneprotein) were selected. Aftersumminguptheabundancesofallthepeptidesallocated toeachprotein,theresultsof48fractionswerecombinedin atotalanalysisset.Allthe experimentswere performedin duplicates,andeachnumberrepresentedanaverageoftwo replicates. Theprocessed rawdata on protein abundances werenormalizedbyfixingthemeanintensityofeach sam-pleatoneandwerepresentedasascatterplot;theratiosof meanabundancesintwocasesbetweentissuetypeswere cal-culatedusingtheExpressionistanalystsoftware(GeneData, Basel,Switzerland). Wedefinedthe different expressionas morethan2.0-folddifferenceofthemeanproteinabundance betweentissuetypes.Proteinsthatshowedhigherexpression intumorthannon-tumortissues,andalsohigherexpression inLNMthaninthe tumortissues,orproteinsthatshowed lowerexpressionintumorsthaninthe non-tumortissues, andevenlowerexpressionintheLNMtissueswereselected ascandidateproteinsassociatedwithLNM.
2.3. Pathwayanalysis
Pathway analysis of differentially expressed proteins was performedusingtheCytoscapesoftware[12]withthe Reac-tomefunctionalinteraction(FI)plug-in[13].TheReactomeFI datasetunitesinteractionsfromReactomeandthosederived from the pathwaydatabases,including KEGG,BioCye, Pan-ther, TheCancer Cell Map (http://cancer.cellmap.org/), and NCI-PID, withpair-wise interactions gleaned from physical protein-proteininteractionsinhumanandmodelorganisms, genecoexpressiondata,proteindomain–domaininteractions, protein interactions generated from text mining, and GO annotations[13].Toinvestigatethefunctionsofthenetwork created,pathwayenrichmentanalysiswasperformedusing theReactomeFIplug-in.Pathwayswithafalsediscoveryrate (FDR)<0.05wereconsideredtobesignificantlyenriched.
2.4. Westernblotting
Protein samples were separated by SDS-PAGE and blotted onto aPVDF membrane. Primary antibodies against ITGB3 (1:1000;BDBioscience,SanJose,CA)andsecondary antibod-ies against mouse IgG (1:2000, GE Healthcare Biosciences, Uppsala,Sweden) were used, and immunocomplexes were detectedusinganenhancedchemiluminescencesystem(ECL Prime Western Blotting DetectionReagents; GE Healthcare Biosciences)and LAS-3000 (Fujifilm, Tokyo, Japan). To nor-malizetheamountofproteinloadedineachlane,thesame membraneswere stained with PonceauS. Theintensity of WesternBlotsignalsandthedensityofthetotallanesstained withPonceauSweremeasuredusingImageQuant software (GEHealthcareBiosciences),andtherelativeintensitywas cal-culatedbydividingtheintensityofWesternBlotsignalsbythe opticaldensityofthetotallanes.
2.5. Geneexpressionanalysis
The microarrayand clinical and pathological dataset of89 gastriccancercaseswasobtainedfromtheGeneExpression Omnibus(GEO)database(GSE4007).Thisdatasetconsistsof atotalof44,500probescorrespondingtoabout30,300unique genes.Geneexpressiondataof14casesthatincluded14 pri-mary tumor tissues, 14 corresponding LNM tissues, and 5 matchednon-tumor mucosae, were selectedforthe analy-sis.TocompareproteinandmRNAexpression,weselected probescorrespondingtothedifferentiallyexpressed109genes identifiedinproteomicanalysis.Wecouldobtainthe expres-siondataof67genes.Weselectedaprobewiththehighest expressionvaluewhenmultipleonesexistfortheidentical gene.Additionaldataprocessingsuchasnormalizationwas notperformed. Geneexpressiondatawere importedtothe Expressionistanalystsoftware(GeneData,Basel,Switzerland), and mean expressionratios between differenttissuetypes werecalculated.Wedefinedthedifferentexpressionasmore than1.0folddifferenceofthemeanexpressionvaluebetween thetissuetypes.
2.6. Geneontologyenrichmentanalysis
Geneontology(GO)enrichmentanalysiswasperformedusing DAVID,version6.7[14].Datarelatedtogeneswithconcordant anddiscordantmRNAandproteinexpressionwereseparately uploadedtoDAVID,andthebackgroundwasdefinedas“Homo sapiens”. Functional annotation charts were created using “GOTERMBPFAT”(collectionofbroadest GOtermscurated from GOannotationsdataset).Thresholdswerechangedto a gene count of two and an EASE score of one (modified FisherexactP-value).TheP-valueforeachGOtermreflects enrichmentinthefrequencyofthatGOtermintheuploaded gene list, relative to all the genes in the background list. The GO terms were filtered to include enrichments with Benjamini–HochbergcorrectedP-valueslessthan0.20. 2.7. Statisticalanalysis
TheKruskal–Wallistest wasperformedtocompare contin-uous variables in multiple groups by using the SPSS 11.5 statistical package(SPSS,Chicago,IL),and differenceswith
P<0.05wereconsideredstatisticallysignificant.
3.
Results
AnoverviewoftheexperimentworkflowisshowninFig.1. First,wegeneratedproteinexpressionprofilesofpaired non-tumor, tumor, and LNMtissues fromcases 1and 2(Fig. 1, Table1).EachproteinsamplewasseparatedbySDS-PAGE,and thegellaneswerecuttoobtain48pieces.Trypsindigestswere extracted fromeach gelpiece,and subjectedtoLC–MS/MS. Weidentifiedandquantified109,949uniquepeptides corre-spondingto3894nonredundantproteinsfromsixsamplesin technicalduplicatesbytheProgenesisLC-MSsoftware (Sup-plementaryTables1and2).Tomonitorthereproducibilityof thewholeprocess(SDS-PAGEseparation,in-geltryptic diges-tions,LC–MS/MS,andproteinquantification),wegenerateda
eupa open proteomics 3 (2014)183–194
187
Fig.1–Experimentalworkflowofalabel-freeproteomics approachwithpathwayenrichmentandmRNAexpression meta-analysis.Non-tumor(NT),tumor(T)andlymphnode metastasis(LNM)tissueswereexamined.Thelabel-free quantificationmethodquantifiedtheexpressionofatotal of3894proteins;109differentiallyexpressedproteinswere furtheranalyzedforfunctionalinteractionsandbiological enrichedpathways.Thebeta-3integrin(ITGB3)pathway wasthemostenrichedpathwayinthefunctional interactionnetworkcreated.Theassociationbetween ITGB3proteinexpressionandgastriccancerprogression wasconfirmedbyWesternblotting.Amongthe109genes, 67weregroupedaccordingtosimilaritybetweenthe proteinandmRNAexpressionpatterns,suchas
“Concordantgenes”or“Discordantgenes”.Geneontology analysisshowedtheenrichedfunctionalcharacteristicsin theeachgenegroups.
scatterplotoftechnicalduplicatesfromidenticalsamplesof theprimarytumortissuefromcase2(Table1)andcalculated thePearson’scorrelationcoefficient.Thescatterplotshowed thatthenormalizedabundanceof83.7%and94.5%ofthe pro-teinsrangedwithin2.0–4.0-folddifference,respectively,and
thatthecorrelationcoefficientwas0.92(SupplementaryFig. 1).Theseresultsdemonstratedhighreproducibilityof label-freeproteinexpressionprofiling.
SupplementaryTables1and2andFig.1canbefound,in theonlineversion,atdoi:10.1016/j.euprot.2014.03.001.
We compare protein expression profiles between the non-tumor,tumor,andLNMtissuesintwocases(Case1and 2, Table 1). Among the 3894 proteins, 55 proteins showed significantly (>2-fold ratio of means in two cases) higher expressionintumorthannon-tumortissuesandalso signif-icantlyhigherexpressioninLNMthan inthetumortissues (Fig.2).Incontrast,54proteinsshowedsignificantly(<2-fold ratio of means in two cases) lower expression in tumors thaninthenon-tumortissues,andevensignificantlylower expressioninthe LNMtissues(Fig.3).Weselectedthe 109 differentiallyexpressedproteinsascandidateproteins asso-ciatedwithLNM.Detailsoftheseproteinsare presentedin SupplementaryTable3.
SupplementaryTable3canbefound,intheonlineversion, atdoi:10.1016/j.euprot.2014.03.001.
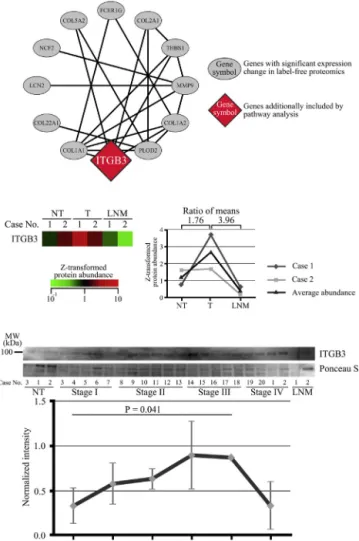
Westudiedthefunctional interactionsofthese109 pro-teinsbyusingCytoscapewiththeReactomeFIplug-in.We foundthat 11(10.1%)ofthe109 proteinswere functionally linked toeach other and thatthe ITGB3cell surface inter-actionspathwaywasthemostsignificantlyenrichedinthe identifiednetworkofthe11proteins(FDR<1.00E-4,Fig.4Aand Table2).ITGB3wasidentifiedandexaminedinourproteomic analysis. ITGB3protein expressioninthe LNM tissueswas lower thanthatofthetumortissues(ratioofmeans=3.96), and that ofthe tumortissueswashigher than that ofthe non-tumor tissues(ratio ofmeans=1.76) (Fig.4B).We vali-datedtherelationshipbetweenITGB3expressionandgastric cancer progression in 20 cases byWestern blotting. ITGB3 expressionwas foundto significantlyincrease withcancer stageprogressionbutdecreaseinLNMtissues(Fig.4C).These observationsconfirmedthe resultsofthe label-freeprotein expressionprofiling.
We analyzedthe mRNAlevels for the 109 differentially expressed proteins by using a public mRNA expression database.WeselectedtheGSE4007datasetintheNCBIGene ExpressionOmnibus(GEO) becauseit wasthe onlydataset that included mRNAexpressiondata obtainedfrom paired non-tumortissues,primarytumortissues,andLNMtissues, alongwithsufficientclinicalinformation.Fromthe109genes, themRNAexpressiondatafor67geneswereincludedinthe GSE4007 dataset.Clinical andpathological informationand dataonmRNAexpressionhavebeenpresentedin Supplemen-taryTables4and5,respectively.
SupplementaryTables4and5canbefound,intheonline version,atdoi:10.1016/j.euprot.2014.03.001.
To characterize the genes according to the correlation between mRNA and proteinexpression, wedivided the 67 genesintotwogroups:26genes(38.8%)thatshowedthesame protein and mRNA expression patterns were grouped into “Concordantgenes”(Table3),whereas41genesthatshowed differentpatternsweregroupedinto“Discordantgenes”.We analyzedtheenrichedGOtermsineachgroupbyusingDAVID, version6.7.GOtermsrelatedtooxidation,reduction,or hor-monemetabolismwereenrichedinthegroupof“Concordant genes”,whilethoseinvolvedinphagocytosisorcelladhesion
Fig.2–Fifty-fivesignificantlyupregulatedproteinsidentifiedbyalabel-freequantificationmethod.Theproteinabundance ineachcasewasz-transformedacrossallsixsamplesandhasbeenpresentedinaheatmapformat.Tissuetypesare markedasnon-tumor(NT),tumor(T),andlymphnodemetastasis(LNM).CasenumberscorrespondtothoseinTable1and Fig.4.RefertoSupplementaryTable3forthegenedescriptionandvaluesoftheratioofmeans.
wereover-representedinthe“Discordantgenes”group(Fig.5 andSupplementaryTable6).
SupplementaryTable6canbefound,intheonlineversion, atdoi:10.1016/j.euprot.2014.03.001.
4.
Discussion
LNMisoneofthemostimportantprognosticfactorsin gas-triccancer,andinvestigationofthemolecularbackgroundof LNMformationmayleadtonoveltherapeuticmodalities[4]. Metastasishasbeenassumedtooccurthroughclonalgenomic andepigeneticevolution[5].Molecularmechanismsrelatedto tumormetastasisareupregulatedinmetastatictumorcells comparedto primary tumors,and exploring differences in
the molecularbackgroundofprimarytumorsandLNM tis-suesmaybethemostdirectandcrediblewaytoelucidatethe molecularmechanismsunderlyingthemetastasisprocess.
We employed SDS-PAGE-based size fractionation before massspectrometryanalysis.Pre-fractionationofproteinsby SDS-PAGE hassignificant advantagesover other separation techniques in that it detects a greater number ofproteins andiswidelyusedtocharacterizeproteincomplexesin can-cerproteomicstudies[15–17].Gel-basedsizefractionationfor theidentificationofproteinsissuperiortoseparationby liq-uidchromatographyasapre-fractionationmethod[18].Jafari et al. compared gel-based protein-separation techniques, including SDS-PAGE, isoelectric focusing with immobilized pH gradientgelstrips (IEF-IPG),and two-dimensionalPAGE (2D-PAGE), on the basis of their ability to serve as a
eupa open proteomics 3 (2014)183–194
189
Fig.3–Fifty-foursignificantlydownregulatedproteinsidentifiedbyalabel-freequantificationmethod.Theprotein abundanceofeachgenewasz-transformedacrossall6samplesandhasbeenpresentedinaheatmapformat.Thetissue typesaremarkedasshowninFig.2.CasenumberscorrespondtothoseinTable1andFig.4.RefertoSupplementaryTable 3forthegenedescriptionandvaluesoftheratioofmeans.
fractionationtechniqueforMSanalysisofacomplexprotein sample[19].TheyreportedthatSDS-PAGEyieldedthehighest numberofidentifiableproteins.
In addition, we quantified the identified proteins by a label-free method with the Progenesis LC-MS software. Label-freequantificationiswidelyusedbecauseitisasimple techniquethatallowssimultaneousidentificationand quan-tificationofproteins.Alternatively,isotopiclabelingmethods suchasICAT[20],iTRAQ[21],andSILAC[22]arealsousedfor MS-basedproteinquantification;theseisotopiclabeling meth-odsallowforthecomparisonofmultiplesamplesinasingle LC–MS/MSrun,therebyprovidingincreasedaccuracy, preci-sion,andreproducibility[23].However,suchexperimentsare complicatedbecauseoftheadditionallabelingreactions,and SILACisavailableonlyintissueculturesystems.Alabel-free
methodbasedonProgenesisLC-MScanquantifyand iden-tify thousands of proteins from complex samples with a simpletechniqueandhighreproducibility.ProgenesisLC-MS alignstheionchromatogramstocompensateforvariationsin retentiontimesamongmultiplesamplesbeforequantification based on ion intensities. Ithas been reported that analy-sisofretentiontimealignmentshowssimilarquantification precisionandreproducibilitybuthigheridentification capac-itythanisotopelabelingmethodssuchasSILAC[24].Inthis study,weidentifiedandquantified3894non-redundant pro-teinsfromcomplexclinicalsampleswithhighreproducibility (SupplementaryFig.1)andthenemployedalabel-free quan-tificationmethodfortheproteomicstudies.
Thedevelopmentoftumorinvasionand metastasisisa very complicatedandcontinuous processwithmultisteps.
Fig.4–Beta-3integrin(ITGB3)pathwayandassociationof theITGB3proteinexpressionwithprogressionofgastric cancer.CasenumberscorrespondedtothoseinTable1. FunctionalinteractionnetworkanalysisbyCytoscapewith theReactomeFIplug-inisdemonstrated(A).TheITGB3 proteinexpressionlevelquantifiedbyalabel-freemethod (B).ITGB3proteinexpressionlevelwasz-transformed acrossallsixsamplesexaminedandwasrepresentedasa heat-mapformatandlinechart.ITGB3proteinexpression in20gastriccancercases,evaluatedbyWesternblotting(C).
Investigationofthemolecularbackgroundoftumor metas-tasis through“omics” studiesrevealed that multiplegenes aberrationswerecontributed tothe tumormetastasis [7,8]. Therefore, we tried toexamine the overall features ofthe expressedproteins,andidentified109aberrantly expressed proteins.Next,weidentifiedtheITGB3pathwayasthemost enrichedproteininteractionnetworkthoroughthepathway enrichmentanalysisinthe109proteins(Fig.4A).Inaddition, wemonitored the ITGB3protein expressionusing the cre-atedproteinexpressionprofile.Integrins are heterodimeric cellsurfaceglycoproteinswithalphaandbetasubunits.ITGB3 expressionismainlyassociatedwiththemigrationand inva-sionoftumorcells[25],andoverexpressionofITGB3isrelated tothemetastatic potentialofmelanoma[26],breastcancer [27], colorectal cancer [28], and bone metastasis in breast cancer[29]. However,in ovariancancer, ITGB3reducesthe
metastaticpotentialoftumorcells[30–32].Inhepatocellular carcinomacells,ITGB3hasbeenshowntohaveaproapoptotic function,and downregulationofITGB3isrelatedto aggres-sivetumorgrowth [33].Therefore, theassociation ofITGB3 expressionwithtumormetastasisandprogressiondepends onthecancertype.Inthecurrentstudy,ITGB3expressionwas increasedascancerstageadvanced,therebylinkingitto gas-triccancerprogression.Theseobservationsaresupportedby previousfindings[34].However,downregulationofITGB3in theLNMtissueshasnotbeenreporteduntilourstudy. Neo-plasticinvadingcellsmustovercometheintegrin-mediated death (IMD) induced by the interaction of ITGB3 with the extracellular matrixofhosttissuestoestablish metastases [25].Whenatumorcellmigratesthroughamicroenvironment wheretheextracellularmatrix(ECM)doesnotcontaina suit-able ligandforITGB3,the integrin cytoplasmictailrecruits caspase-8to thecell membrane,and apoptosis isinduced. Stupacketal.[35]showedthatITGB3-expressingmelanoma cellsundergoapoptosis incollagengelsthatlackITGB3 lig-ands.ITGB3specificallybindsawiderangeofECMmolecules, includingfibronectin,fibrinogen,vonWillebrandfactor,and vitronectin[36].Thepresentproteomicanalysisdemonstrated thatseveralcollagen-relatedgeneswereupregulatedinLNM tissues,whilefibronectin,fibrinogen,andvitronectinwerenot identifiedasupregulatedproteinsinLNMtissues(Fig.2and SupplementaryTable3).Therefore,ITGB3downregulationin gastriccancercellsthatshowedLNMmightreflectasurvival mechanism related tothe preventionofIMD inmetastatic tissues.
The problems of the proteomic biomarker studies are lack of the validation studies in the independent clinical samplesfromthemulti-institutions.Selectionofbiomarker candidates from the differentially expressed proteins and acquisition of the independent clinical samples are criti-calstepsinmulti-institutionalbiomarkervalidationstudies. Transcriptomedata are deposited inpublicdatabases with clinicopathologicaldataofthesamples,andarefreely avail-ableforindependentvalidationstudies;asclinicalmaterials aregenerallynotveryaccessible,suchinfrastructureishighly desirableforproteomicbiomarkerstudies.However,presently, thereisnoanalogousproteomicdatabase.Forproteinswhose levels demonstrate concordance with mRNA expression, a transcriptomedatabaseshouldbeausefultoolforbiomarker selection and validation. Several studies have compared mRNAandproteinlevelsintissueculturecells.Chenetal.[37] comparedmRNAandproteinexpressionbetweentwogastric cancercelllinesandestimatedanoverallcorrelation coeffi-cientof0.29.PreviousstudiescomparingmRNAandprotein expressioninhumanandmousecelllinesconcludedthatthe mRNAlevelsexplainapproximately40%ofthevariabilityin proteinlevels[38].Althoughthesestudiessuggestedpossible benefitsofusingtranscriptomedatabasesforvalidation stud-ies,thecorrelationbetweenproteinandmRNAexpressionin surgicallyresectedtissuesremainunclear.Weanalyzedthe mRNAlevelsforthe109differentiallyexpressedproteinsby usingapublicmRNAexpressiondatabase.Ofthese109 pro-teins,67werelistedinthegastriccancerdatasetoftheGEO database. We foundthat 26 of 67 genes (38.8%) showed a concordantexpressionpatternforproteinandmRNA.These concordant genes were enriched in GO terms related to
eupa open proteomics 3 (2014)183–194
191
Table2–Pathwayenrichmentanalysisfortheidentifiedproteinnetworkconsistingof11proteins.
Pathwaya Sourceb FDRc Numberof
proteinsd Includedproteins
e
Beta3integrincellsurfaceinteractions NCI-PID 1.00E−04 3 COL1A2,COL1A1,THBS1
Amoebiasis KEGG 1.11E−04 4 COL1A2,COL2A1,COL1A1,COL5A2
Integrincellsurfaceinteractions Reactome 1.25E−04 4 COL1A2,COL2A1,COL1A1,THBS1
Proteindigestionandabsorption KEGG 1.43E−04 4 COL1A2,COL2A1,COL1A1,COL5A2
SignalingbyPDGF Reactome 1.67E−04 5 COL1A2,COL2A1,COL1A1,THBS1,COL5A2
Integrinsignalingpathway Panther 1.82E−04 4 COL1A2,COL2A1,COL1A1,COL5A2
Focaladhesion KEGG 2.00E−04 5 COL1A2,COL2A1,COL1A1,THBS1,COL5A2
Plateletadhesiontoexposedcollagen Reactome 2.50E−04 3 COL1A2,FCER1G,COL1A1
ECM-receptorinteraction KEGG 3.33E−04 5 COL1A2,COL2A1,COL1A1,THBS1,COL5A2
Beta1integrincellsurfaceinteractions NCI-PID 5.00E−04 5 COL1A2,COL2A1,COL1A1,THBS1,COL5A2
Extracellularmatrixorganization Reactome 1.00E−03 7 PLOD2,MMP9,COL22A1,COL1A2,COL2A1,
COL1A1,COL5A2
Cellsurfaceinteractionsatthevascularwall Reactome 1.31E−03 3 COL1A2,FCER1G,COL1A1
Axonguidance Reactome 1.42E−03 4 COL1A2,COL2A1,COL1A1,COL5A2
Plateletactivation,signalingandaggregation Reactome 1.93E−03 4 COL1A2,FCER1G,COL1A1,THBS1
VEGFR3signalinginlymphaticendothelium NCI-PID 4.00E−03 2 COL1A2,COL1A1
Syndecan-4-mediatedsignalingevents NCI-PID 6.06E−03 2 MMP9,THBS1
ValidatedtranscriptionaltargetsofAP1family
membersFra1andFra2
NCI-PID 7.76E−03 2 MMP9,COL1A2
Bladdercancer KEGG 9.39E−03 2 MMP9,THBS1
a PathwayenrichmentanalysiswasperformedusingCytoscapewithReactomeFIplug-in[http://wiki.reactome.org/index.php/ReactomeFI
CytoscapePlugin].
b ReactomeFIdatasetunitesinteractionsfromReactomeandthosederivedfromotherpathwaydatabases,includingKEGG,NCI-PID,BioCyc,
PantherandTheCancerCellMap.
c FDRwascalculatedbyReactomeFIplug-in,andthesignificantthresholdwassetatlessthan0.05.
d Thenumbersofproteinswhichwereexaminedinthisstudyinvolvedinthepathway.
e Genenameswhichwereidentifiedtobesignificantlyup-ordown-regulatedbyproteomicexperimentwereshown.
Fig.5–FunctionalcharacteristicsofgeneswithconcordantanddiscordantproteinandmRNAexpression.Geneswere groupedaccordingtotheirproteinandmRNAexpressionpatternsandanalyzedforenrichedgeneontologytermsby DAVID,version6.7(http://david.abcc.ncifcrf.gov).GOtermswithenrichmentofP<0.20werelisted,andP-valueswere z-transformedandhavebeenpresentedinaheatmapformat.
e u p a o p e n p r o t e o m i c s 3 ( 2 0 1 4 ) 183–194
Table3–Listof26geneswithcorrelationbetweenproteinandmRNAexpression.
Genesymbola GeneIDb Genedescription Protein mRNA
Accession numberc Ratio (T/NT)d Ratio (LNM/T)e ProbeIDf Accession numberg Ratio (T/NT)d Ratio (LNM/T)e Up-regulatedgenesatbothproteinandmRNAlevel
MMP9 4318 Matrixmetalloproteinase-9 P14780 3.46 2.63 10805 T64837 2.56 1.03
AGMAT 79814 Agmatinase,mitochondrial Q9BSE5 2.91 2.51 15950 AA934764 1.11 1.24
CTSH 1512 CathepsinH P09668 2.78 3.33 953 AA487231 1.04 1.05
TGOLN2 10618 Trans-Golginetworkintegralmembraneprotein2 O43493 2.84 3.73 15417 T81338 1.21 1.05
SLC26A2 1836 Sulfatetransporter P50443 2.42 2.07 10913 W15263 1.13 1.02
XRN2 22803 5–3exoribonuclease2 Q9H0D6 13.38 2.36 8162 AA028164 1.41 1.13
FAM103A1 83640 ProteinFAM103A1 Q9BTL3 2.09 2.79 12871 AA432100 1.14 1.01
TAPBP 6892 Tapasin O15533 102.06 726.07 18291 AA704775 2.20 1.09
TCL1A 8115 T-cellleukemia/lymphomaprotein1A P56279 88.57 3.65 12786 R97095 1.07 2.62
GDAP1 54332 Ganglioside-induceddifferentiation-associatedprotein1 Q8TB36 3.99 3.09 17310 H15302 1.45 1.06
NCF2 4688 Neutrophilcytosolfactor2 P19878 4.97 6.98 6201 AA872098 3.26 1.42
CHD4 1108 Chromodomain-helicase-DNA-bindingprotein4 Q14839 2.07 2.49 5588 N34372 1.16 1.20
Down-regulatedgenesatbothproteinandmRNAlevel
CA2 760 Carbonicanhydrase2 P00918 4.61E−01 2.99E−01 15331 H23187 1.21E−01 9.92E−01
GKN2 200504 Gastrokine-2 Q86XP6 3.76E−01 4.97E−01 8090 AI732254 1.45E−02 3.96E−01
MUC2 4583 Mucin-2 Q02817 4.04E−01 3.47E−01 25161 AA534503 4.62E−01 5.30E−01
CLDN18 51208 Claudin-18 P56856 3.91E−01 2.98E−01 11694 AI820565 3.45E−01 6.81E−01
DHRS4 10901 Dehydrogenase/reductaseSDRfamilymember4 Q9BTZ2 4.87E−01 2.76E−01 18212 AA429946 6.46E−01 9.40E−01
DHRS3 9249 Short-chaindehydrogenase/reductase3 O75911 3.98E−01 1.68E−01 1133 AA171606 7.77E−01 8.00E−01
HSD11B2 3291 Corticosteroid11-beta-dehydrogenaseisozyme2 P80365 3.70E−01 3.27E−01 174 W95082 6.95E−01 8.90E−01
PGC 5225 Gastricsin P20142 4.34E−01 3.00E−01 19526 AI674972 3.04E−02 3.25E−01
REG4 83998 Regeneratingislet-derivedprotein4 Q9BYZ8 4.92E−01 4.95E−01 3562 AA535703 6.40E−01 7.55E−01
PRR15 222171 ProteinPRR15 Q8IV56 4.33E−01 4.87E−01 17960 AA515032 8.49E−01 6.52E−01
GMPR 2766 GMPreductase1 P36959 4.07E−01 3.27E−01 19 AA406242 5.21E−01 9.33E−01
CLMN 79789 Calmin Q96JQ2 2.91E−01 4.71E−01 23849 AA775028 7.31E−01 8.14E−01
ABCC3 8714 Canalicularmultispecificorganicaniontransporter2 O15438 4.72E−01 2.75E−01 15480 AA429895 7.51E−01 6.54E−01
a GenesymbolswerederivedfromUniGene. b GeneIDswerederivedfromEntrezGenedatabase.
cAccessionnumbersofproteinswerederivedfromSWISS-PROTandNCBInonredundantdatabases.
dRatioswerecalculatedbydividingthemeanexpressionvalueofprimarytumorsamples(T)bythatofnon-tumorsamples(NT).
e Ratioswerecalculatedbydividingthemeanexpressionvalueoflymphnodemetastasissamples(LNM)bythatofprimarytumorsamples(T). f ProbeIDswerederivedfromNCBIGEOplatform(GPL1283).
eupa open proteomics 3 (2014)183–194
193
oxidationreduction,orhormonemetabolism,whilethegenes withdiscordantexpressionpatternwereenrichedinGOterms relatedtophagocytosisandcelladhesion.Theseresultsare consistent with the findings of Schwänhausser et al. [38], whoreportedthatgenesrelatedtooxidationreduction,and metabolismwereenrichedinthegroupwithstableand con-cordantmRNAandproteinexpression.Theyalsofoundthat theGOtermsofcelladhesionwereenrichedinthegroupof genesthatwas characterizedbystablemRNAbut unstable proteinandwasexpectedtohavediscordantexpression[38]. Unfortunately,thereliabilityofouranalysisdidnotreachtheir onebecausethenumberofsamplesinourproteomicstudy waslimitedandmRNAexpressiondatawasobtainedfrom differentpatientcohorts.Furtherinvestigationofadditional sampleswillberequiredtogeneralizeourobservations.The useofpublictranscriptomedatabaseswillsolvetheproblems ofproteomicbiomarkerstudies,andtherefore,these investi-gationsshouldbecontinued.
Inourstudy,highlycomprehensiveandreproducible pro-teomicanalysisperformed usingalabel-free quantification method showed downregulation of ITGB3 gene expression inthe LNM tissues. Downregulation ofITGB3 represents a prosurvival response for overcoming apoptotic IMD at the metastaticsite.Furtherstudiesontheprognosticand biolog-icalsignificanceofITGB3mayleadtonovelrisk-stratification approachesforgastriccancer.
Acknowledgements
WewouldgreatlyappreciateDr.MSasagawa(Nanbugo Gen-eralHospital),Dr.NShimakage(NagaokaRedCrossHospital), Dr.TSuda (NipponDentalUniversityMedicalHospital),Dr. N Katayanagi (Niigata City General Hospital), Dr. T Tada (TachikawaGeneral Hospital), Dr. SShimoda (Shibata Hos-pital), Dr. N Musha (Saiseikai Niigata Daini Hospital), Dr. H Tomita (Sakamachi Hospital) and K Ueki (Kashiwazaki GeneralHospitaland MedicalCenter)tocollect theclinical samplesandtheclinicopathologicaldata.Thisworkwas sup-portedbytheNationalCancerCenterResearchCoreFacility andtheNationalCancerCenterResearchandDevelopment Fund (23-A-8 and 23-A-10). Hiroshi Ichikawa was awardee of Research Resident Fellowship from the Foundation for PromotionofCancerResearch(Japan)forthe3rdTerm Com-prehensive10-YearStrategyforCancerControl.
r
e
f
e
r
e
n
c
e
s
[1] FerlayJ,ShinHR,BrayF,FormanD,MathersC,ParkinDM. Estimatesofworldwideburdenofcancerin2008: GLOBOCAN2008.IntJCancer2010;127:2893–917. [2] IsobeY,NashimotoA,AkazawaK,OdaI,HayashiK,
MiyashiroI,etal.GastriccancertreatmentinJapan:2008 annualreportoftheJGCAnationwideregistry.Gastric Cancer2011;14:301–16.
[3] WangW,LiYF,SunXW,ChenYB,LiW,XuDZ,etal. Prognosisof980patientswithgastriccanceraftersurgical resection.ChinJCancer2010;29:923–30.
[4] ParkSR,KimMJ,RyuKW,LeeJH,LeeJS,NamBH,etal. Prognosticvalueofpreoperativeclinicalstagingassessedby
computedtomographyinresectablegastriccancerpatients: aviewpointintheeraofpreoperativetreatment.AnnSurg 2010;251:428–35.
[5] DengJ,LiangH,SunD,ZhangR,ZhanH,WangX.Prognosis ofgastriccancerpatientswithnode-negativemetastasis followingcurativeresection:outcomesofthesurvivaland recurrence.CanJGastroenterol2008;22:835–9.
[6] ChafferCL,WeinbergRA.Aperspectiveoncancercell metastasis.Science2011;331:1559–64.
[7] XieHL,LiZY,GanRL,LiXJ,ZhangQL,HuiM,etal. Differentialgeneandproteinexpressioninprimarygastric carcinomasandtheirlymphnodemetastasesasrevealedby combinedcDNAmicroarrayandtissuemicroarrayanalysis.J DigDis2010;11:167–75.
[8] LiuX-P,LiD-Y,LiuX-L,XuJ-D,FuruyaT,KawauchiS,etal. Comparisonofchromosomalaberrationsbetweenprimary tumorsandtheirsynchronouslymph-nodemetastasesin intestinal-typegastriccarcinoma.PatholResPract 2009;205:105–11.
[9] SilvestriA,CalvertV,BellucoC,LipskyM,DeMariaR,DengJ, etal.Proteinpathwayactivationmappingofcolorectal metastaticprogressionrevealsmetastasis-specificnetwork alterations.ClinExpMetastasis2013;30:309–16.
[10] RuschVW,RiceTW,CrowleyJ,BlackstoneEH,Rami-PortaR, GoldstrawP.TheseventheditionoftheAmericanJoint CommitteeonCancer/InternationalUnionAgainstCancer StagingManuals:theneweraofdata-drivenrevisions.J ThoracCardiovascSurg2010;139:819–21.
[11] KondoT,HirohashiS.Applicationofhighlysensitive fluorescentdyes(CyDyeDIGEFluorsaturationdyes)tolaser microdissectionandtwo-dimensionaldifferencegel electrophoresis(2D-DIGE)forcancerproteomics.NatProtoc 2007;1:2940–56.
[12] ShannonP,MarkielA,OzierO,BaligaNS,WangJT,Ramage D,etal.Cytoscape:asoftwareenvironmentforintegrated modelsofbiomolecularinteractionnetworks.GenomeRes 2003;13:2498–504.
[13] CroftD,O’KellyG,WuG,HawR,GillespieM,MatthewsL, etal.Reactome:adatabaseofreactions,pathwaysand biologicalprocesses.NucleicAcidsRes2011;39:D691–7. [14] HuangdaW,ShermanBT,LempickiRA.Systematicand
integrativeanalysisoflargegenelistsusingDAVID bioinformaticsresources.NatProtoc2009;4:44–57. [15] XieLQ,ZhaoC,CaiSJ,XuY,HuangLY,BianJS,etal.Novel
proteomicstrategyrevealcombinedalpha1antitrypsinand cathepsinDasbiomarkersforcolorectalcancerearly screening.JProteomeRes2010;9:4701–9.
[16] ThakurD,RejtarT,WangD,BonesJ,ChaS,Clodfelder-Miller B,etal.Microproteomicanalysisof10,000lasercaptured microdissectedbreasttumorcellsusingshort-rangesodium dodecylsulfate-polyacrylamidegelelectrophoresisand porouslayeropentubularliquidchromatographytandem massspectrometry.JChromatogrA2011;1218:8168–74. [17] ZhangY,XuB,LiuY,YaoH,LuN,LiB,etal.Theovarian
cancer-derivedsecretory/releasingproteome:arepertoireof tumormarkers.Proteomics2012;12:1883–91.
[18] PernemalmM,OrreLM,LengqvistJ,WikstromP,Lewensohn R,LehtioJ.Evaluationofthreeprincipallydifferentintact proteinprefractionationmethodsforplasmabiomarker discovery.JProteomeRes2008;7:2712–22.
[19] JafariM,PrimoV,SmejkalGB,MoskovetsEV,KuoWP,Ivanov AR.Comparisonofin-gelproteinseparationtechniques commonlyusedforfractionationinmass
spectrometry-basedproteomicprofiling.Electrophoresis 2012;33:2516–26.
[20] GygiSP,RistB,GerberSA,TurecekF,GelbMH,AebersoldR. Quantitativeanalysisofcomplexproteinmixtures usingisotope-codedaffinitytags.NatBiotechnol 1999;17:994–9.
[21] RossPL,HuangYN,MarcheseJN,WilliamsonB,ParkerK, HattanS,etal.Multiplexedproteinquantitationin
Saccharomycescerevisiaeusingamine-reactiveisobaric taggingreagents.MolCellProteomics2004;3:1154–69. [22] OngSE,BlagoevB,KratchmarovaI,KristensenDB,SteenH,
PandeyA,etal.Stableisotopelabelingbyaminoacidsincell culture,SILAC,asasimpleandaccurateapproachto expressionproteomics.MolCellProteomics2002;1:376–86. [23] LiZ,AdamsRM,ChoureyK,HurstGB,HettichRL,PanC.
Systematiccomparisonoflabel-free,metaboliclabeling,and isobaricchemicallabelingforquantitativeproteomicson LTQOrbitrapVelos.JProteomeRes2012;11:1582–90. [24] MerlJ,UeffingM,HauckSM,vonToerneC.Direct
comparisonofMS-basedlabel-freeandSILACquantitative proteomeprofilingstrategiesinprimaryretinalMullercells. Proteomics2012;12:1902–11.
[25] HoodJD,ChereshDA.Roleofintegrinsincellinvasionand migration.NatRevCancer2002;2:91–100.
[26] FilardoEJ,BrooksPC,DemingSL,DamskyC,ChereshDA. RequirementoftheNPXYmotifintheintegrinbeta3 subunitcytoplasmictailformelanomacellmigration invitroandinvivo.JCellBiol1995;130:441–50.
[27] GalliherAJ,SchiemannWP.Beta3integrinandSrcfacilitate transforminggrowthfactor-betamediatedinductionof epithelial-mesenchymaltransitioninmammaryepithelial cells.BreastCancerRes2006;8:R42.
[28] LeiY,HuangK,GaoC,LauQC,PanH,XieK,etal.Proteomics identificationofITGB3asakeyregulatorinreactiveoxygen species-inducedmigrationandinvasionofcolorectalcancer cells.MolCellProteomics2011;10.M110.005397.
[29] LiapisH,FlathA,KitazawaS.IntegrinalphaVbeta3 expressionbybone-residingbreastcancermetastases. DiagnMolPathol1996;5:127–35.
[30] ChenJ,ZhangJ,ZhaoY,LiJ,FuM.Integrinbeta3
down-regulatesinvasivefeaturesofovariancancercellsin SKOV3cellsubclones.JCancerResClinOncol
2009;135:909–17.
[31] PartheenK,LevanK,OsterbergL,ClaessonI,FalleniusG, SundfeldtK,etal.Fourpotentialbiomarkersasprognostic factorsinstageIIIserousovarianadenocarcinomas.IntJ Cancer2008;123:2130–7.
[32] PartheenK,LevanK,OsterbergL,ClaessonI,SundfeldtK, HorvathG.ExternalvalidationsuggestsIntegrinbeta3as prognosticbiomarkerinserousovarianadenocarcinomas. BMCCancer2009;9:336.
[33] WuY,ZuoJ,JiG,SaiyinH,LiuX,YinF,etal.Proapoptotic functionofintegrinbeta(3)inhumanhepatocellular carcinomacells.ClinCancerRes2009;15:60–9.
[34] ChuYQ,YeZY,TaoHQ,WangYY,ZhaoZS.Relationship betweencelladhesionmoleculesexpressionandthe biologicalbehaviorofgastriccarcinoma.WorldJ Gastroenterol2008;14:1990–6.
[35] StupackDG,PuenteXS,BoutsaboualoyS,StorgardCM, ChereshDA.Apoptosisofadherentcellsbyrecruitment ofcaspase-8tounligatedintegrins.JCellBiol2001;155: 459–70.
[36] vanderFlierA,SonnenbergA.Functionandinteractionsof integrins.CellTissueRes2001;305:285–98.
[37] ChenYR,JuanHF,HuangHC,HuangHH,LeeYJ, LiaoMY,etal.Quantitativeproteomicandgenomic profilingrevealsmetastasis-relatedproteinexpression patternsingastriccancercells.JProteomeRes 2006;5:2727–42.
[38] SchwanhausserB,BusseD,LiN,DittmarG,SchuchhardtJ, WolfJ,etal.Globalquantificationofmammaliangene expressioncontrol.Nature2011;473:337–42.