Cloud Computing Spot Pricing Dynamics: Latency and Limits to Arbitrage
byHsing Kenneth Cheng, Zhi Li, and Andy Naranjo* *Warrington College of Business Administration
Hough Graduate School of Business University of Florida
Gainesville, Florida 32611
Email: [email protected]; [email protected]; [email protected]
1
Cloud Computing Spot Pricing Dynamics: Latency and Limits to Arbitrage
AbstractThis paper examines the influence of latency on cloud computing pricing dynamics. Using Amazon EC2 east and west market spot instance pricing and latency intra-day data from April 9, 2010 to May 22, 2011, we find considerable time variation in spot instance prices and prices are often persistently greater in the west. Bivariate Vector Autoregressive model results show that within-market autoregressive pricing effects are larger than across-market effects. We document that a large portion of the relative price discovery (over 70%) occurs in the east market. Our regression results further show that east-west latency differentials have a significantly positive effect on east-west pricing differentials. Latency creates a dynamic pricing wedge that widens or narrows conditional on the latency differentials. Using an Error Correction model, the speed of adjustment from long-run pricing convergence errors causes the short-run price differential to narrow, but the adjustment is only partial.
2
1. Introduction
Cloud computing continues to garner significant attention as an increasingly important computing environment that will continue to grow over time. According to conservative estimates by Reid and Kisker (2011), the global cloud computing market will grow from $40.7 billion in 2011 to $241 billion in 2020. The cloud has various forms, including: SaaS (Software as a Service), PaaS (Platform as a Service), and IaaS (Infrastructure as a Service). It has succinctly been defined as an information technology service model where computing services (both hardware and software) are delivered on-demand to customers over a network in a self-service fashion, independent of device and location (Marston et al. 2011).1 Firms of all sizes have adopted or are considering moving to
cloud services. In the exuberance over this growing technological platform, pricing and quality are key issues facing current and prospective customers. In this paper, we focus on these fundamental issues by examining cloud computing spot pricing dynamics and the role that latency plays in the pricing dynamics across cloud computing markets.
Cloud computing providers, such as Amazon, offer basic computing and storage resources at relatively low prices. Amazon’s Elastic Compute Cloud (Amazon EC2) is one of the leading cloud service providers.2 The prices of EC2 instances are based on the region in
which the instance is running. Customers can purchase EC2 instances through on-demand instances, reserved instances, and spot instances.3 Spot instances are a relatively new
method as of December 2009 to both purchase and consume Amazon EC2 instances. They allow customers to bid on unused Amazon EC2 capacity and run those instances for as long as their bid exceeds the current spot price. Customers whose bids exceed the current spot
1 Similarly, Gartner (Plummer et al. 2008) describes the cloud as a style of computing where massively scalable IT-related capabilities are provided ‘as a service’ using internet technologies to multiple external customers. They estimate that annual global market for cloud computing will rise to $150 billion by 2013 (Pring et al. 2010).
2 In a Wall Street Journal article (Clayton 2011), William Fellows, principal analyst of the 451 Group, states that “in terms of market share Amazon is Coke and there isn’t yet a Pepsi.” The article further reports that UBS Investment Research estimated that Amazon’s Web Services revenue for its cloud division reached $500 million in 2010, rising to $750 million in 2011 and could hit $2.5 billion in 2014. Jeff Bezos, Amazon’s CEO, also told the company’s shareholders that AWS had the potential to be as big as the firm’s retail business, which had total sales of over $24.5 billion in 2009. 3 To initiate Amazon EC2 cloud instances, there are two basic steps. First, choose the instance type(s); then start, terminate, and monitor as many instances as needed using the web service APIs or the variety of management tools provided. Second, determine whether to run the instance in multiple locations. There are six main groups of instance types: Standard, Micro, High-Memory, High-CPU, Cluster-Compute and Cluster-GPU. They are divided by different characteristics for specific work requirements.
3
price gain access to the available spot instances. Historically, customers using spot instances have received significant price discounts beyond on-demand prices for no commitments beyond one hour. The Amazon EC2 spot market uses the Vickrey auction style, where customers submit sealed bids and the provider computes a market clearing price (Mazzucco and Dumas 2011). All winning customers pay the same price, which is the value of the lowest winning bid. Research indicates that this mechanism is a truthful auction given that the supply level can be adjusted ex post (Zhang et al. 2011).4
A fundamental factor in determining the pricing dynamics both within and across markets is the role of latency. Latency is a key issue not only for firms offering products and services to consumers over the Internet, but also for corporations considering the adoption of cloud computing. In fact, it has been dubbed the “Achilles Heel of Cloud Computing” (Minnear 2011). However, there is a scarcity of research examining the impact of latency on various aspects of cloud computing implementation, including no research that we are aware of that examines the effects of latency on pricing dynamics both within and across markets.5
In one of the earliest studies on the response time effect on user behavior, Miller (1968) showed that ten seconds is the threshold for user attention. However, this user attention threshold has reduced to two seconds in today’s e-commerce environment as consumers have become impatient when web pages take longer than two seconds to load (Forrester Consulting 2009). These user attention thresholds are important because a subpar Web experience results in lost revenue and unfavorable customer perception of the company. For example, an increase of 100ms response time can result in a 1% drop of sales
4 Although cloud computing has dominated discussions of corporate computing strategy, the prior literature provides little guidance on how to optimally price the cloud computing services to ensure allocational efficiency and fairness. Bapna et al (2008) are among the first to develop a market mechanism that considers allocational efficiency, incentive compatibility, fairness in allocation, and computational efficiency. A subsequent study by Bapna et al (2011) further extends the analyses from deterministic demand information to a stochastic case where buyers of cloud computing only know the distribution of their demand. Das et al (2011) examine the effects of providing a spot market with dynamic prices and forward contracts to hedge against the risk of demand stochasticity and unused (and thus wasted) capacity for an Internet storage provider.
5 Brynjolfsson and Smith (2000) find that branding, awareness, and trust are important sources of heterogeneity in pricing among internet retailers, while Brynjolfsson et al. (2009) document the importance of geography on the competition between the Internet channel and local stores. We further show that even with the same cloud provider and computing platform (i.e., same internet cloud provider and same good), price heterogeneity may exist due to latency differentials across markets.
4
at Amazon (Mazzucco 2010), and Google’s traffic will drop by 20% for half a second increase in returning search results (Mayer 2009).
A significant cause of Web application slow response time is the latency across the Internet. The one-way latency across the Internet is measured by the time from the source sending a packet of information to the destination receiving it. The primary source of network latency is the propagation delay – the time it takes for the packet to travel in communications media from source to destination (O3b Networks 2008). The longer the physical distance of the transmission path, the longer the propagation delay and thus the longer the latency.6
Understanding the nature of pricing dynamics both within and across markets is important for allocational and operational considerations, among other considerations. A key feature of any well-functioning market is the absence or near absence of arbitrage opportunities. Otherwise, individuals would buy in cheap markets and sell in dear markets until prices equalized. Arbitrage is one of the central tenets of competitive markets. It helps to enforce the “law of one price,” thereby helping to keep markets efficient. However, sometimes there are important impediments to arbitrage that exist across markets for the same good due to market frictions and imperfect information that can limit arbitrage. These “limits to arbitrage” can create pricing dynamics and wedges within and across markets that result in potentially suboptimal decisions with negative consequences. From a foundational and rational arbitrage perspective, price differentials should not exist except for wedges such as potential transaction cost differentials. We argue that latency creates such pricing wedges across cloud computing markets. We hypothesize that latency differentials across markets will significantly influence spot instance pricing dynamics across these markets. In particular, we hypothesize that latency differentials across markets will have a significantly positive effect on pricing differentials across these markets.
In our paper, we address three fundamental questions. First, what are the stylized pricing dynamics for Amazon EC2 spot instance pricing both within and across U.S. east
6 Datta et al. (2003) review various caching strategies to alleviate delay problems caused by network latency, where a Web cache is a temporary storage of desired content between the original server and end users. They survey the operations research and management science techniques that can be applied to the Web caching related problems. Answering to the call for additional research in Web caching, Hosanagar et al. (2005) find conditions under which a cache operator should offer both a premium service for which the content publisher pays and a free best effort service. Consumers are better off with more cached content at a faster delivery speed under such an arrangement.
5
and west regions? Second, what explains the observed pricing dynamics and pricing differentials across the east and west markets? Third, what effect does latency (and other potential event indicators) have on the across-market pricing differentials? To address these questions, we use various econometric modeling approaches and intra-day Amazon EC2 spot instance pricing data as well as intra-day latency data from April 9, 2010 to May 22, 2011.
We find that across Operating System (OS) platforms and spot instance types, there is considerable time variation in the pricing dynamics. We also find that prices in the west are often persistently greater than prices in the east over our sample period. Our bivariate VAR results suggest that there are significant dynamic pricing relations both within and across the east and west markets. The within-market effect is larger than the across-market effect, but there are also significantly pronounced across-across-market pricing effects. Using both Hasbrouk’s (1995) and Gonzalo and Granger’s (1995) price discovery methodologies, we find that over 70% of the relative price discovery occurs in the east market.
To explain the observed time varying pricing differentials across the east and west markets, we use both regression procedures and an Error Correction model (ECM). We find that both the east and west latency differentials have a significantly positive effect on the pricing differential, suggesting that larger (smaller) latency effects result in larger (smaller) pricing differentials. That is, latency creates a dynamic pricing wedge, similar to a varying transaction cost, that widens or narrows conditional on the latency differentials. From the ECM results, we also find that the speed of adjustment from long-run pricing convergence errors causes the short-run price differential to narrow, but the adjustment is only partial.
The rest of the paper is organized as follows. Section 2 provides our empirical methodology, while Section 3 provides information on our data and some descriptive statistics. Section 4 provides the core of our results starting with a VAR model of the dynamic within and across market pricing effects, to measuring where price discovery is occurring, and ending with using both regression procedures and an Error Correction model to explain pricing differential effects. Section 5 provides some concluding remarks.
2. Empirical Methodology
Our empirical strategy consists of two related parts: the first part documents and measures Amazon EC2 spot instance pricing dynamics and price discovery; the second part
6
tests and measures the extent to which latency and other factors influence pricing differentials. In the first part, we use Vector Autoregressive (VAR) models to measure the dynamics between east and west Amazon EC2 spot pricing. We then employ Hasbrouck’s (1995) and Gonzalo and Granger’s (1995) price discovery methodologies to further measure the nature of information processing across these markets. In the second part, we use OLS regressions and Error Correction models to both test and measure the extent to which latency and other factors influence the observed pricing differentials across east and west Amazon EC2 spot instance markets over time.
2.1 Pricing Dynamics and Price Discovery
2.1.1
Vector Autoregressive Models
To capture the short-term pricing dynamics between east and west Amazon EC2 spot instance pricing, we employ Vector Autoregressive (VAR) models. In its simplest form, a VAR model is composed of a system of regressions where two or more dependent variables are expressed as linear functions of their own and each other’s lagged values, as well as other potential exogenous control variables. In more technical terms, a vector autoregressive model is the unconstrained reduced form of a dynamic simultaneous equations model. An unrestricted pth-order Gaussian VAR model can be represented as:
,
...
2 2 1 1 t t p t p t tY
Y
Y
e
Y
(1)where Yt is a vector of variables, is a p x 1 vector of intercepts, 1, 2, …, p are p x p
matrices of parameters with all eigenvalues of having moduli less than one so that the VAR is stationary, and et is a vector of uncorrelated structural shocks [ NID(0,)].7 We
obtain maximum likelihood estimates of and using iterated least squares. The number of lags is chosen based on examination of the Akaike Information Criteria (AIC), Schwarz Bayesian Information Criteria (SBIC), and the likelihood ratio selection criteria for various choices of p.
In a two-equation framework consisting of only east and west pricing as endogenous variables, the diagonal coefficients of represent conditional momentum in east and west pricing, while the off-diagonal coefficients of represent conditional positive feedback and
7 A problem arises with the VAR framework if the variables in the system are non-stationary, which we test. To further capture both long- and short-run dynamics and address non-stationarity problems, we also employ Error Correction models as discussed in the next section.
7
anticipation effects (changes in west pricing following changes in east pricing and vice versa).
2.1.2 Information Shares
There are various approaches for measuring price discovery for the same good traded across markets. The fundamental approaches build on the idea that prices for the same good converge to a common efficient price in the long-run, but deviate in the short-run due to various market frictions. While Hasbrouck (1995) and Gonzalo and Granger (1995) are the two most widely accepted price discovery measures, there is some debate in the literature about how price discovery across markets should be measured and what procedures should be implemented (Lehmann 2002). Baillie et al. (2002) and De Jong (2002) argue that both the Hasbrouck and Gonzalo-Granger definitions of contribution to price discovery have their merits. Hasbrouck’s approach measures the extent of the common efficient price variation explained by the price innovation in each market. That is, it focuses on the proportional contribution of a market’s price innovation to the innovation in the common efficient price. In contrast, Gonzalo and Granger’s approach decomposes the price into a long-run permanent price and transitory components, with the price discovery weight defined as the change in the permanent component with respect to the information shock. Importantly, the results from using the Gonzalo and Granger approach differ at times from those of Hasbrouck’s (1995). Therefore, in this paper we apply both Hasbrouck’s (1995) and Gonzalo and Granger’s (1995) methodologies to the east and west Amazon EC2 spot instance pricing markets to determine the information shares generated by each market.
Both Hasbrouck’s information share model and Gonzalo and Granger’s common factor model are based on the following Vector Error Correction (VEC) model:
1
+
1+
k
t t j j t j t
P
' P
P
e
, (2)where is the error correction term. The error term et is a zero-mean vector of serially uncorrelated innovations with a covariance matrix
2 1 1 2 2 1 2 2
. 2 1
and 2 2
are the variances of e1t and e2t, is the correlation coefficient. The first term on the right-hand side of (2),
' Pt1, represents the long-run equilibrium of two price time series, while the8 second term on the right-hand side of (2),
1 k
j t j j
P
, describes short-run deviations due to imperfect market conditions.Hasbrouck converts the VEC model to obtain a vector moving average representation, which is Pt ( )L et and t
s=1
(1)
*( )
t s t
P
e
L e
. As discussed inHasbrouck (1995), the long-run impact of a disturbance on each of the prices is intuitively given by (1). The row differences of this coefficient matrix are then checked. If the
differences are all less than 0.001, we consider the rows of (1) to be identical and use only
the first row of the coefficient matrix. We use to denote the first row vector in(1),
1 2 ( , )
. Thus, t s=1( )
* t s tP
l
e
L e
, wherel
(1 1)'
,
. Hasbrouck defines
et as the common factor component of two market prices with variance
'
. When e1t and e2t are uncorrelated, the information share of the jth market is2 2 j j j
IS
'
,j
1, 2
. When e1t and 2te are correlated, Cholesky factorization is used to remove the error caused by the correlation. In this case, the information share of the jth market is
2
([
] )
j jM
IS
'
, where 1 11 2 1/2 12 22 2 20
(1
)
,
m ,
M
m ,m
,
. Since the Cholesky factorization is sensitive toordering of the variables, we estimate the upper and lower bounds for each of the markets using both possible order permutations of the east and west Amazon EC2 prices. We use intra-day five minute intervals to estimate daily information shares.8 For each market, the
average information share for the period is calculated as the mean of its upper and lower bounds.
The first several steps of the Gonzalo-Granger information model are similar to Hasbrouck’s information shares approach. We again use intra-day five minute intervals to estimate daily market price discovery shares. The east and west prices, p1 and p2, are then “shocked” with a unit impulse. We estimate a VEC model using 20 lags:
1 1 1 1 1 ... 20 20
t t t t t t
p
p A p A p A p e , (3)
9
where
(
1, 2) is the speed of price correction when the price in one market deviates from that in the other market. The Gonzalo–Granger price discovery measures for p1 and2
p are defined as: 2
1 1 2 GG
, and 2 1 1 2 GG
. 2.2 Pricing Differentials2.2.1 OLS Regressions and
Error Correction Models
We first use various OLS regression specifications to test for the influence of latency and other factors on the pricing differentials across east and west Amazon EC2 spot instance pricing over time.9 In particular, we employ the following intra-day pricing
differential regression models:
, 3 2 1 0 t Central t West t East t t DL DL DL PD (4) , 7 1 3 2 1 0 i t i di Central t West t East t t DL DL DL D PD
(5) , _ 18 1 0 it t i i t DL City PD
(6) , _ 7 1 18 1 0 i t i di it i i t DL City D PD
(7) where East t West t t P PPD is the pricing differential between west and east Amazon EC2 spot instance pricing at time t, East
t
DL , DLWestt ,and DLCentralt are corresponding average regional latency differences at time t, DL_Cityit are corresponding average city level latency
differences at time t, and Di are various event indicator variables (i.e., introductions of new
Amazon computing instances, locations, and reserved pricing changes). We include all three regions or all eighteen cities of the Internet backbone in our base regression estimates and
9 If the price level series are stationary, the OLS model is appropriate. In general, a series is non-stationary if its mean, autocovariances, or other higher moments are time dependent. For example, if the mean of a series varies with respect to time, it is likely to be non-stationary. The problem is that if a series is non-stationary, then simple time-series techniques can result in misleading (or spurious) values of inferential statistics (e.g., t-statistics, R2 and DW) of a type that will cause one to erroneously conclude that a meaningful relation exists among the regression variables. Simply stated, the test for a unit root (non-stationarity) in a time series is the test that a regression of a series on itself lagged one period yields a coefficient of one. This test is complicated by several features arising from the non-stationarity of the series under the null hypothesis.
10
therefore suppress the constant,
0, to avoid singularity problems – particularly those associated with event indicator variables that span a large portion of the sample period.To capture both long-run and short-run Amazon EC2 pricing dynamics, we employ an Error Correction Model (ECM). The ECM framework allows us to model the east and west pricing relations as an adjustment process around long-run equilibrium values. Error correction models are based on the idea that two or more time series exhibit a long-run time-varying equilibrium to which the system tends to converge. This long-term convergence in pricing is an appealing assumption given that long-run pricing in both the east and west should be similar or users would shift their computing to the lower priced market. The long-run influence in the ECM is achieved through negative feedback and error correction, and this influence measures the degree to which long-run equilibrium forces drive short-run price dynamics.
Following the Engle-Granger two-step method, a long-run price model is specified in levels. The second-stage, short-run, adjustment model is specified in first differences and includes a long-run error correction term from the estimation of the long-run, equilibrium model. In the first-stage, theory and econometric evidence are used to determine if the east and west Amazon EC2 spot instance price series contain unit roots and are cointegrated. If the pricing series are cointegrated, a long-run equilibrium relation (i.e., a cointegrating regression) can be specified in levels as:
, 1 0 t East t West t P P (8) where West t P and East t
P are the Amazon EC2 spot instance price levels in the west and east, respectively. From this regression, we can estimate residuals as the differences between the actual and estimated equilibrium values of the price levels. If the residuals from equation (8) are stationary, they may be used as an error correction term in the short-run price difference model as follows:
, 1 1 0 it t t n i i t X PD
(9) where East t West t t P PPD is the pricing differential between west and east Amazon EC2 spot instance pricing in time t, ∆Xit are first differences of the explanatory variables (i.e.,
differences in latency in time t),
ˆt1 is the error correction term (i.e., the lagged residuals from the long-run cointegrating regression), and all of the difference terms are stationary.11
Estimation of equation (9) provides evidence on short-run pricing dynamics related to latency differentials (the αi’s) and adjustments to the previous disequilibrium in the
long-run relation, (the speed of adjustment parameter).
3. Data and Descriptive Statistics
3.1 Amazon EC2 Spot Instance Pricing Data
We use Amazon EC2 east and west spot instance intra-day pricing data over the April 9, 2010 to May 22, 2011 sample period. We collect these incurred transaction interval pricing data from Amazon’s API, which provides these data for five regions, six instance types, six computing capacities, and two Operating System (OS) platforms.10 In our primary
analysis, we use standard m1.xlarge spot instance prices across the east and west U.S. regions for both Windows and Linux/Unix operating platforms.11 Our results are robust to
alternative instance types.12 The east and west U.S. regions are chosen to keep the pricing
analysis within one country, and the time-stamped price data across the two regions are synchronized to a unified GMT. The begin and end dates of our sample period correspond to the availability of the latency data for our analysis. For our analysis, we also convert the
10 The Amazon EC2 spot price instance regions are the U.S. East (Virginia, 08/2006), U.S. West (N. California, 12/2009), Europe (Ireland, 12/2008), Asia Pacific (Singapore, 04/2010) and Asia Pacific (Tokyo, 03/2011). The instance types are Standard, Micro, High-memory, High-CPU, Cluster Compute, Cluster GPU, while the computing capacities are small, medium, large, xlarge, 2xlarge, 4xlarge. The OS platforms are Windows, Linux/Unix. See http://aws.amazon.com/ec2/instance-types/. 11 Each instance has a type describing its computational resources as follows: m1.small, m1.large and m1.xlarge, respectively denote small, large, and extra-large “standard” instances; m2.xlarge, m2.2xlarge, and m2.4xlarge respectively denote extra-large, double extra-large, and quadruple extra-large “high memory” instances; and c1.medium and c1.xlarge respectively denote medium and extra-large “high CPU” instances. For each progression, the computational resources are scaled up by a factor of 2. For example, the standard xlarge instance (API name: m1.xlarge) features are: 15 GB memory, 8 EC2 Compute Units (4 virtual cores with 2 EC2 Compute Units each), 1,690 GB instance storage, 64-bit platform, I/O Performance: High, EBS-Optimized Available: 1000 Mbps. These computational resources are twice as large as the m1.large instance. An instance is purchased within a geographical region. We use data from Amazon’s two U.S. EC2 regions: east and US-west, which correspond to Amazon’s data centers in Virginia and California.
12 Standard instances are well suited for most applications. Micro instances (t1.micro) provide a small amount of consistent CPU resources and are well suited for lower throughput applications and web sites that require additional compute cycles periodically. High-Memory instances offer large memory sizes for high throughput applications, including database and memory caching applications. High-CPU instances have proportionally more CPU resources than memory (RAM) and are well suited for compute-intensive applications. Cluster Compute instances provide proportionally high CPU resources with increased network performance and are well suited for High Performance Compute (HPC) applications and other demanding network-bound applications. Cluster GPU instances provide general-purpose graphics processing units (GPUs) with proportionally high CPU and increased network performance for applications benefitting from highly parallelized processing.
12
incurred transaction interval data (both price and latency) to an hourly frequency by interpolating them in between incurred transaction prices with the most recent incurred transaction price. This allows us to time match both our price series as well as our latency time series. Our results are robust to alternative timing frequencies.
3.2 Latency Data
The latency data are collected from CloudSleuth.com over the April 9, 2010 to May 22, 2011 sample period. CloudSleuth records and compares the performance of PaaS and IaaS providers from around the world. They use the Gomez Performance Network (GPN) to measure the performance of an identical sample application running on several popular cloud service providers, which is how well the sample application performs over time from Internet backbone locations around the globe. Throughout each day at approximately thirty minute to one hour intervals and from many backbone nodes, CloudSleuth monitors the response time the total time elapsed while downloading both web pages in the multi-step test transaction. The latency data that we obtain correspond to the measured latency between 18 backbone nodes from cities throughout the US to Amazon EC2 US-west and US-east. Similar to the spot pricing data, the time-stamped latency data are synchronized to a unified GMT, and we also convert the measured latency interval data to an hourly frequency by interpolating the in-between latency measures with the most recent measured latency. This again enables us to time match both our price series as well as our latency time series.
In our analysis, we use city-level (i.e., 18 nodes) latency data. We also aggregate the city-level latency data into three regions as follows:
East = average (Newark + Atlanta + Boston +NY + Philadelphia + DC + Reston) West = average (San Jose + Mesa + Denver + LA +San Diego + Seattle)
Central = average (Dallas + Houston +Kansas City + St. Louis + Chicago)
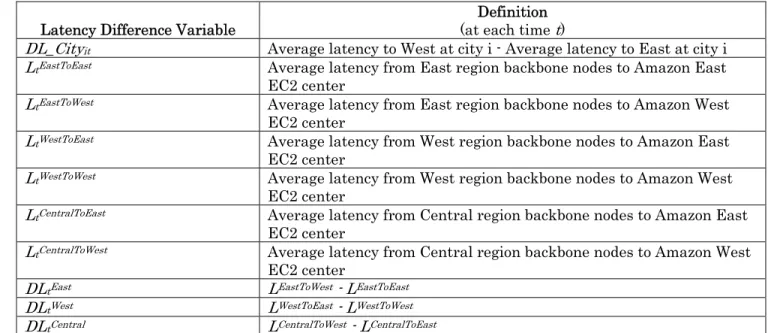
Since the spot instance pricing differentials across the east and west markets should be related to latency differentials across these markets, we create the following latency difference variables:
13
Latency Difference Variable (at each time t) Definition
DL_Cityit Average latency to West at city i - Average latency to East at city i
LtEastToEast Average latency from East region backbone nodes to Amazon East
EC2 center
LtEastToWest Average latency from East region backbone nodes to Amazon West
EC2 center
LtWestToEast Average latency from West region backbone nodes to Amazon East
EC2 center
LtWestToWest Average latency from West region backbone nodes to Amazon West
EC2 center
LtCentralToEast Average latency from Central region backbone nodes to Amazon East
EC2 center
LtCentralToWest Average latency from Central region backbone nodes to Amazon West
EC2 center
DLtEast LEastToWest - LEastToEast
DLtWest LWestToEast - LWestToWest
DLtCentral LCentralToWest - LCentralToEast
3.3 Control Indicator Variables
As additional control variables, we create a series of indicator variables corresponding to a series of Amazon EC2 events that might influence the spot instance pricing dynamics. In particular, we create the following indicator variables that take on a value of one at their begin event dates and zero otherwise:
Micro: Micro instances announced (September 9, 2010)
Singapore: Asia Pacific Region (Singapore) announced (April 29, 2010)13
CC: Cluster Compute instances (Linux Only) announced (July 13, 2010)
Free: AWS Free Usage Tier introduced (October 21, 2010)
CG: Cluster GPU instances announced (November 15, 2010)
Reduced: m2.2xlarge and m2.4xlarge on-demand reserved price reduced (September 1, 2010)
Tokyo: Asia Pacific Region (Tokyo) announced (March 2, 2011) 3.4 Descriptive Statistics
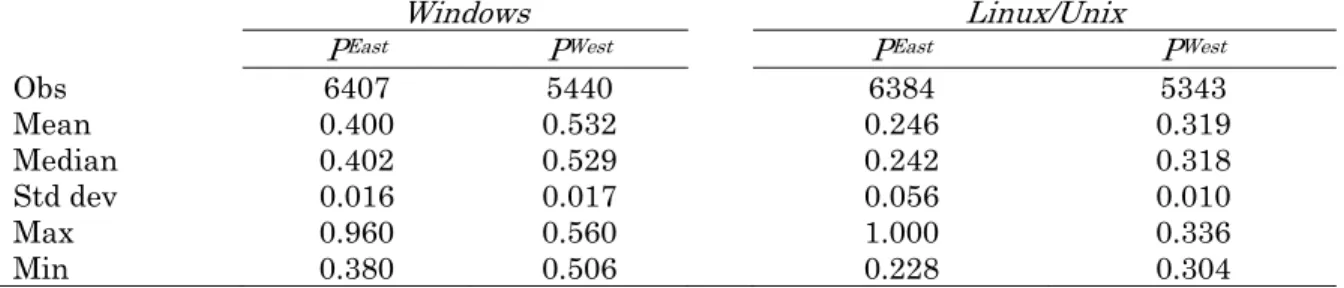
Table 1 provides summary statistics for the Amazon EC2 standard xlarge intra-day spot instance price data on Windows and Linux/Unix platforms from April 9, 2010 to May 22, 2011. PEast corresponds to the intra-day spot prices at the US east region, while PWest
13Note that the Singapore indicator variable spans a large portion of the sample period, but its
inclusion is not problematic as the constant is suppressed to avoid singularity problems. In effect, the Singapore indicator is a constant.
14
corresponds to the spot prices at the US west region. Both are measured in $ per hour. The mean, median, standard deviation, max, min, and correlation matrix are given for each series. Panel A provides descriptive statistics on the prices at their incurred transactions, while Panel B provides descriptive statistics on spot prices at 60 minute intervals.
Looking at the results in Panel A of Table 1, we find that the average and median prices at their incurred transaction intervals across both the Windows and Linux/Unix platforms are higher in the west relative to the east over our sample period. The average price differences are 0.132 $ per hour for the Windows platform and 0.073 $ per hour for the Linux/Unix platform. Looking across the OS platforms, we also find that the Linux/Unix prices are lower than the Windows platform prices. For the Windows platform, the standard deviation is higher for the west relative to the east at 0.017 versus 0.016. However, there is substantially more price variation using the Linux/Unix platform, and especially so for east prices where we document a standard deviation of 0.056 and 0.010 for the east and west, respectively.
In Panel B of Table 1 we report the spot instance prices for standard X-Large at 60 minute intervals. The mean, median, and standard deviations of the 60 minute interval prices are nearly identical to the incurred level prices, indicating that the distribution of the incurred and 60 minute interval prices are very similar. The 60 minute interval prices also allow us to examine the correlation of the aligned prices. Interestingly, the contemporaneous intra-day east and west price correlations across both OS platforms are not different from zero.14 Our documented east and west pricing differences coupled with
their insignificant correlations provides some preliminary unconditional evidence suggesting that there may be some persistence in the pricing differentials across these markets.
To examine the time varying characteristics of the pricing differentials, we provide a time series plots of the west minus east pricing differentials for the Windows platform in Panel A of Figure 1 and for the Linux/Unix platform in Panel B. Given the high frequency of the data, we plot the pricing differentials at the average weekly level (using daily averages based on the intra-day 60 minute interval prices) for depiction purposes. In both panels of Figure 1, we can see that there is indeed a persistence in the pricing differential whereby west price are consistently higher than east prices over time across both OS
14 These results are robust across a range of time pricing intervals, including from 1, 5, 10, and 15 minute time intervals.
15
platforms. Furthermore, the plots show that there is significant time variation in the pricing differentials. These results suggest that there is a dynamic relation in the pricing differentials, which we address in our conditional analysis.
4. Results
4.1 The Dynamic Relations between East and West Prices using a Bivariate VAR Model The descriptive statistics and price differential figures suggest that east and west prices vary over time. To examine these pricing dynamics, we use a bivariate VAR model to test the price relations within and across the east and west markets. Table 2 provides results from the estimation of the bivariate VAR model using the 60 minute interval data and five lags as suggested by the Akaike Information Criteria (AIC), Schwarz Bayesian Information Criteria (SBIC), and the likelihood ratio selection criteria for various lag choices.
The results in Table 2 show that the autoregressive component within each market is highly significant, but the cross market effects are largely muted. These results are consistent with our reported low contemporaneous correlations of the east and west prices. In particular, looking at the Windows platform results, we find that prices in the east are significantly related to prior east prices at a largely decreasing rate for up to four hours. At the same time, the east prices are weakly related to west prices – except at the five hour lag where we find a significant effect at the 3% level. Turning to the west prices with the Windows platform, we again find a significant diminishing autoregressive effect of lagged west prices influencing current west prices. However, we do not find evidence of a significant relation between lagged east prices influencing west prices using the Windows platform.
In the right panel of Table 2, we report the bivariate VAR results between east and west prices using the Linux/Unix OS platform. We again find a significant relation between current and lagged east prices for up to four hours at a largely diminishing rate over time. However, unlike the Windows platform results, we find that lagged west prices have a significant influence on east prices within one hour and also at higher level lags. Similarly, for the west prices under the Linux/Unix platform, we find a significant effect of lagged west prices on current west prices. However, here again in contrast to the Windows platform results, we find that lagged east prices have a significant influence on west prices as shown by the two hour lag effect of east prices on current west prices. The fit of the west
16
price market as measured by the adjusted R2 is also significantly higher relative to the
other price fits.
Taken together, our bivariate VAR results suggest that there are significant dynamic pricing relations both within and across the east and west markets. The within-market effect is larger than the across-within-market effect, but there are also significantly pronounced across-market pricing effects.
4.2 Price Discovery in East and West Markets using Information Shares
To better understand the dynamic nature of price discovery across the east and west markets, we use both Hasbrouck’s (1995) and Gonzalo and Granger’s (1995) methodologies to estimate the relative information shares across these two markets. In Table 3, we provide descriptive statistics on the relative price discovery across the east and west markets for both OS platforms. Panel A provides the means, medians, and standard deviations of daily Hasbrouck information shares over our sample period, while Panel B provides the same descriptive statistics for our estimated daily Gonzalo-Granger information shares.
Looking first at the Hasbrouck information share results in Panel A of Table 3, we find that a large portion of the relative price discovery occurs in the east market relative to the west market. The average daily information shares using the Windows platform prices are 78.8% in the east and 21.2% in the west. In comparison, the Linux/Unix platform results in the right panel also indicate that a large portion of the information processing occurs in the east market at an average of 72.3% and 27.7% for the west market. The median results further confirm that a large portion of the relative price discovery occurs in the east market relative to the west.
In Panel B of Table 3, we provide descriptive statistics on the daily information shares using the Gonzalo-Granger methodology. Consistent with the Hasbrouck information share results, we again find that the east market has greater price information processing relative to the west. The average daily price information shares are 70.9% in the east and 29.1% in the west for the Windows OS, and 78.9% and 21.1% for the east and west price information shares, respectively, using the Linux/Unix OS. The median price information share results also suggest that the east price information processing is larger than the west across both OS platforms.
17
Overall, the information share results using both Hasbrouk’s and Gonzalo-Granger and across both OS platforms suggest that a large portion of the relative price discovery occurs in the east market, which also has persistently lower price than the west market. 4.3 Latency and East versus West Price Differences
4.3.1 Price Difference Regressions
The earlier reported descriptive statistics and price differential figures suggest that east and west prices vary over time, while our VAR model results suggest that there are significant within and across market pricing dynamics. The information shares further suggest that a larger portion of price discovery occurs in the east market relative to the west market. We argue that a key determinant of the pricing differentials over time is latency differences. To test this hypothesis, we use regression procedures whereby we regress latency differences and various event indicators on the differences in prices between the west and east markets. In particular, we estimate four different regression models as represented by equations (4)-(7).
Table 4 provides a description of the variables that we use in the regression analysis. We use both city level latency differential measures and regional latency differential measures derived from the city measures. We also use a series of Amazon event indicator explanatory variables. The intraday summary statistics associated with the regional latency differential variables are shown in Table 5 at 60 minute intervals. We find that the east latency differential is on average smaller than the west latency differential. The median results further confirm that the east latency differentials are smaller than the west latency differentials. Both the standard deviations and range suggest that there is some substantial variability in the latency differentials over time. The central latency differentials are the smallest of the regional latency differentials by design in that they are more centrally located between the east and west markets and hence the latency differential results in a smaller latency difference. Also as expected, there is a negative correlation between the east and west latency differentials.
As additional motivation, in Figure 2 Panels A and B we plot the pricing differentials along with the east and west latency differentials aggregated at the weekly level for graphical purposes. In Panel A, we report the Windows platform pricing differentials, while in Panel B we report the Linux/Unix platform pricing differentials. From both panels in Figure 2, we see that there is significant time variation in the latency differentials and that the pattern of the latency differentials and pricing differentials is
18
similar over time. In many cases, the pricing differentials are also bounded by the latency differentials. To further examine and test the relation between the pricing and latency differentials, we use regression procedures with various model specifications.
Table 6 provides the results from estimating our four different regression specifications across the Windows and Linux/Unix platforms. These two panels show the results of regressing the price differentials on latency differentials and various event indicator variables. The left panel of the table contains the regression results using the Windows platform, while the right panel contains the results using the Linux/Unix platform. For Model 1, we include the regional latency differentials in the regression specification, while for Model 2 we augment the regional latency differentials with the event indicator variables. Model 3 uses city-level latency differentials, while Model 4 augments the city-level latency differentials with the event indicator variables.
The results in Table 6 show that latency differentials have a significant effect on the pricing differential.15 For Model 1, we find that both the east and west latency differentials
have a significantly positive effect on the pricing differential, suggesting that larger (smaller) latency effects result in larger (smaller) pricing differentials. That is, latency creates a dynamic pricing wedge, similar to a varying transaction cost, that widens or narrows conditional on the latency differentials. While significant, the central latency differential has a much more muted effect (less than one-tenth the size) on the pricing differential as expected given the relative distances and consequent latencies, though it has an unexpected negative effect.
In Model 2 under the Windows platform where we now include the event indicator variables, we again find that the east and west latency differentials have a significantly positive effect on the pricing differential. The central latency differential is again also much more muted in its impact, but it is now only marginally significant at the 10% level. Interestingly, the introduction of a reduction in the m2 2x and 4x large on demand reserved prices has a negative effect on the pricing differentials as does the later introduction of the Tokyo Asia Pacific region. In contrast, the earlier introduction of the Singapore Asia Pacific region has a positive effect on the pricing differential.16
15 We also run reverse causality regressions and find no evidence consistent with pricing dynamics influencing latency.
16 As additional robustness checks, we include various additional variables in our specifications. Our results are robust to their inclusion. In particular, including Amazon EC2 East center’s failure on
19
Models (3) and (4) provide the results using the city-level latency differentials and augmented model with event indicator variables. Recall that the city-level latency differentials are measured as the average latency to west at cityi minus the average latency
to east at cityi. As expected, across both models (3) and (4) we find that the city-level
latency differentials have a significant effect on the pricing differentials. The positive signs on the eastern city differentials are as expected as are the negative signs on the western city differentials given how we define the city-level latency differentials. That is, the western cities will have lower latencies to the west by design given their location, resulting in a negative latency differential given the larger latency to the east. The interpretation of the negative latency differential on the price differential defined as PWest-PEast in this case
would result in an inverse relation. As expected, several of the central city latency differentials do not have a significant effect on the pricing differential given that their latencies are often similar to the west and east markets. In Model (4) augmented with the event indicator variables, we again find that the introduction of Tokyo and Singapore results in negative and positive price differential effects, respectively. However, the reduced indicator event is no longer significant when the city-level latency differentials are used.
The Linux/Unix platform results are reported in the right side panel of Table 6. Similar to the Windows platform results, we again find that latency differentials have a significant effect on the pricing differentials for both the differential latencies measured at the regional or city-level. The indicator event effects are also very similar to those discussed for the Windows platform results, with the only exception that the Tokyo introduction does not have a significant effect across any of our model specifications with the Linux/Unix platform.
4.3.2 Short and Long Run Price Differential Dynamics: Error Correction Models
To capture both long-run and short-run pricing dynamics, we also employ an Error Correction Model (ECM). The ECM model is appropriate if the series are non-stationary and cointegrated. Unit root tests suggest that the Windows east and west prices are non-stationary at the 10% significance level and are cointegrated. The ECM framework allows us to model the east and west pricing relations as an adjustment process around their long-run equilibrium price convergence. Error correction models are based on the idea that two April 21st, 2011 does not alter our results -- the event is not statistically significant in our estimates. If we include a lagged dependent variable in our specifications, we again obtain similar results.
20
or more time series exhibit a long-run time-varying equilibrium to which the system tends to converge. This long-term convergence in pricing is an appealing assumption given that long-run pricing in both the east and west should be similar or users would shift their computing to the lower priced market through negative feedback and error correction, with the latency differential playing an important role in the potential pricing convergence.
Following the Engle-Granger two-step method, we specify a long-run price model in levels. In the short-run second stage adjustment model, the variables are specified as first differences and include the residuals from the first stage model as an error correction term. Table 7 reports the results from estimating the ECM model using the Windows platform instance prices. In Panel A, we find that east prices have a positive long-run relation on west prices, though the standard errors of the equilibrium estimate are large. In Panel B, we find that lagged price differentials have a positive and significant influence on current price differentials, suggesting some persistence in the pricing differentials. We also find that the east and west latency differentials continue to have a positive and significant influence on the pricing differentials. This suggests that latency plays an important role in the short-run pricing dynamics across the east and west markets. Looking at the error correction term, lagres, we find that the speed of adjustment parameter is both significant and negative, suggesting that a wider disequilibrium (i.e., larger errors) from the long-run price convergence cause the short-run price differential to narrow, but the adjustment is only partial at -0.544.
5. Conclusion
We address three key questions in this paper. First, what are the stylized pricing dynamics for Amazon EC2 spot instance pricing both within and across east and west market regions? Second, what explains the observed pricing dynamics and pricing differentials across the east and west markets? Third, what effect does latency (and other potential event indicators) have on the across-market pricing differentials? To address these questions, we use various econometric modeling approaches and intra-day Amazon EC2 spot instance pricing data as well as intra-day latency data over the April 9, 2010 to May 22, 2011 sample period.
In addressing the first question, we document that across Windows and Linux/Unix OS platforms as well as spot instance types, there is considerable time variation in spot prices. We also find that prices in the west are often persistently greater than prices in the
21
east over our sample period. Results from using a bivariate VAR model of east and west spot instance prices suggests that there are significant dynamic pricing relations both within and across the east and west markets. We find that the within-market autoregressive pricing effect is larger than the across-market effect, but there are also significantly pronounced across-market pricing effects. Using both Hasbrouk’s (1995) and Gonzalo and Granger’s (1995) price discovery methodologies, we also find that a large portion of the relative price discovery (over 70%) occurs in the east market relative to the west market.
To explain the observed time varying pricing differentials across the east and west markets (i.e., addressing our second and third questions), we use both regression procedures and an Error Correction Model (ECM). We find that both the east and west latency differentials have a significantly positive effect on the pricing differentials. These results suggest that larger (smaller) latency effects result in larger (smaller) pricing differentials. Similar to a time varying transaction cost band, latency creates a dynamic pricing wedge that widens or narrows conditional on the latency differentials. From the ECM results, we also find that the speed of adjustment from long-run pricing convergence errors causes the short-run price differential to narrow, but the adjustment is only partial.
The results from our paper can be viewed in a broader context and also provide a framework for some additional follow-on research questions. From a broader context, our research provides some further evidence and insights into market-based pricing dynamics and market efficiency issues in a burgeoning new market with unique characteristics, including latency effects. Although markets have become increasingly integrated due to technological innovations and reductions in barriers across markets, several studies show that geographical distance still matters in behavioral, economic, and financial outcomes. These studies establish the relevance of geographical proximity to consumer’s costs of acquiring information, which in turn influences the behavior of both consumers and firms.
The effects of distance manifest themselves through higher search costs often related to information acquisition problems (e.g., degree of information asymmetry and uncertainty as well as other information and market impediments) and behavioral biases (e.g., anchoring and loss aversion). Both higher search costs and behavioral biases may lead to the payment of higher prices for a given good. In this regard, our research on latency effects provides some evidence consistent with the role of market impediments playing a fundamental role in the cloud pricing dynamics. At the same time, consumers may suffer
22
from behavioral biases which may cause them to “anchor” their expectations on local or personal circumstances and prior decisions. Further research on understanding the nature of these potential factors in the pricing dynamics of cloud computing could yield some additional interesting insights.
23
References
Baillie, R. T., G. Geoffrey Booth, Y. Tse, T. Zabotina. 2002. Price discovery and common factor models. J. Finance Markets5(3) 309-321.
Bapna, R., S. Das, R. Garfinkel, J. Stallaert. 2008. A market design for grid computing. INFORMS J.
Comput.20(1) 100-111.
Bapna, R., S. Das, R. Day, R. Garfinkel, J. Stallaert. 2011. A clock-and-offer auction market for grid resources when bidders face stochastic computational needs. INFORMS J. Comput. 23(4) 630-647.
Brynjolfsson, E., Y. J. Hu, M. S. Rahman. 2009. Battle of the retail channels: How product selection and geography drive cross-channel competition. Management Sci.55(11) 1755-1765.
Brynjolfsson, E., M. D. Smith. 2000. Frictionless commerce? A comparison of Internet and conventional retailers. Management Sci.46(4) 563-585.
Clayton, N. 2011. Battle for Cloud Services Heats Up. Wall Street Journal, February 14, 2011. http://on.wsj.com/eyprNB.
Datta, A., K. Dutta, H. Thomas, D. VanderMeer. 2003. World Wide Wait: a study of Internet scalability and cache-based approaches to alleviate it. Management Sci.49(10) 1425-1444. Das, S., A.Y. Du, R. Gopal, R. Ramesh. 2011. Risk management and optimal pricing in online storage
grids. Information Systems Research22(4) 756-773.
De Jong, F. 2002. Measures of contributions to price discovery: a comparison. J. Finance Markets
5(3) 323-327.
Forrester Consulting. 2009. eCommerce web site performance today: an updated look at consumer reaction to a poor online shopping experience. Technical report.
Gonzalo, J., C. Granger. 1995. Estimation of common long-memory components in cointegrated systems. J. Bus. Econ. Stat.13(1) 27-35.
Hasbrouck, J. 1995. One security, many markets: Determining the contributions to price discovery. J.
Finance50(4) 1175-1199.
Hosanagar, K., R. Krishnan, J. Chuang, V. Choudhary. 2005. Pricing and resource allocation in caching services with multiple levels of quality of service. Management Sci.51(12) 1844-1859. Lehmann, B. N. 2002. Some desiderata for the measurement of price discovery across markets. J.
Finance Markets5(3) 259-276.
Marston, S., Z. Li, S. Bandyopadhyay, J. Zhang, A. Ghalsasi. 2011. Cloud computing—The business perspective. Decis. Support Sys.51(1) 176-189.
Mayer, M. 2009. In search of a better, faster, stronger web. http://bit.ly/adt3Nz. Technical report, Google Inc.
Mazzucco, M. 2010. Towards autonomic service provisioning systems. Proceedings of the 2010 10th
IEEE/ACM International Conference on Cluster, Cloud and Grid Computing, 273-282.
Mazzucco, M., M. Dumas. 2011. Achieving performance and availability guarantees with spot instances. IEEE 13th International Conference on High Performance Computing and Communications
(HPCC), 296-303.
Miller, R. B. 1968. Response time in man-computer conversational transactions. Proceedings of the December 9-11, 1968, fall joint computer conference, part I, 267-277.
Minnear, R. 2011. Latency: The Achilles Heel of Cloud Computing. Coud Comput. J.
O3b Networks. 2008. What is network latency and why does it matter? http://bit.ly/12IJ0SA. Technical report, O3b Networks, Ltd.
Plummer, D. C., D. W. Cearley, D. M. Smith. 2008. Cloud computing confusion leads to opportunity. Technical report, Gartner Inc.
Pring, B., R. H. Brown, L. Leong, F. Biscotti, A. Couture, B. Lheureux, A. Frank, J. Roster, S. Cournoyer, V. Liu. 2010. Forecast: Public Cloud Services, Worldwide and Regions, Industry Sectors, 2009-2014. Technical report, Gartner Inc.
Ried, S., H. Kisker. 2011. Sizing The Cloud – A BT Futures Report. Technical report, Forrester Research, Inc. .
24
Zhang, Q., Q. Zhu, R. Boutaba. 2011. Dynamic resource allocation for spot markets in cloud computing environments. 2011 Fourth IEEE International Conference on Utility and Cloud
25 Table 1 Summary Statistics
This table provides summary statistics for the Amazon EC2 M1 (standard) X-Large intra-day spot instance price data on Windows and Linux/Unix platforms from April 9, 2010 to May 22, 2011. PEast corresponds to the intra-day spot prices at the US east region, while PWest
corresponds to the spot prices at the US west region. Both price series are measured in $ per hour. The mean, median, standard deviation, max, min, and correlation matrix are given for each series. Panel A provides descriptive statistics on the prices at their incurred transactions, while Panel B provides descriptive statistics on spot prices at 60 minute intervals.
Panel A: Spot prices: M1 X-Large at Incurred Transaction Interval
Windows Linux/Unix
PEast PWest PEast PWest
Obs 6407 5440 6384 5343 Mean 0.400 0.532 0.246 0.319 Median 0.402 0.529 0.242 0.318 Std dev 0.016 0.017 0.056 0.010 Max 0.960 0.560 1.000 0.336 Min 0.380 0.506 0.228 0.304
Panel B: Spot Prices for M1 X-Large at 60 minute intervals
Windows Linux/Unix
PEast PWest PEast PWest
Obs 9816 9816 9816 9816 Mean 0.400 0.532 0.245 0.320 Median 0.401 0.530 0.241 0.319 Std. dev. 0.014 0.016 0.045 0.010 Max 0.960 0.560 1.000 0.336 Min 0.380 0.506 0.228 0.304 Correlation (PEast) 1.00000 0.00279 (0.7826) 1.00000 -0.00492 (0.6263) Correlation (PWest) 0.00279 (0.7826) 1.00000 -0.00492 (0.6263) 1.00000
26 Table 2
The Dynamic Relations between East and West Prices using a Bivariate VAR Model
This table presents results obtained from estimating unrestricted VAR models using Amazon EC2 M1 X-Large spot prices at 60 minute intervals over the April 9, 2010 to May 22, 2011 sample period (N = 9,816). An unrestricted pth-order Gaussian VAR model can be represented as:
, ... 2 2 1 1 t t p t p t t Y Y Y e Y
We estimate a bivariate model where the lag-length of the VAR is chosen by the AIC, SBIC, and the likelihood ratio criterion for various choices of p. We find that five periodic 60 minute lags provide the best fit. P-values are reported in parentheses.
Windows Linux/Unix
PEast PWest PEast PWest
Constant 0.319 (0.0001) (0.0001) (0.1093) 0.358 0.027 (0.0001) 0.211 PEastt-1 0.110 -0.004 0.471 -0.003 (0.0001) (0.7354) (0.0001) (0.264) PEast t-2 0.030 0.004 0.085 -0.006 (0.0028) (0.7025) (0.0001) (0.0787) PEast t-3 0.071 0.008 0.180 0.004 (0.0001) (0.4685) (0.0001) (0.2776) PEast t-4 -0.023 -0.010 0.107 0.005 (0.0229) (0.3879) (0.0001) (0.1288) PEast t-5 -0.002 -0.007 0.016 0.001 (0.8383) (0.5178) (0.1195) (0.6477) PWest t-1 0.001 0.305 -0.088 0.329 (0.9339) (0.0001) (0.0072) (0.0001) PWest t-2 0.015 -0.002 0.036 -0.009 (0.1254) (0.8861) (0.2966) (0.4184) PWest t-3 -0.013 0.042 -0.044 0.032 (0.1868) (0.0001) (0.2011) (0.0024) PWest t-4 -0.012 -0.028 0.082 -0.014 (0.2161) (0.0073) (0.0177) (0.1836) PWest t-5 0.020 0.015 0.036 0.000 (0.0265) (0.1349) (0.2725) (0.9695) Adj R2 0.020 0.096 0.109 0.581 Obs 9816 9816 9816 9816
27
Table 3
Price Discovery in East and West Markets using Information Shares
This table provides descriptive statistics for daily information shares using intra-day 5 minute pricing time intervals. Panel A provides the means, medians, and standard deviations of Hasbrouck’s daily information shares:
2 2 j j j
IS
'
, when e1t and e2t are correlated. 2([
] )
j jM
IS
'
, when e1t and e2tare uncorrelated and where 1 11 2 1/2 12 22 2 20
(1
)
,
m ,
M
m ,m
,
.Since the Cholesky factorization is sensitive to ordering of the variables, we estimate the upper and lower bounds for each of the markets using both possible order permutations of the east and west Amazon EC2 prices. For each market, the average information share for the period is calculated as the mean of its upper and lower bounds.
Panel B provides the means, medians, and standard deviations of the daily information shares using the Gonzalo-Granger model:
2 1 1 2 GG
and 1 2 1 2 GG
.For each region, we report the statistics for information shares. PEast corresponds to
the information share for the region of US East, whereas PWest corresponds to the
information share for the region of US West. The sample period is from April 9, 2010 to May 22, 2011.
Panel A. Hasbrouck’s Information Shares
Windows Linux/Unix
PEast PWest PEast PWest
Obs 409 409 409 409
Mean 0.788 0.212 0.723 0.277
Median 0.866 0.134 0.838 0.162
Std. dev. 0.222 0.222 0.298 0.298
Panel B. Gonzalo-Granger’s Information Shares
Windows Linux/Unix
PEast PWest PEast PWest
Obs 409 409 409 409
Mean 0.709 0.291 0.789 0.211
Median 0.597 0.403 0.576 0.424
28
Table 4
Description of Regression Variables used to explain the Price Differential
This table provides a description of the variables used in the regressions with price differential as the dependent variable.
PD PWest – PEast
DL_Cityit Average latency to west at city i - Average latency to east at city i
LtEastToEast Average latency from East region backbone nodes to Amazon East EC2 center
LtEastToWest Average latency from East region backbone nodes to Amazon West EC2 center
LtWestToEast Average latency from West region backbone nodes to Amazon East EC2 center
LtWestToWest Average latency from West region backbone nodes to Amazon West EC2 center
LtCentralToEast Average latency from Central region backbone nodes to Amazon East EC2 center
LtCentralToWest Average latency from Central region backbone nodes to Amazon West EC2 center
DLtEast LEastToWest - LEastToEast
DLtWest LWestToEast - LWestToWest
DLtCentral LCentralToWest - LCentralToEast
Micro Micro instances announced (September 9, 2010)
Singapore Asia Pacific Region (Singapore) announced (April 29, 2010)
CC Cluster Compute instances (Linux/Unix Only) announced (July 13, 2010) Free AWS Free Usage Tier introduced (October 21, 2010)
CG Cluster GPU instances announced (November 15, 2010)
Reduced m2.2xlarge and m2.4xlarge on-demand reserved price reduced (September 1, 2010) Tokyo Asia Pacific Region (Tokyo) announced (March 2, 2011)
In our analysis, we use city-level (i.e., 18 nodes) latency data. We also aggregate the city level latency data into three regions as follows:
East = average (Newark + Atlanta + Boston +NY + Philadelphia + DC + Reston) West = average (San Jose + Mesa + Denver + LA +San Diego + Seattle)
29
Table 5
Latency Summary Statistics
DLEast DLWest DLCentral
Obs 9816 9816 9816 Mean 4.908 6.082 0.765 Median 4.796 5.925 0.445 Std. dev. 2.286 2.675 2.970 Max 94.739 47.773 118.104 Min -21.664 -66.279 -23.651 Correlation (DLEast) 1.000 (<.0001) -0.512 (<.0001) 0.586 Correlation (DLWest) (<.0001) -0.512 1.000 (0.6263) -0.457 Correlation (DLCentral) (<.0001) 0.586 (<.0001) -0.457 1.000
30
Table 6
Price Differential Regressions
This table provides regression results of the price differentials (PWest – PEast) on the latency differentials and various
event indicator variables. The variable definitions are provided in Table 4. The regressions use intraday data measured at 60 minute intervals, and the sample period runs from is from April 9, 2010 to May 22, 2011. All estimates are multiplied by 1000.
Windows Linux/Unix
Model 1 Model 2 Model 3 Model 4 Model 1 Model 2 Model 3 Model 4
DLEast 12.770 6.420 7.480 4.000 (0.0001) (0.0001) (0.0001) (0.0001) DLWest 10.400 5.550 5.780 3.310 (0.0001) (0.0001) (0.0001) (0.0001) DLCentral -0.841 -0.273 -1.120 -0.227 (0.0001) (0.0639) (0.0001) (0.0639) East: DL_Atlanta 0.356 0.038 -0.520 -0.623 (0.0001) (0.7153) (0.0001) (0.7153) DL_Boston 0.799 0.466 0.775 0.515 (0.0001) (0.0001) (0.0001) (0.0001) DL_DC 1.250 0.586 0.687 0.355 (0.0001) (0.0001) (0.0001) (0.0001) DL_Newark 2.590 1.580 1.930 1.450 (0.0001) (0.0001) (0.0001) (0.0001) DL_NY 0.744 0.379 0.434 0.238 (0.0001) (0.0001) (0.0001) (0.0001) DL_Philly 2.830 1.710 1.660 1.150 (0.0001) (0.0001) (0.0001) (0.0001) DL_Reston 3.040 2.060 1.830 1.290 (0.0001) (0.0001) (0.0001) (0.0001) West: DL_Denver -0.372 -0.222 -0.192 -0.134 (0.0001) (0.0001) (0.0001) (0.0001) DL_LA -1.910 -1.460 -0.933 -0.642 (0.0001) (0.0001) (0.0001) (0.0001) DL_Mesa -1.300 -0.713 -0.869 -0.603 (0.0001) (0.0001) (0.0001) (0.0001) DL_SD -3.650 -2.160 -1.980 -1.260 (0.0001) (0.0001) (0.0001) (0.0001) DL_SJ -1.660 -0.878 -1.060 -0.684 (0.0001) (0.0001) (0.0001) (0.0001) DL_Seattle -1.670 -0.924 -0.878 -0.508 (0.0001) (0.0001) (0.0001) (0.0001) Central: DL_Chicago 0.509 0.545 0.063 0.361 (0.0001) (0.0001) (0.0001) (0.0001) DL_Dallas -0.017 -0.080 0.037 -0.012 (0.82) (0.3015) (0.82) (0.3015) DL_Houston 0.064 -0.069 -0.287 -0.164 (0.194) (0.1836) (0.194) (0.1836) DL_KC -0.155 -0.255 0.108 -0.092 (0.0132) (0.0001) (0.0132) (0.0001) DL_StLouis 0.623 0.441 0.366 0.447 (0.0001) (0.0001) (0.0001) (0.0001) Indicators: Micro 0.777 0.892 9.030 8.320 (0.7351) (0.6664) (0.7351) (0.6664) Singapore 70.560 54.840 26.610 15.910 (0.0001) (0.0001) (0.0001) (0.0001)
31 CC -1.450 0.304 7.680 8.020 (0.2108) (0.7488) (0.2108) (0.7488) Free -0.789 -0.315 -0.578 -0.251 (0.604) (0.8126) (0.604) (0.8126) CG 2.060 0.260 -1.830 -3.050 (0.7726) (0.3071) (0.7726) (0.3071) Reduced -4.820 -2.670 -4.280 -1.830 (0.0373) (0.2151) (0.0373) (0.2151) Tokyo -3.840 -3.390 -0.813 -0.566 (0.0001) (