Designing User Interfaces for Hidden Markets
Sven Seuken
∗School of Engineering & Applied Sciences
Harvard University, Cambridge, MA
[email protected]
Denis Charles, Max Chickering, Sidd Puri
Microsoft Live Labs
One Microsoft Way, Redmond, WA
{
cdx,dmax,siddpuri
}
@microsoft.com
Abstract
Market-based intelligent systems are becoming in-creasingly important in our everyday lives. How-ever, when the goal of these systems is not the sale or purchase of items, traditional interfaces allowing users to specify bid or ask prices are no longer ap-propriate. Thus, there is a need for different kinds of user interfaces to interact with these “hidden markets”. In this paper, we present a novel user interface for one particular market-based system: a P2P backup application. The primary goal of the UI is to hide the market from the user as much as possible. Thus, the two main design challenges are how to provide current market information to the user without using prices or account balances, and how to elicit the user’s preferences with as little in-teraction as possible. The UI described in this paper is already implemented as part of a Microsoft re-search project on P2P backup systems and an inter-nal alpha version of the software has been released. We are currently designing a usability study to eval-uate the UI empirically.
1 Introduction: Market-Based Systems
Intelligent systems are already ubiquitous in today’s world, helping users in many situations including communication, transportation, entertainment, health, etc. Eliciting users’ preferences and communicating information to the users is a core challenge for these systems to maximize the benefit they can offer. Most of the existing systems are designed for single-user scenarios where only individual preferences and actions are important. However, the Internet and most re-cently in particular the Web 2.0 has brought about distributed systems, connecting millions of users. In networked environ-ments like file-sharing systems, Facebook, Netflix, etc., each user’s preferences and actions directly or indirectly impact every other user. We predict that we will soon see more and more market-based systems emerge, when system designers realize that they must pay careful attention to economic in-centives.
∗This work was done while the author was a research intern at Microsoft Live Labs.
We already have a profound understanding of how markets work, and more recently, researchers are also getting a better understanding of how to design new markets [Roth, 2008]. However, little research has been done regarding the inter-faces via which the users interact with these markets. Many electronic market-based systems provide auction-like user in-terfaces where users must enter bid or ask prices in dollar val-ues to participate in the market. While this kind of interaction might be suitable for sophisticated users, it is not acceptable for non-expert users, in particular in environments where the participants are normally not thinking about making mone-tary transactions.
We claim that for market-based systems to become ubiq-uitous, a whole new user interface paradigm is needed that moves away from classical concepts of prices, account bal-ances, etc. These market-based systems that we are referring to can, but must not necessarily involve money. An exam-ple where money can be involved is online advertising: how many ads are acceptable to a user before he would rather pay for an equivalent, add-free service? How much would a user be willing to pay for a particular software bug to be fixed? For Web 2.0 systems where money is generally not involved, consider for example electronic recommender systems. How should we elicit a user’s willingness to provide feedback in re-turn for access to a restaurant recommendation website? How should we elicit how much of his privacy a user is willing to give up to participate in an online community? The design of good user interfaces for these kinds of environments is an important open research problem.
1.1 P2P Backup: A Market Design Problem
In this paper we concern ourselves with one particular market-based system, a peer-to-peer (P2P) backup system, and the design of a user interface to interact with the un-derlying market of this system. P2P backup systems are an attractive alternative to server-based systems because the im-mense costs of large data centers can be saved by using idle resources on millions of private computers instead. While our long-term goal is the design of an open resource exchange market using real money, here we consider a system where monetary transfers are prohibited. A user who wants to back up his data must in return supply three resources (storage space, upload and download bandwidth) to the system. Our system uses a hybrid P2P architecture where all backup data
is transferred directly between peers, but a dedicated server coordinates all operations and maintains meta-data.
Using decentralized peers to store data raises two market design challenges regardingincentivesandefficiency. For the backup system to be reliable and sustainable, it must provide proper incentives to its users. Every user must provide a cer-tain amount of all three resources, even if he currently only consumes one or two resources. For example, a user who only contributes storage space is useless to the system be-cause no files could ever be sent or received from that peer. Furthermore, it is natural that each user has different pref-erences regarding how much of each resource he wants to supply. Some users might be very constrained regarding the free space on their hard drive but might have a very fast inter-net connection. Other users might have large hard drives but use their bandwidth for many other services like VOIP, file-sharing, etc. Thus, a rigid accounting system that enforces the same resource ratios across all users is undesirable. The pro-posed P2P backup market addresses this by associating each resource with a price tag, and the relative prices reflect the relative scarcity of the resources in the system.
1.2 Research Goals & Overview of Results
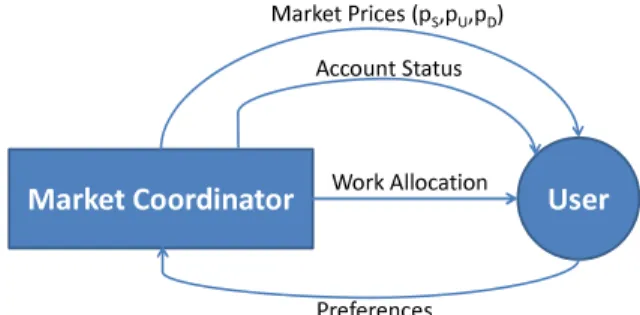
The challenge regarding the UI design for this application is that the majority of the users of a P2P backup system will be non-experts without a deep understanding of the underlying market. We adopt as our goal that ofhidden markets: the con-cept of prices and account balances must be hidden from the users as much as possible. Furthermore, with primarily non-expert users and a complex, dynamic combinatorial market, direct preference elicitation methods (e.g., auction methods) are infeasible to implement. However, there must be some kind of feedback loop between the market and the users for the market prices to play any role at all. Figure 1 displays the different tasks that the UI must achieve in our system. We need a sophisticated mechanism that elicits users’ prefer-ences regarding their resources, communicates current mar-ket prices and account balances to the users, and also contin-uously assigns work in a way that balances users’ accounts and maximizes overall efficiency.
! " # " $ ! %% ! !
Figure 1: Feedback Loop between Market and User. In this paper we describe a novel UI design that allows the user to interact with the market without specifying bid or ask prices. Instead, the user only has to move three sliders to specify how much of each resource he wants to supply. A simple pie chart showing how much more the user can back up given his current supply summarizes that user’s account.
The user can indirectly see the current prices for all resources if he observes how his resource balance changes when he ad-justs his supply settings. At this point, we only have a pre-liminary evaluation of the UI, but we are currently designing a user study which we describe briefly in Section 4.
1.3 Related Work
Fundamental to most designs of electronic markets is that participants are sophisticated users able to specify bids in an auction-like framework (e.g., [Aperjis and Johari, 2006; Laiet al., 2005]). A particularly sophisticated UI design for a complex combinatorial market is described in [Sandholm, 2007]. However, while the participants in energy markets, computational grid networks, or procurement auctions are most likely very sophisticated users, we are targeting millions of non-expert users and thus such interfaces are not practical for our environment. To the best of our knowledge, there are currently only two companies offering a P2P backup service:
Wuala and AllMyData. However, neither of those systems uses a sophisticated market design and thus we cannot learn from their user interfaces.
A very general, decision-theoretic approach towards inter-face optimization is taken by [Gajos and Weld, 2005]. How-ever, at this point it remains unclear how market interfaces could be designed automatically using their technique. Re-cently, [Morriset al., 2008] have presented MySong, an ap-plication that allows musical novices to compose new songs. They have successfully designed a user interface that lets the user interact with complicated elements of the underlying system in a very intuitive way. In [Simonet al., 2008] they de-scribe the user interface of MySong in more detail and present results from a usability study. Although this work does not concern the design of market interfaces, the approach is sim-ilar to ours, in the sense that both user interfaces are designed to hide the complexity of the underlying system.
The work that is closest to our approach is Yoop-ick, a combinatorial sports prediction market [Goel
et al., 2008]. Their implementation, available at http://apps.facebook.com/yoopick, provides a very intuitive user interface for trading on a combinatorial prediction mar-ket. They successfully hide the complexity of making bets on combinatorial outcomes by simply letting users specify point spreads via two sliders in the UI. While this is an approach in line with our paradigm, prediction markets are significantly different from the resource exchange market we consider and thus different concepts are necessary.
2 A P2P Resource Market
In this section we define the key concepts regarding the de-sign of the P2P resource market. These concepts are neces-sary to understand the particular user interface we propose.
2.1 Suppliers & Consumers
Each user in the P2P backup system is simultaneously a sup-plier and a consumer of resources. For every backup, there are multiple peers on the supplier side offering their resources and a single peer on the consumer side, needing these re-sources. A peer on the consumer side cannot simply use one supplier because unreliable storage is useless. Instead,
the production process of the server (bundling multiple peers and coordinating them) in the middle is essential. Effectively, the server turns unreliable storage into reliable storage. Note that each peer on the supplier side offers a different bundle of resources (i.e., different storage space, availability, and bandwidth limits) while each peer on the consumer side gets the same product, i.e., a backup service with the same reli-ability. Each resource (storage space, upload and download bandwidth) has a price at which it can be traded and in each transaction, the suppliers are paid for their resources and the consumers are charged for consuming services. Prices are updated regularly according to current aggregate supply and demand in the system, to bring prices into equilibrium.
2.2 Minimizing Replication: Erasure Coding
One natural concern about P2P backup systems is that indi-vidual P2P users have a much lower average availability than dedicated backup servers. Thus, a P2P system must maintain a higher file redundancy to guarantee the same file availability as server-based systems. Simply replicating the file multiple times would be very inefficient. Fortunately, we can signif-icantly reduce the replication factor by usingerasure coding
(see [Li and Zhang, 2004] for an application of erasure cod-ing to P2P storage). The erasure code splits up a file intok fragments, i.e.,F = (F1, ..., Fk), and producesn > knew
fragments, i.e., transformsFintoG= (G1, ..., Gn). Erasure
coding ensures thatanykof thenfragments are enough to reconstruct F. The ratio n
k is called thereplication factor.
For example, with an average availability of 50% we could achieve a replication factor of approx. 2.5. Thus, for every Gigabyte of data that a user wants to back up, we would need 2.5 Gigabytes of free space from the suppliers.
2.3 Operations in the Backup System
We consider the following five high-level operations: 1. Backup: When a user performs a backup, file fragments
are sent from the consumer to the suppliers.
2. Storage: The suppliers must persistently store the frag-ments they receive (until they are asked to erase them). 3. Retrieval: When a user retrieves a backup, file
frag-ments are sent from the suppliers to the consumer. 4. Repair: When the server determines a backed up file to
be unhealthy, the backup is repaired.
5. Testing: When sufficient availability information about a peer is missing, another peer backs up a file to the peer in question or retrieves a file from that peer.
Each of these operations requires a particular set of resources from the suppliers (see Table 1).
Operation Resources Required from Suppliers 1. Backup Download Bandwidth
2. Storage Space
3. Retrieval Upload Bandwidth
4. Repair Download and Upload Bandwidth 5. Testing Download and Upload Bandwidth Table 1: Operations and their Required Resources.
2.4 Currency, Trading & Work Allocation
All trades in the market are done using “virtual currency”, thus no real money is required. Trading is enabled via a cen-tralized accounting system, where the server plays the role of a bank. The server maintains an account balance for each user starting with a balance of zero and allowing each user to take on a certain maximal deficit. In every trade, consumers pay credits to the server and the server pays credits to the suppliers. The primary purpose of the virtual currency is to allow users to do work at different points in time while main-taining fairness. Users have a steady inflow (from supplying resources) and outflow (from consuming services) of money which can vary over time. In steady state, when a user has been online sufficiently long, his flow consumption of backup services must be balanced by his flow provision of resources. However, when a users goes offline for a few days, he cannot earn money during that period but he still has to pay for his backed up files. Thus, his account balance will continuously decrease during that time period. Once the user reaches the maximum deficit level, he will not be allowed to make further backups before his balance increases again.
The server is involved in every operation and stores all rel-evant meta data for each file. For the backup, retrieval, testing and repair operations, the server either directly chooses which peers act as suppliers or sends a list of potential suppliers. Thus, the server has significant influence on how the work is allocated in the system. In the current implementation, the server chooses suppliers based on their account balance. In particular, the server allocates work to those users with the lowest account balance to drive all accounts (back) to zero over time. This is possible because the user’s steady-state income must equal his expenditure. Thus, when a user has been online for a sufficiently long time, his account should be close to zero. One important implication for the user interface is that it is not necessary to show the user his account balance because it will normally be close to zero anyways.
2.5 Resources, Services & Prices
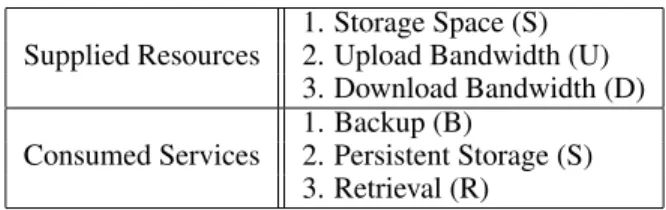
It is important to understand the distinction between the three resources that must be supplied (storage space, upload and download bandwidth) and the three services that can be con-sumed (backup operation, storage, retrieval operation). Table 2 provides an overview and denotes the abbreviations we use.
Supplied Resources 1. Storage Space (S)2. Upload Bandwidth (U) 3. Download Bandwidth (D) Consumed Services 1. Backup (B)2. Persistent Storage (S)
3. Retrieval (R) Table 2: Resources vs. Services.
At first sight, it might be confusing that we did not list the user’s online time, i.e., his availability ai, as a separate
re-source. Note that suppliers are paid for their bandwidth per fragment they send or receive independent of how often they are online. However, their availability matters a lot for the payments they receive for the supplied storage space.
Obvi-ously, the higher a user’s online time, the more useful is his supplied space, and the more will he be paid per fragment stored. In practice, the relationship between availability and payments is non-linear, however, the general idea is that a user gets paid for his “effective space supply” which is the product of the space he supplies and his availability. For ex-ample, a user who is online 50% of the time and supplies
30GB of space has an effective storage supply of15GB and that’s what he is paid for. To simplify notation we will letsiS
denote user i’s effective storage supply. Together with the supplied upload bandwidthsiU and the download bandwidth
siD this defines a user’s supply vectorsi = (siS, siU, siD).
Using analogous notation we let di = (diB, diS, diR)
de-note the service consumption vector of useri. We use lin-ear prices for the resources and services in the system. We let p = (pS, pU, pD) denote the price vector for supplied
resources and q = (qB, qS, qR)denote the price vector for
consumed services. Remember that in steady state (when the user is online and his account balance is close to zero), a user must be able to pay for his consumption with his supply. We can now express thisincome/expenditure flow constraint
more formally using prices and the user’s supply and demand. In steady state we require that:si·p=di·q.
2.6 The User Model
Naturally, each user has an endowment of the resources space, upload and download bandwidth. Any UI for the P2P backup system must give the user the option to spec-ify the maximum supply he is willing to give up. We let Si = (SiS, SiU, SiD) denote the maximum supply vector
chosen by useriand we letDi = (DiB, DiS, DiR)denote
the maximum amount of online backup space that userican consume. GivenSi, the flow-constraintSi·p= Di·q
au-tomatically determines Di. We assume that when the user
sets the maximum supply vector Si, he is forward-looking,
i.e., he is planning for demandDi in the future. In practice
this means the user sets his supply such that he can continue using the backup software for a certain time period without running out of online backup space and thus without having to adjust the supply settings again. For every target amount of servicesDithere are many different combinations of
sup-plied resources that will allow the user to consumeDi, and
different users might choose different trade-offs according to their preferences. Formally, each userihas a preference rela-tionºiover the six-tuple(SiS, SiU, SiD, DiB, DiS, DiR).
3 User Interface Design
The UI is an essential aspect of the market design be-cause it defines the information flow between the user and the market. The two main questions are how the server learns about a user’s individual preferences and how the user sees/experiences the current market prices.
3.1 User-Friendly Preference Elicitation
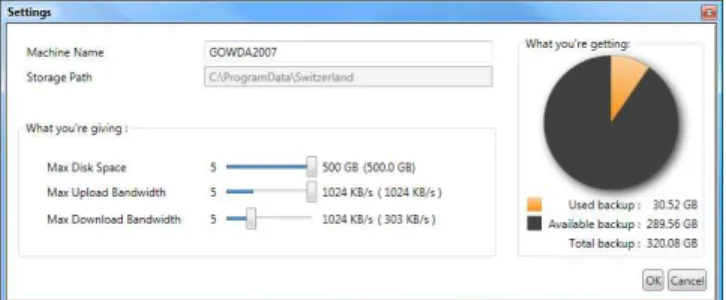
Figure 3 displays the first implementation of the UI, a “set-tings window” that a user can open to interact with the mar-ket. This window has two areas: on the left side, the user can control his resource supply and on the right side, the user sees his “resource balance” (i.e., the pie chart) showing him
infor-Figure 2: Screenshot of the Market User Interface. mation about his consumption. On the left, for each of his resources, the user can set a maximum cap for that resource by moving the sliders to specify how much of that resource the system should maximally use. The software will never use more of any resource than the user specifies via the slid-ers. The maximum value for these sliders should be deter-mined automatically. The upper limit for space is simply the free space on the user’s hard drive; the maximum bandwidth limits could be determined via speed tests.
When the user moves the sliders, his resource balance on the right changes simultaneously. The resource balance is determined by two numbers: 1) the user’s current usage of online backup storage and 2) the additional backup storage space available to that user. The first number is simply the amount of data the user has backed up. The second value is effectively a prediction regarding how much more data the user could backup before hitting his resource caps. Here, we make use of the income/expenditure flow contraint again. Thus, by looking at the ratio of his current supply vectorsand his maximum supply vectorS, we can determine how much more he could consume. Here is a simplified mathematical expression for how the resource balance is calculated:
Maximum Income=p·S Current Income=p·s
Total Backup=Used Backup·Maximum Income
Current Income Note that this expression is only correct if the user’s resource balance equals zero and it also assumes that the maximal sup-ply vectorSis within the resource ratios (see Section 3.3).
Another interesting aspect of this UI is that the resource balance aggregates all three services (backup, storage, re-trieval) into one service called “online backup space”. This is another design decision with the goal to hide the market complexities from the user as much as possible. However, this also assumes that the user’s past behavior regarding the frequency of backup, deletion and retrieval operations is a reasonably good predictor of his future behavior.
3.2 “Experiencing” Prices in the UI
We argue that the proposed UI allows users to express their preferences sufficiently well. For example, if the user wants to have a total available backup space of 100GB, there are different slider settings that will allow this. Some users might specify to give more space and less bandwidth, others might specify it the other way around, depending on the resources they have available and their individual preferences.
! "# $ %&'()* +,-./-0 1 2 3456 7 89 3:; <= 567 89>;? @7 A BC=9;? !"#:;<= .. FGH I JKLM NOP KQORS OTR US VW X OY ZKRTMQ S[ \ OO] [KL M NOPK QO^W \ ]_ M][` a b c d ed c df g dedc d f h e 1 i jkle 3 m#6 n o m#6 n $p&q)r I * $s&' q)r I * tu 0 f v i u wi w xhgwd gw de 1 i ykle A 9 ;z @ Bz={8 |}?~n~8 |= t gw viu wi w e 1 i kl e
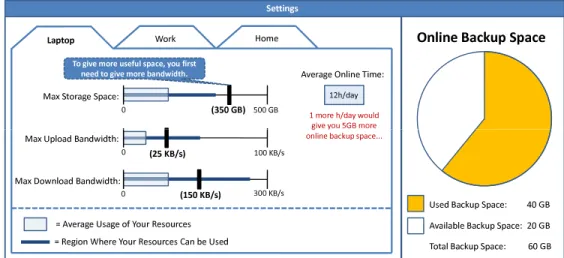
Figure 3: Market User Interface with more Information and more Interactive Feedback. A particularly important feature of this UI is that it allows
the user to see/experience the current market prices simply by moving the sliders and looking at the pie chart. If the user moves a slider a little and the pie chart only changes a little, this means that the current price for that resource is relatively low. If the user moves another slider a little and the pie chart changes a lot, this implies that the current market price for that resource is relatively high. Note that this is one of the es-sential aspects for this “hidden market UI” because it allows us to communicate the current market prices to the user in a non-explicit way. Even if the user is unaware of the fact that a price-based market underlies this system, he will notice that he can achieve a certain resource balance via different com-binations of supplied resources and we expect him to choose the combination that is best given his preferences.
Additional UI Details: The UI shown in Figure 2 is only a preliminary prototype. Ultimately we need to provide a little more information as shown in Figure 3. We also show the user the current average usage of his three main resources. For availability, the user does not have a slider but instead we only display his average availability over the last month as measured by the server. In addition, we show the user how much additional online backup space he would get if he were online for 1 more hour per day. The user can click on this information to see a more detailed graph showing the depen-dence between his online time and available backup space.
Users with Multiple Computers:The backup system is de-signed such that a user can seamlessly use it with multiple computers. For example, a user could use his home computer primarily for supplying resources, while he uses his laptop only to back up important data, i.e., he never wants to give up any space on his laptop. This is perfectly fine because the user’s resource balance is computed based on the sum of the contributions by all of his computers. To indicate to the user that the pie chart he sees is an aggregated view based on all of his computers, the UI shown in Figure 3 has one tab for each of the user’s computers. On each tab, the user can inspect the slider settings for the particular computer, but he can only adjust the sliders for the computer he is currently working on.
3.3 Enforcing Resource Ratios
A challenge that we have ignored so far is the fact that we need all three resources from each user. In general, the avail-able online space increases when the user increases one of his sliders. However, this is only true for a subset of possi-ble slider positions. In particular, if a user keeps increasing one slider towards the maximum while the other two sliders are relatively low, at some point the online backup space stops increasing. For example, if a user limits his upload bandwidth to 5KB/s, increasing his space from 50GB to 100GB should not increase his online backup space. The reason is that we would never store 100GB on this user because 5KB/s would not be enough to have a reasonable retrieval rate. Thus, for the system to use the whole supply of 100GB, the user first has to increase his supply of bandwidth. We notify the user about this via a small pop up message (see Figure 3).
In the UI, we display the area where the sliders have an ef-fect on the resource balance as a thicker line. Once the user moves a slider beyond the point where the line is thick, the resource balance doesn’t change any more. Moreover, when the user moves one slider, the “effective slider regions” for the other resources change simultaneously. When one slider is moved up, the effective slider regions for the other two re-sources increase or stay the same, and analogously when one slider is moved down. To determine how much of resource Ais usable, given a particular supply of resourcesB andC we look at the system-wide usage of all resources. If a user sets his sliders in the same ratios as the system-wide usage, he is always inside the effective slider regions. However, re-quiring this exact ratio from all users is too restrictive and it would ignore the freedom the system has in allocating work to different users. Instead, we use a “slack factor” specify-ing how different from the system-wide usage ratios an indi-vidual user’s supply can be. Note that this flexibility can be different for every combination of any 2 resources. Thus, the constraint on a user’s supply vector can be expressed math-ematically via the following six inequalities (whererXY
in-corporates the system-wide usage and the slack factor): SX ≤SY ·rXY, whereX 6=Y ∈ {S, U, D}.
3.4 Handling Low Account Balances
As long as we don’t use real money (i.e., have access to the users’ credit cards), the maximum deficit (of virtual currency) that a user can take on must be bounded. That bound can be adaptive, e.g., it could increase over time or proportion-ally to usage. However, for every user, there is a maximum deficit level at which the system will not allow him to back up any more files. For a finite time period (e.g., 4 weeks) the user will have the opportunity to retrieve his files. But if the user does not pay back his deficit within that time pe-riod, the system will ultimately start deleting the user’s files. It is important to point out that the system cannot simply ad-just the slidersfor the userbecause that would require know-ing the user’s preferences. When the user adjusts the sliders he chooses his most-preferred trade-off for the supplied re-sources and thereby expresses his preferences explicitly. The only thing the system can do is to use a heuristic (adjusting the sliders proportionally to their previous setting) when the user explicitly wants the system to do so.
A user’s account balance can be in one of three states: healthy (balance close to zero or larger than zero), weak (bal-ance quite negative), or unhealthy (bal(bal-ance close to the maxi-mum deficit or equal to the maximaxi-mum deficit). The following UI devices for handling a user’s low account balance are im-portant to prevent users from reaching their maximum deficit levels and to motivate them to interact with the market regu-larly (i.e., update the supply sliders sufficiently often).
1. When a user’s account balance is weak or unhealthy, the system will automatically send an email alerting the user to increase his resource caps or to stay online longer. 2. On the main UI of the software, the user will always see
the current healthiness of his account balance (e.g., in the form of a traffic light).
3. Next to the account status will be a button that can be clicked to automatically increase all sliders.
4. We provide a checkbox for the user to specify that his client shall always increase his resource caps automati-cally when his balance gets too low.
4 Future Work: Usability Study
At first sight, the proposed UI might seem quite complicated because multiple things can change at the same time (sliders, effective slider regions, and the resource balance). However, in initial tests (with less than 10 users) we found that while most users indeed find the UI quite complicated the first time they see it, once they use it for a while, play with the sliders and observe how the pie chart changes, they quickly under-stand the underlying concept. We are currently designing a usability study to evaluate the UI empirically. In particular, we are interested in answering the following three questions: 1. Will a non-expert user be able to express his preferences
over his supply and demand using this UI?
2. Will a non-expert user understand (at an intuitive level) that different resources have different “prices”?
3. Will a non-expert user understand the importance of availability, e.g., that instead of increasing his space or bandwidth supply he could also increase his availability?
5 Conclusion
As more and more intelligent systems are adopting market-based paradigms, new user interfaces are necessary to allow non-expert users to interact with these markets, express their preferences and get informed about the current state of the market. In this paper, we have described the design of a user interface that allows users to interact with the market under-lying a P2P backup system. In contrast to previous work on market-based systems, we do not require our users to specify bid or ask prices in an auction-like framework. Instead, we provide the user with three sliders that he can use to specify how much of each of his resources he would like to supply. A pie chart shows him how much online backup space he will get in return. While moving the sliders, the pie chart will change showing the user indirectly the relative prices of the three different resources. This UI allows the user to express his preferences in an intuitive way and it provides the user with all the information he needs to know about the market. We hope that this general paradigm of designing UIs for “hid-den markets” will be adopted more widely such that market-based intelligent system will become ubiquitous in the future.
References
[Aperjis and Johari, 2006] Christina Aperjis and Ramesh Johari. A peer-to-peer system as an exchange economy. InProceedings from the Workshop on Game Theory for Communications and Networks (GameNets), Pisa, Italy, October 2006.
[Gajos and Weld, 2005] Krzysztof Gajos and Daniel S. Weld. Pref-erence elicitation for interface optimization. InProceedings of the 18th annual ACM Symposium on User Interface Software and Technology (UIST), pages 173–182, New York, NY, 2005. [Goelet al., 2008] Sharad Goel, David Pennock, Daniel M. Reeves,
and Cong Yu. Yoopick: A combinatorial sports prediction mar-ket. InProceedings of the 23rd Conference on Artificial Intelli-gence (AAAI), pages 1880–1881, Chicago, IL, July 2008. [Laiet al., 2005] Kevin Lai, Lars Rasmusson, Eytan Adar,
Li Zhang, and Bernardo A Huberman. Tycoon: An implemen-tation of a distributed, market-based resource allocation system.
Multiagent Grid Systems, 1(3):169–182, 2005.
[Li and Zhang, 2004] Jin Li and Cha Zhang. Distributed hosting of web content with erasure coding and unequal weight assign-ment. InProceedings of the IEEE International Conference on Multimedia and Expo (ICME), pages 27–30, Taipei, Taiwan, June 2004.
[Morriset al., 2008] Dan Morris, Ian Simon, and Sumit Basu. Ex-posing parameters of a trained dynamic model for interactive mu-sic creation. InProceedings of the 23rd Conference on Artificial Intelligence (AAAI), pages 784–791, Chicago, IL, July 2008. [Roth, 2008] Alvin E. Roth. What have we learned from market
design? The Economic Journal, 118:285–310, 2008.
[Sandholm, 2007] Tuomas Sandholm. Expressive commerce and its application to sourcing: How we conducted $35 billion of generalized combinatorial auctions. AI Magazine, 28(3):45–58, 2007.
[Simonet al., 2008] Ian Simon, Dan Morris, and Sumit Basu. Mysong: automatic accompaniment generation for vocal melodies. InProceeding of the 23rd annual conference on Hu-man factors in computing systems (CHI), pages 725–734, New York, NY, 2008.