Washington University in St. Louis Washington University in St. Louis
Washington University Open Scholarship
Washington University Open Scholarship
Engineering and Applied Science Theses &Dissertations McKelvey School of Engineering
Spring 2020
The E
ff
ects of Mixed-Initiative Visualization Systems on
The E ects of Mixed-Initiative Visualization Systems on
Exploratory Data Analysis
Exploratory Data Analysis
Adam Kern
Follow this and additional works at: https://openscholarship.wustl.edu/eng_etds
Part of the Graphics and Human Computer Interfaces Commons
Recommended Citation Recommended Citation
Kern, Adam, "The Effects of Mixed-Initiative Visualization Systems on Exploratory Data Analysis" (2020). Engineering and Applied Science Theses & Dissertations. 523.
https://openscholarship.wustl.edu/eng_etds/523
This Thesis is brought to you for free and open access by the McKelvey School of Engineering at Washington University Open Scholarship. It has been accepted for inclusion in Engineering and Applied Science Theses & Dissertations by an authorized administrator of Washington University Open Scholarship. For more information,
Washington University in St. Louis McKelvey School of Engineering
Department of Computer Science and Engineering
Thesis Examination Committee: Alvitta Ottley, Chair
Chien-Ju Ho William Yeoh
The Effects of Mixed-Initiative Visualization Systems on Exploratory Data Analysis
by
Adam Nathaniel Kern
A thesis presented to the McKelvey School of Engineering at Washington University in partial fulfillment of the
requirements for the degree of Master of Science
May 2020 Saint Louis, Missouri
Acknowledgments
When I decided to pursue my master’s degree in computer science, I wanted to take on a challenge; I wanted to try doing something I was not sure I could do. So I decided to try writing a thesis. In the words of Douglas Adams, “this was widely regarded as a bad move”, and I quickly learned that I would never complete it without a lot of help from a wide array of people.
First and foremost, my deepest gratitude to my advisor, Professor Alvitta Ottley, Ph.D. Her incredible support is evident throughout this thesis, from its conception to its completion, and I owe this entire paper to her guidance and encouragement. Her kindness and insight not only buoyed me through this process, but taught me many lessons, both in research and in life, that I will carry with me well past this thesis and my time at WashU.
A special thanks also goes to the many graduate students and distinguished faculty within my department who have reviewed this thesis and helped support the related research. In particular, a special thank you to Professors Ron Cytron, Bill Siever, and Doug Shook for being advisors and mentors throughout my undergraduate and graduate years. A special thank you to Josh Landman as well; had he not taken me under his wing four years ago, I doubt I would even be in this field, and I certainly would not be here.
To everyone else I crossed paths with while at school: thank you. In some not-so-small way, this thesis is yours as much as it is mine.
Adam Nathaniel Kern
Washington University in Saint LouisContents
Acknowledgments . . . i List of Tables . . . iv List of Figures . . . v Abstract . . . vi 1 Introduction . . . 1 1.1 Contributions . . . 3 2 Prior Work . . . 42.1 Visual Analytics and Interaction Techniques . . . 4
2.2 Mixed-Initiative Systems . . . 6
2.3 Machine Learning and Visualization . . . 7
3 Mixed-Initiative System Design . . . 9
3.1 Algorithm Input . . . 9
3.2 Visualization Adaptation . . . 10
4 Implementation . . . 13
4.1 Dataset Selection . . . 13
4.2 Encoding Data into a Visualization . . . 15
4.3 Embedded Reporting Implementation . . . 17
5 Evaluation . . . 19
5.1 Task Design . . . 20
5.2 Objective Data Gathering . . . 20
5.3 Subjective Data Gathering . . . 21
5.4 Adaptive System Hyperparameters . . . 21
6 Results . . . 22
6.1 Limiting Users . . . 22
6.2 Limited User Demographics . . . 23
6.3 Interaction and Response Data . . . 23
6.5 Open Comments . . . 26
6.6 Relational Findings . . . 26
7 Discussion . . . 29
7.1 Statistically Significant Change in Zooms . . . 29
7.2 Statistically Significant Inconsistency . . . 30
7.3 Interpreting a Lack of Statistical Significance . . . 31
7.4 Lessons from Open Comments . . . 31
7.5 Future Work . . . 32
7.5.1 Differentiate Modes of Information . . . 32
7.5.2 More Powerful Agent . . . 32
7.5.3 Further Analysis of Insights . . . 33
7.5.4 Expanded, Longitudinal Study . . . 33
8 Conclusion . . . 34
References . . . 35
List of Tables
3.1 Capabilities of different levels of mixed-initiative systems, as laid out by [1]. 11 6.1 Average values for interaction data frequency; bold values indicate statistically
significant differences . . . 24 6.2 Average data coverage from clicks and hovers . . . 24 6.3 Average values for system usability scores, overall and per-dimension . . . . 25 6.4 p-values of regressions on clicks and hovers to predict number of insights.
List of Figures
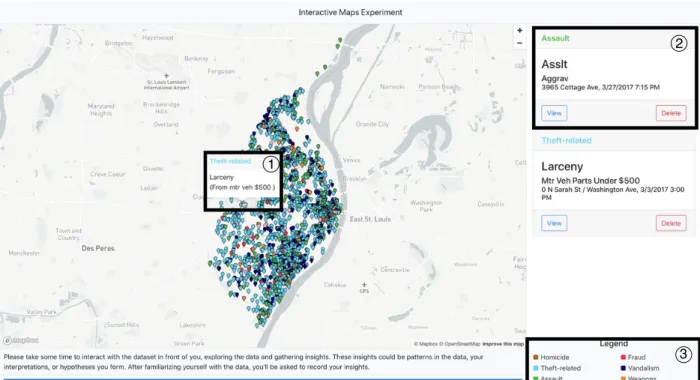
4.1 An overview of the entire visualization using the St. Louis crime dataset, with visualization components labelled. Component 1 corresponds to the hover tooltip; component 2 corresponds to the information card; component 3 corresponds to the label and filter. . . 15 4.2 The changing z-order of the pins as the user clicks, with a particular interest
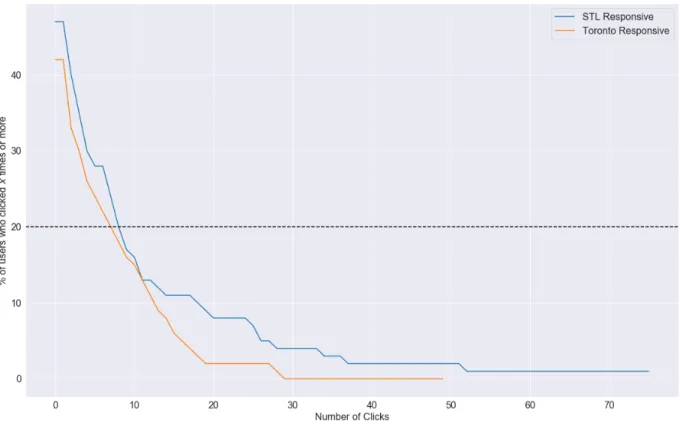
in Mexican restaurants (coded in brown). . . 18 6.1 A graph showing how often users clicked on the visualization within a
condi-tion. As the number of clicks increases on the x-axis, the percentage of users who clicked at leastxtimes decreases. The dotted line shows the chosen cutoff point of 20%. . . 23 6.2 Regression models on interactions and transformations to predict number of
insights. Data from responsive conditions are inblue, data from unresponsive conditions are inorange. . . 28
ABSTRACT OF THE THESIS
The Effects of Mixed-Initiative Visualization Systems on Exploratory Data Analysis
by
Adam Nathaniel Kern
Master of Science in Computer Science Washington University in St. Louis, May 2020
Research Advisor: Professor Alvitta Ottley
The main purpose of information visualization is to act as a window between a user and data. Historically, this has been accomplished via a single-agent framework: the only decision-maker in the relationship between visualization system and analyst is the analyst herself. Yet this framework arose not from first principles, but from necessity: prior to this decade, computers were limited in their decision-making capabilities, especially in the face of large, complex datasets and visualization systems. This thesis aims to present the design and evaluation of a mixed-initiative system that aids the user in handling large, complex datasets and dense visualization systems. We demonstrate this system with a between-groups, two-by-two study measuring the effects of this mixed-initiative system on user interactions and system usability. We find little to no evidence that the adaptive system designed here has a statistically-significant effect on user interactions or system usability. We discuss the implications of this lack of evidence, and examine how the data suggests a promising avenue of further research.
Chapter 1
Introduction
Thesis Goal: This thesis aims to present the design and evaluation of a mixed-initiative system.
The main purpose of information visualization is to act as a window between a user and data. The field of information visualization exists to examine and study the ways in which visualizations can aid analysts, researchers, and all people who must interact with data of all types in understanding, synthesizing, and communicating that data Historically, this has been accomplished via a single-agent framework: the only decision-maker in the relationship between visualization system and analyst is the analyst herself. Yet this framework arose not from first principles, but from necessity: prior to this decade, computers were limited in their decision-making capabilities, especially in the face of large, complex datasets and visualization systems.
Yet these same datasets are becoming more common and more integral to the workflows of analysts around the world. The size and complexity of these datasets poses a particular challenge to visualization designers: as more data is packed into a visualization, it becomes more difficult to view every visual element at the same time. In particular, in visualizations that present individual data points (rather than showing statistics and aggregates), the density of data points can cause them to start overlapping, partially or fully hiding some datapoints from view. There are existing solutions to this issue. The most frequent solution is to allow the user to zoom in and out of the visualization, allowing the analyst to see an overview that may be partially-obscured, or see individual points in their entirety. However, this solution not only loses the benefit of an overview — as datapoints are obscured, a fully-zoomed out view does not give a true representation of the data — but it forces users to take
longer on tasks [26], as gathering a full picture of the data requires more interactions. In the context of geographic data, cartographers often carefully choose representations to highlight certain aspects of the visualization, or vary the representation by zoom level (this can be seen in Google or Apple maps, for example). Yet this also fails to capture a representative overview of the data. Furthermore, both of these techniques are often determined a priori, and the user’s tasks and interests are not taken into account.
However, the past decade has brought with it a resurgence and explosion of machine learning techniques that have expanded the abilities of computer systems in fields such as perception, network analysis, and speech recognition [38]. These advancements, combined with the con-tinuation of Moore’s Law, have heralded an age of machine learning techniques permeating fields from which they were previously absent. Although these advancements and changes have undoubtedly touched the information visualization field, they have yet to truly challenge the existing single-agent paradigm discussed above. With new machine learning techniques (and greater processing power) in hand, it seems as if researchers in the field should be able to create multi-agent systems, in which both the analyst and the visualization system work together to guide the analytical process.
This thesis aims to contribute to that ideal by presenting an mixed-initiative information visualization system. The novel design uses a hidden Markov model algorithm, developed by Ottley et. al [36], to capture and predict user attention. The visualization then responds by adaptively re-drawing datapoints, bringing datapoints that the user is likely to be interested in to the foreground, and sending “uninteresting” datapoints to the background. In doing so, we hope to create a system that allows for an informative overview, encourages easier exploration, and reduces the need for visual transformations.
After completing a study on the effect of the system described in this thesis, we find only one statistically significant difference under the adaptive system. The interpretation of the difference is difficult, but could point to the role of datapoint density in the effectiveness of the re-drawing technique used in this thesis. We also point to some statistically insignificant results as encouragement that the type of mixed-initiative system described in this thesis is promising, but may need more work or further study to be effective at aiding analysts in their struggle with Big Data.
1.1
Contributions
In light of the existing research, and the problems posed above, this thesis makes the following contributions:
• The design and evaluation of a real-time mixed-initiative system: We provide the de-sign and evaluation of a mixed-initiative approach to exploratory visual analysis. We explore how this approach can take full advantage of existing prediction systems and discuss the implications of this type of system.
• A real-time adaptive agent that leverages a design- and context-agnostic prediction algorithm: As part of the experiment design, we lay out how an existing prediction algorithm can be integrated as a real-time adaptive system to help users make sense of large datasets. It is the first design- and context-agnostic mixed-initiative system, to the best knowledge of the authors.
Chapter 2
Prior Work
This thesis builds off of work from three fields: visual analytics, human-computer interaction, and machine learning. In particular, the study of interaction from visual analytics motivates the design of the implementation and supports the construction of a mixed-initiative system from the perspective of a user or analyst. The study of mixed-initiative systems, a subfield of human-computer interaction, explores the prior work on systems similar to the one described in this thesis and outlines their shortcomings. In doing so, we carve out a niche that we believe can be filled by the system presented in this thesis. Lastly, we explore how the use of machine learning allows us to fill that niche by providing real-time approximations of user attention.
2.1
Visual Analytics and Interaction Techniques
The term “visual analytics” traces its roots to the Pacific Northwest National Laboratory, a federally funded research and development center run by the United State Department of Energy just after the turn of the 21st century. The term was popularized by James J. Thomas and Kristin A. Cook in a report called “Illuminating the Path”, written for the United States Department of Homeland Security in 2005 [46, 47]. Driven by the September 11 attacks in 2001 and the Hurricane Katrina disaster in 2005, the authors felt compelled to draw the attention of the visualization community towards developing systems capable of enabling analysts to comprehend “overwhelming amounts of disparate, conflicting, and dynamic information”[46, p. 2]. The report goes on to define visual analytics as “the science of analytical reasoning facilitated by interactive visual interfaces” [46, p. 4]. The report then
lays out four major research areas in visual analytics: the science of visual reasoning; visual representations and interaction techniques; data representations and transformations; and the production, presentation, and dissemination of visual analytics. It is with the second item, visual representations and interaction techniques, that this thesis is concerned.
In the aforementioned seminal report, Thomas and Cook state that little theory exists about “the science of interaction”, and suggest that researchers work to develop the field more deeply. The authors also note that “analysis. . . is more of a dialogue between the analyst and the data” [46, p. 73]. This “dialogue” framing will be critical to keep in mind, as it is fundamental to the conception of visual analytics.
Some work had already been done on this “science of interaction” in adjacent fields; in particular, Colin Ware had touched upon interaction in visualizations in a 2000 book ti-tled “Information Visualization: Perception for Design” [54], laying a foundation for future research. However, the suggestion to expand the “science of interaction” took a few years to catch on in the visual analytics community. Yi et. al lament in a 2007 paper that “the representation component [of information visualization systems] has received the vast ma-jority of attention in Infovis research” [56]. That being said, the suggestion did catch on: Yi et. al [56] created a taxonomy of interactions, and a number of revisions, challenges, and refinements followed from the community in the coming years [20, 8, 24, 39, 52].
While many of the visualization taxonomies built by these researchers are still in widespread use today, the development of a comprehensive and standard set of interaction techniques is still an open challenge [14]. That does not mean, however, that the existing taxonomies are not useful, or that they do not agree on some points. Most, if not all, of these taxonomies rely on a few underlying models of how the visual analytics process is carried out. One of the most popular and widely-used of these models is the “sensemaking loop” developed by Pirolli and Card in 2005 [37], which describes the process by which intelligence analysts go from the collection of data to the presentation of conclusions. Other popular frameworks, such as those developed by van Wijk [51] and Keim et. al [27], present alternative understandings of visualization’s role in analysis by abstracting away some of the details of the Pirolli and Card model. However, the important thread to follow is not the fact that there exist competing theories, but rather that all of the theories employ some form of a loop between user and
visualization in which the user creates hypotheses, tests them against the visualization, refines the visualization, and forms new hypotheses.
This looping structure gets at the ideal “analytic dialogue” discussed in the Thomas and Cook report. Yet Booth et. al, in a survey of these process models [9], point out that all of them present a flow of information directed by a single agent: the user. True, the visualization provides the analytic platform from which the user can draw conclusions, and the user refines that platform as she works, but at the end of the day, the user must both form hypothesis and refine the visualization parameters.
However, this single-agent model of analysis runs against the grain of every visual analytics paper, from the field’s inception to the most current research. As much as researchers would like to view this back-and-forth between user and visualization as the critical “analytic dialogue” proposed by Thomas and Cook, it is most often a monologue, not a dialogue, that is occurring. Enter the concept of a mixed-initiative system.
2.2
Mixed-Initiative Systems
This thesis is not the first work to question the single-agent nature of the supposedly “bi-lateral” discourse in visual analytics. Researchers, computer scientists, and hobbyists have been discussing the idea of computer systems and humans working in harmony since the beginning of modern computing [49]. Yet for many decades, the idea of human-computer collaboration was dormant within the field of information visualization. However, the idea was not dormant in the human-computer interaction community. A series of essays in the September/October 1999 issue of “IEEE Intelligent Systems and Their Applications” sum-marizes the developing field of mixed-initiative systems, a “flexible interaction strategy in which each agent (human or computer) contributes what is best suited at the most appro-priate time” [23]. Eric Horvitz, one of the essay authors, had published a paper earlier in 1999 talking about how many of his colleagues were focused either on developing automated agents that can be accessed via conventional UIs, or on exploring new interaction methods. Horvitz proposed the field of mixed-initiative system as a bridge or compromise between the two sides [25]. He also offered a more detailed definition of mixed-initiative systems: “methods that explicitly support an efficient, natural interleaving of contributions by users
and automated services aimed at converging on solutions to problems”. In other words, Horvitz proposes that the solution to the single-agent problem is to introduce autonomous or semi-autonomous agents to act as the other side of the dialogue.
Horvitz’s 1999 paper, and the essays described above, ended up formalizing an existing subfield of human-computer interaction, and great progress has been made in developing mixed-initiative systems for a number of different applications. However, the majority of this progress has come in the form of custom-tailored backends to domain-specific applications that are often more focused on user interface than visualization [15, 16, 30, 35, 13, 53, 22, 44]. This context-specific development is useful for exploration of mixed-initiative systems in the human-computer interaction community, but does not conform to any of the frameworks provided for interaction in the visual analytics community. That is to say, these systems do not work based off a theory of the “science of interaction” generally, but rather off the interactions of a particular system.
Machine learning is the other major area in which mixed-initiative systems have become prominent. The necessary semi-autonomous nature of the computer agent in mixed-initiative systems can be facilitated by techniques from the machine learning field, especially as it has blossomed and advanced in the past two decades. Yet these advances often come in the form of the human helping the computer; in particular, many mixed-initiative visualization systems have been developed that allow for humans to help train and tune machine learn-ing systems [40, 17, 32, 44]. The critical distinction between these systems and the those described and imagined by visual analytics researchers is that the computer is building the models, and the human is just helping; in contrast, visual analytics is focused on leveraging visualization to allow forhumans to more effectively build models. As such, there is still need for the development of mixed-initiative systems which leverage machine learning techniques to aid in human-centered model-building.
2.3
Machine Learning and Visualization
How can researchers leverage machine learning to create general-purpose mixed-initiative information visualizations? Here we turn to prior research from our own lab, the Visual
Data Analysis Group (VDAG) at Washington University in St. Louis1. In “Follow the
Clicks: Learning and Anticipating Mouse Interactions During Exploratory Data Analysis”, Ottley, Garnett, and Wan lay out a critical piece to enable this mixed-initiative system we aim to design: a predictive algorithm which uses passive observations of user interactions to predict future interactions [36]. This prior research uses a hidden Markov model to model user attention and, critically, constructs the model to entirely sidestep the complex and as-of-yet unsolved issue of interaction taxonomies. Instead, the model employs visual marks and channels [7] — descriptions of the primitive types of geometric elements used in visualizations, and their graphical properties — to represent the hidden states of the Markov model. The advantage of this framework is that if the hidden state is built from visual basics, then every interaction possible in a data visualization can be mapped to the components of the hidden state [12, 11].
Although Ottley et. al originally designed their experiment to assess the predictive ability of their model, they do discuss the implications for mixed-initiative systems. Chief among those implications, and the one this thesis has been building to, is that the existence of a system that models users’ attention and predicts their future actions based on passive observations of low-level visual building blocks should allow a computer agent in a mixed-initiative system to guide a user’s attention towards visual elements of future interest.
The question remains: how is this helpful? If the algorithm is only proven (and designed) to capture the future attention of the user, then won’t the user visit or investigate a visual mark whether the algorithm can predict it or not? While this may be true in systems with small datasets, all too often there remain complaints of “too much data”. This abundance of data available to the analyst then poses a challenge to visualization designers: how to effectively show or highlight relevant data while temporarily (or permanently) hiding or deemphasizing irrelevant data. Techniques certainly exist for highlighting or emphasizing relevant data, but the question of what is relevant is often left to the analyst; if the visualization system itself can help determine that, it may allow the analyst to more easily make sense of large or unwieldy datasets.
Chapter 3
Mixed-Initiative System Design
The introduction of this thesis aimed to build a foundation for the work that follows in a bottom-up manner: by reviewing the concepts and ideals of the fields that form the basis for this thesis, and working towards the problems, issues, and goals this experiment design tries to address. With that groundwork lain, the remainder of this thesis will try to separate the design of a visual system that could benefit from a mixed-initiative agent from the design of the mixed-initiative agent itself. The purpose behind this approach is that by building the two components separately, the reader will be more effectively persuaded that the type of mixed-initiative agent proposed is as design- and context-agnostic as possible.
3.1
Algorithm Input
As discussed in Section 2.3, the algorithm employed in this thesis is one developed by Ottley, Garnett, and Wan [36]. In their paper, the authors of the algorithm discuss how the hidden Markov model’s unobservable states can be described in terms of the marks and channels of a visualization. The authors furthermore describe the observable states of the model in terms of the user’s interactions with the visualization system. Finally, the authors specifically lay out the unobservable and observable states, as well as the dynamic and observational models of the HMM for an experiment consisting of a clickable map.
In particular, the authors define the unobservable state of the model (i.e. the user’s attention at time t) as a four dimensional vector zt = (xt, yt, kt, πt), where xt ∈R and yt ∈R are the
Arson), and πt ∈ [0,1] is a bias parameter which describes the user’s bias towards location
vs category. They define the observable state of the model in terms of the set of possible interactions that the user can perform; in the case of the paper, these are map clicks. We leave the descriptions of the dynamic and observation models to the original paper, as they are not as critical to understanding how this algorithm can be modified into a real-time adaptive system.
Since the paper that created this algorithm laid out specific models of states and dynamics for a geographical interface, we will limit ourselves to the same models in this thesis. That is to say, despite the fact that the user can do much more than click on datapoints in the visualization described in Chapter 4, we will limit ourselves to just the user’s clicks as input to the real-time algorithm. Further expansion of the algorithm to include all other types of interaction in the system described above is possible, but is left to future work.
The only real adaptation of the algorithm described in “Follow the Clicks” is assigning an instance of the algorithm to every user, and persisting that model’s state for the duration of a user’s interactive session with the visualization. In doing so, clicks can be registered by the model in real-time, at which point the model updates its internal state and returns a probability mass distribution over the points in the visualization.
3.2
Visualization Adaptation
In order to understand how the agent will interact with the visualization, it is worth under-standing in slightly more detail what kinds of mixed-initiative systems exist. In the collec-tion of essays on mixed-initiative systems mencollec-tioned in Seccollec-tion 2.2, James Allen contributes “Mixed-Initiative Interaction” [1]. In this essay, Allen lays out a hierarchy of mixed-initiative systems with four levels in order of increasing capabilities: unsolicited reporting, subdialogue interaction, fixed subtask initiative, and negotiated mixed initiative. The capabilities of these systems are reproduced in Table 3.1.
The mixed-initiative system that this thesis outlines is one that employs unsolicited report-ing. While a higher-level mixed-initiative system may be more ideal for exploratory data
Mixed-Initiative Levels Capabilities
Unsolicited reporting Agent may notify others of critical information as it arises Subdialogue initiative Agent may initiate subdialogues to clarify, correct, and so
on
Fixed subtask initiative Agent takes initiative to solve predefined subtasks
Negotiated mixed initiative Agents coordinate and negotiate with other agents to deter-mine initiative
Table 3.1: Capabilities of different levels of mixed-initiative systems, as laid out by [1].
analysis, unsolicited reporting still allows the computer agent to report or point out inter-esting data to the user. In particular, an unsolicited reporting scheme works well with the algorithm developed by Ottley, Garnett, and Wan, as its output is a probability distribution over datapoints. Looked at in terms of available information, the computer agent is only able to process passive observations and return a probability distribution. The algorithm does not allow the computer agent to “coordinate and negotiate”, the agent is not “solving predefined subtasks” (unless the predefined subtask is finding points of future interest), and the algorithm does not allow direct dialogue input to “clarify, correct, and so on”. As a result, the best classification of the agent is one that employs unsolicited reporting.
So what kind of unsolicited reporting system can the agent employ? And what kind of unsolicited reporting is helpful to a user? This depends partially on the stated goal of the system. This thought was given some consideration in Section 2.3: the algorithm may be most useful when the user is trying to make sense of large amounts of data.
In particular, visualizations with large amounts of occlusion (where datapoints overlap and partially or fully obscure each other) are difficult for an analyst to use effectively. These visualizations could certainly use zooming to handle this occlusion, but this solution has its problems and limitations. When the visualization is completely zoomed out, many of the datapoints are partially or entirely occluded, making large trends hard to see. When the visualization is completely zoomed in, pins can be seen in their entirety, but such a close view can cause the analyst to lose context [26].
This is not to say that zooming itself is the problem; a 2013 study by Jakobsen and Hornæk showed that zooming, while sometimes confusing, is also one of the most effective and quickest
tools for navigating large maps [26]. However, the same study showed that being able to perform tasks without leaving an overview of the map — i.e. while zoomed all the way out, as seen in Figure 4.1 — is rated as the easiest way to interface with large maps. It seems then that the ideal mode of interaction would be to mix the two: to aim for an informative overview, but still allow for zooming into detail as necessary.
This is where an adaptive real-time system can aid the user. In particular, if the adaptive system has a forecast of points the user may be interested in, then it should act to change the visualization, drawing the user’s attention to those points. There are myriad ways such a system could accomplish this, which broadly fall into three categories: direct reporting, where the computer agent uses plaintext or other non-visual forms of communication to draw the user’s attention to points of interest; interactive guidance, where the user’s interactions are modified to encourage interaction with points of interest (e.g. a bubble cursor [21] or target gravity [4]); and what we are calling “embedded reporting”, where the agent communicates with the user via direct manipulation of the visualization. The implementation of this embedded reporting scheme is further discussed in Section 4.3.
Chapter 4
Implementation
To support mixed-initiative data exploration, we design a map-based visualization system to following Shneiderman’s visual seeking mantra: “Overview first, zoom and filter, then details-on-demand” [43]. To build such a system, we address three major points. The first is dataset selection, which must be done before anything else (as it is in the analytic process), since it informs all other aspects of a visualization. The second is encoding: how is each attribute of the data represented in the visualization system? The third is reporting: how does the computer agent report its findings to the user via the visualization system? Each of these aspects of a visual analytic system are discussed below.
4.1
Dataset Selection
We first turn to the critical aspects that this visualization system much have; chiefly, if the stated advantage of a mixed-initiative system is its ability to help the user navigate large, dense datasets, then the visualization design must employ large, dense datasets. Fur-thermore, the datasets should be rich enough to compel exploration (otherwise why would an analyst be looking at a visualization?) and easily available to the researchers. Finally, the use of two datasets, rather than just one, provides stronger justification to any results or conclusions drawn from an experiment by lowering the risk that the results were data-dependent. Given these criteria, two datasets were chosen: the Yelp Open Dataset [55], and a dataset of crime in St. Louis, MO, USA [34].
Yelp Open Dataset
The Yelp Open Dataset was released by Yelp, Inc. as part of a series of challenges put forth by the company, but is also open to general research. It contains a vast amount of information about business and reviews, but for the purposes of this experiment the dataset was culled down to restaurants in Toronto, Canada (chosen for the high-density nature of that subset of the dataset). Each restaurant had a variable number of attributes. Eight attributes were selected for use in the experiment based on the availability of each attribute in the dataset: a unique ID, the name of the restaurant, the address of the restaurant, the exact coordinates of the restaurant, the average score of all reviews of the restaurant (ranked out of 5), the price of the restaurant (ranked out of 5), and the “main cuisine” of the restaurant.
The first seven attributes were included in the dataset; the eighth attribute, the “main cuisine”, was hand-annotated by the researchers, chosen from a set of cuisines provided in the dataset for each restaurant, and determined by independent research into the restaurant. Finally, the top ten most prevalent cuisines were chosen for use in the experiment: cuisines originating from Korea, Japan, Thailand, Canada, Mexico, Italy, and China, as well as pizza, burger, and sandwich shops. Restaurants that fell into one of these main cuisine categories were included in the final experiment, culling the dataset down to 2,915 restaurants.
St. Louis Crime Dataset
The St. Louis Crime Dataset was pulled from the database of crimes maintained by the Metropolitan Police Department of St. Louis; specifically, the dataset consists of the crimes committed the month of March 2017. The dataset contains 1,951 crimes, each with 20 features. Five attributes were selected for use in the experiment based on the availability of each attribute in the dataset: a unique ID, the type of crime, the coordinates at which the crime occurred, the street address at which the crime occurred, the date and time that the crime occurred, and a description of the crime. Eight types of crime exist in the database: homicide, theft-related, assault, arson, fraud, vandalism, weapons, and vagrancy.
1
3 2
Figure 4.1: An overview of the entire visualization using the St. Louis crime dataset, with vi-sualization components labelled. Component 1 corresponds to the hover tooltip; component 2 corresponds to the information card; component 3 corresponds to the label and filter.
4.2
Encoding Data into a Visualization
Given that the chosen datasets all had geographical references in their attributes, the logical choice of visualization is a map. In addition to being the most effective method for showing geographic information, map visualizations have a major advantage: they are incredibly prevalent visualization systems, which users often interact with on an almost-daily basis [5]. As a result, experimental results not only have some claim to generality, but user familiarity with maps also reduces initial confusion and adjustment, allowing the effects of any mixed-initiative system to stand out more clearly.
The mapping of data attributes to visualization features is often guided, in any project, by the mantra “Overview first, zoom and filter, then details-on-demand” laid out by Ben Shneiderman in 1996 [43] — a mantra that has been revised, edited, and expanded upon since its inception, but which remains highly cited to this day [46, 27, 29, 28, 45, 6, 14].
Overview First, Zoom and Filter
Following this mantra, datapoints can be represented by pins in a map (determined by the coordinates included in each dataset) and color-coded according to the category of each datapoint: the main cuisine for restaurants, and the type of crime for St. Louis crime data. Colors were chosen using a list compiled by Sasha Trubetskoy [48], and Mapbox [33] was used as the underlying mapping software, with React-Map-GL [50] as a wrapper to interface with React [18]. The use of Mapbox means that panning and zooming are automatically built in to the visualization; both panning and zooming are programmatically limited so that the user cannot change focus from the desired area, for example by panning to New York City or zooming out to see the entire world. The result of these overviews can be seen in Figure 4.1.
Details-on-Demand
This provides a basic overview of the data; however, it is important at this point to address the difference in available attributes of each dataset. The Yelp dataset, with bounded, continuous features such as rating and price, could be more deeply encoded as an “overview” by, for example, using the size of each pin to represent the rating of each restaurant. However, the crime dataset does not contain any continuous features, which would mean that the visualizations for the crime dataset and the restaurant dataset would have to be different. This poses a particular challenge for experimental design, in which both datasets should be presented as similarly as possible; the goal is to isolate the dataset as the independent variable, without change to the representation, across the experiment.
As a result, the rest of the attributes are presented as details-on-demand. In particular, details are provided in two forms: as tooltip popups that appear when a datapoint is hovered over, or as “information cards” to the right of the map, created when a datapoint is clicked. The hover tooltip, as seen in segment 1 of Figure 4.1, shows just a few details, such as the restaurant’s name, rating, and price, or the crime’s type and description.
The information cards, on the other hand, show all the attributes of a given datapoint, as seen in segment 2 Figure 4.1. The information cards also provide two more modes of
interaction. The first is “View”, which transitions the viewport to center and zoom in on the datapoint corresponding to that information card and temporarily enlarges the selected datapoint to bring the user’s attention to the pin. The second is “Delete”, which removes the card from the sidebar. This allows the user to keep a running list of datapoints of interest, and refer back to them on the map on demand.
This setup covers most of Shneiderman’s mantra; the only part left out is “filter”. To round out the mantra, a legend is attached in the bottom right of the screen, which also acts as a filter, as seen in segment 3 of Figure 4.1.
Visual History
The final visual encoding employed in the visualization is a representation of interaction history. Feng et. al have shown that displaying visualization history to a user encourages them to visit more data and find more insights than they otherwise would [19]. To encour-age as much exploration as possible without the inclusion of a mixed-initiative system, we encode the interaction history by lowering the opacity of previously-clicked points in the visualization.
4.3
Embedded Reporting Implementation
Due to the density of data and the details-on-demand nature of the above visualization, the mixed-initiative system described here uses embedded reporting to communicate its beliefs about user attention. There are a number of ways to employ embedded reporting. Generally, any visual channel can be used to differentiate data points and communicate points of interest. Given that position, color, size, and opacity are already in use in the visualization, there are few channels remaining. More obscure channels, such as texture or orientation, are harder to use in non-categorical contexts. Seeing as the information to be displayed is an ordered ranking of datapoints, neither of these channels seem appropriate.
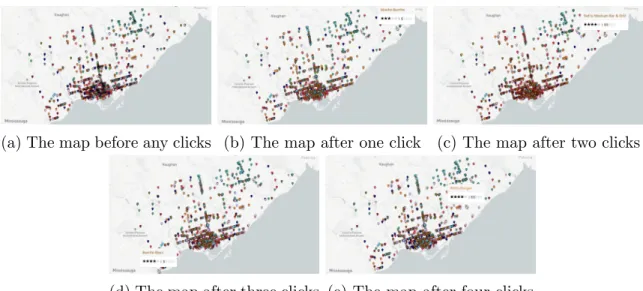
(a) The map before any clicks (b) The map after one click (c) The map after two clicks
(d) The map after three clicks (e) The map after four clicks
Figure 4.2: The changing z-order of the pins as the user clicks, with a particular interest in Mexican restaurants (coded in brown).
visualization. As a result, the algorithm can take advantage of this open visual channel, re-ordering the datapoints according to their probability masses, with the points with the highest probability mass being drawn last, so as to appear on top of all other points. In addition to simply being an unused channel, the z-order has a distinct advantage over other channels: it is noticeable at an overview level, but becomes irrelevant as the user zooms in and occlusion diminishes. Importantly, this means the algorithm is not “hiding” any information from the user (in contrast, imagine a changing opacity, where low-probability datapoints would all but disappear from the map). This distinction means that the z-order change effectively modifies the overview, without changing zoom behavior, mixing the best of both types of map interaction. The result is a series of changing z-orders of the same visualization, as demonstrated in Figure 4.2.
The change in z-order is subtle, and it may be difficult to point out exactly what changed, but this is a purposeful subtlety. A drastic or exaggerated change in visualization parameters could cause the user to become distracted by the changing layout, rather than being guided by it. The subtle change is meant to highlight trends in the overall data; for example, in Figure 4.2 the algorithm brings forward lots of Mexican restaurants (in brown) to the forefront, highlighting that downtown Toronto has an abundance of Mexican places to eat, although that may not have appeared to be the case at first.
Chapter 5
Evaluation
With a description of a real-time adaptive computer agent laid out in Chapter 3 and an example visualization system laid out in Chapter 4, it is possible to run an experiment to determine the effect of a real-time adaptive system on user interactions and system usability. In particular, we employed a between-groups, two-by-two experiment inspired by a similar study on latency by Liu and Heer [31]: the experiment used two datasets (Toronto restaurants and St. Louis crimes) and two conditions (adaptive and non-adaptive, a.k.a. responsive and unresponsive) to study the effects of adaptive systems, creating four groups:
1. Adaptive Toronto, then non-adaptive St. Louis 2. Adaptive St. Louis, then non-adaptive Toronto 3. Non-adaptive Toronto, then adaptive St. Louis 4. Non-adaptive St. Louis, then adaptive Toronto
After agreeing to the terms of the experiment as laid out by Washington University in St. Louis’s IRB protocol, participants were randomly assigned to one of the four groups. This two-by-two experiment is not ideal — within-group experiments are generally preferred to between-group experiments — but participants cannot complete the experiment twice on the same dataset without seriously biasing the second run. In addition, the inclusion of two datasets gives some strength to the generalizability of any effect found during the experiment.
5.1
Task Design
In the paper “Follow the Clicks”, the predictive algorithm developed was tested via a geo-graphical experiment using narrowly defined tasks. Specifically, participants of the experi-ment were asked to carry out location- and type-based tasks, as well as tasks that focused on both location and type. The advantage of these narrows tasks is that they mimic the in-ternal, unobservable state of the hidden Markov model underlying the predictive algorithm. Yet the entire premise of this thesis has been that the real-time system adapted from the predictive algorithm is design- and context-agnostic; this assertion is hard to support if the users of the visualization were limited in their interactions.
Consequently, the participants in this experiment were asked not to focus on particular tasks, but instead to “take some time to interact with the dataset in front of [them], ex-ploring the data and gathering insights”. Participants were then given the opportunity to write down as many (or as few) insights as they would like. The reward structure of the experiment was built around encouraging this insight-gathering: participants were awarded $1 for participating, and $0.50 for every insight gathered.
Participants were also primed for interaction and insight gathering. Every type of interaction (as described in Section 4.2) was also described to the user before either of the experiment conditions started. Additionally, examples of insights were given, such as “there are more kid-friendly coffee shops downtown than there are uptown”. The goal of this priming was to introduce the user to the visualization and make explicit the idea of an “insight” without biasing the user during either segment of the experiment. In this way, users were free to perform exploratory data analysis without guidance or restriction, creating a general-purpose task that can demonstrate the flexibility of the adaptive system.
5.2
Objective Data Gathering
To facilitate analysis, every user interaction was tracked; explicitly, all clicks, hovers, zooms, pans, card views, card deletes, and filter toggles were recorded by the system. This objective
data collection allows the adaptive system to be analyzed for its effect on the concrete actions of the users.
5.3
Subjective Data Gathering
In addition to objective data gathered in the background, each participant was asked to complete a survey about the visualization they had just interacted with (so each partici-pant fills out two surveys: one after using the adaptive system, and one after using the non-adaptive system). The surveys were administered using the System Usability Scale (SUS) [10], a widely-used, “robust and versatile tool for usability professionals” [3], with an added comments section at the end of each survey for general comments from users.
5.4
Adaptive System Hyperparameters
It should be noted that the predictive algorithm laid out in “Follow the Clicks”, as well as the real-time version adopted here, uses a number of hyperparameters to control how the algorithm acts. In particular, while modelling the “diffusion” of the user’s attention between interactions, the hidden Markov model needs hyperparameters to describe how the location (σx, σy), category (ρ), and bias (σπ) of the user’s focus (as described in Section 3.1)
shift and change; these variables were set to σx = σy = 0.03, σπ = 0.08,and ρ = 0.23.
These values were chosen based off of Bayesian optimization performed with the data from “Follow the Clicks”. In a production implementation of this kind of adaptive visual system, the hyperparameters could be tuned using data from the experiment described herein, or via optimization over data gathered in the initial usage of the system. Additionally, 1000 particles were used for the particle filter, and the observation model used covariance value
Chapter 6
Results
To run the study, 200 participants were recruited via Mechanical Turk [2]. There were 127 men and 73 women in the study (with available options for “gender nonbinary” and “prefer not to answer”), with ages ranging from 18 to 70 (µ = 36.5 and σ = 11.5). 65% of the participants reported having at least an associate’s degree.
6.1
Limiting Users
Before continuing with the presentation of results, a fundamental issue with the experiment must be addressed: not all users interacted equally with the system. The reason for this apparent lack of interaction is discussed further in Chapter 7; however, it is necessary to address the discrepancy between expectation and reality while performing the data analysis. A visualization of user interactions can be seen in Figure 6.1, showing what percentage of users performed a given number of clicks during a session. The main reason this lack of interaction is an issue is because the algorithm developed in [36] was only shown to be effective after the user’s third click; consequently, we do not believe it would be appropriate to include users who did not interact enough to meet this threshold. However, we wanted to analyze a group of users who seemed truly engaged, and felt that three clicks was not a high enough cutoff. We instead decided to pick the users whose click interactions were within the top 20% of their cohort. This ended up only including users who clicked at least eight times in the St. Louis responsive condition, and seven times in the Toronto responsive condition. The rest of the analysis presented within is done with only those top 20% of users.
Figure 6.1: A graph showing how often users clicked on the visualization within a condition. As the number of clicks increases on the x-axis, the percentage of users who clicked at least
x times decreases. The dotted line shows the chosen cutoff point of 20%.
6.2
Limited User Demographics
The chosen users consisted of 16 women and 25 men, with ages ranging from 19 to 69 (µ = 38.1 and σ = 12.1). 78% of chosen users identified having at least an associate’s degree, with 61% identifying as having a bachelor’s degree.
6.3
Interaction and Response Data
We begin with interaction and response data; specifically, we look at the number of different types of interactions within a single condition (e.g. the number of clicks on a responsive Toronto map). We measure across eight dimensions: clicks, hovers, zooms, pans, card views,
Toronto St. Louis
Responsive Unresponsive Responsive Unresponsive
Clicks 7.9 12.6 11.8 11.0 Hovers 52.0 41.0 46.4 38.6 Zooms 57.4 25.4 45.8 35.6 Pans 34.5 31.5 27.6 35.7 Views 5.2 41.0 4.0 7.3 Deletes 0.0 0.0 0.0 0.0 Filters 43.6 42.6 32.7 34.3 Insights 5.3 4.8 5.5 6.2
Table 6.1: Average values for interaction data frequency; bold values indicate statistically significant differences
card deletes, filter toggles, and insights. Table 6.1 contains the average number of each type of interaction or response per user, spread across datasets and conditions. The only statistically significant difference was the number of zooms in the Toronto dataset (p=0.048); all other measurement differences failed to cross a p-value threshold of α = 0.05.
We also measure both click and hover coverage; that is, what percentage of the datapoints do users investigate via clicking or hovering on them. We describe these results in Table 6.2. There is no statistically significant difference in click or hover coverage across the conditions.
Toronto St. Louis
Responsive Unresponsive Responsive Unresponsive Click Coverage 0.25% 0.38% 0.33% 0.33% Hover Covreage 1.54% 1.18% 1.46% 1.46%
6.4
Survey Data
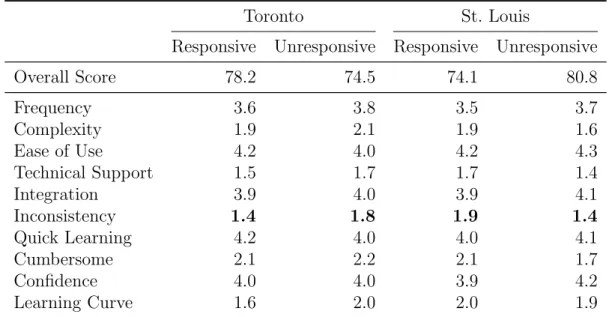
We also look at the data collected from the system usability survey administered at the end of each condition. We compute the overall score according to the scheme originally laid out by Brooke in [10], which creates a cumulative score out of 100. According to a meta-analysis by Bangor et. al in [3], the experiment design scores in the upper section of the 2nd quartile for usability, as compared to 206 studies (containing 2,324 individual surveys in total). Table 6.3 displays the average scores for the survey, both overall and for each dimension, for each dataset and each condition. In both datasets, the difference in average inconsistency scores was statistically significant, with p=0.04 for the Toronto dataset and p=0.03 for the St. Louis dataset. However, the movement in average inconsistency scores across conditions is itself inconsistent, with higher inconsistency on the Toronto unresponsive condition, but lower inconsistency on the St. Louis unresponsive condition. The implications of this discrepancy are discussed in Chapter 7.
Toronto St. Louis
Responsive Unresponsive Responsive Unresponsive
Overall Score 78.2 74.5 74.1 80.8 Frequency 3.6 3.8 3.5 3.7 Complexity 1.9 2.1 1.9 1.6 Ease of Use 4.2 4.0 4.2 4.3 Technical Support 1.5 1.7 1.7 1.4 Integration 3.9 4.0 3.9 4.1 Inconsistency 1.4 1.8 1.9 1.4 Quick Learning 4.2 4.0 4.0 4.1 Cumbersome 2.1 2.2 2.1 1.7 Confidence 4.0 4.0 3.9 4.2 Learning Curve 1.6 2.0 2.0 1.9
6.5
Open Comments
As mentioned in Section 5.3, the SUS surveys were administered with an additional section for general comments. After reading through all of the comments from users, we summarize the main takeaways below:
1. The implementation was well-design and received positive feedback (as confirmed by the SUS data).
2. Users were overwhelmed or challenged by the size and density of the datasets.
3. Many users wanted additional tools, such as price and rating filters, neighborhood labels, and links to menus or crime reports.
4. A small number of users wrote that they did not notice a difference between the two conditions.
5. A general consensus that the restaurant map was harder to analyze than the crime map, due to the increased density of the restaurants as compared to the crimes.
These takeaways are discussed further in Chapter 7.
6.6
Relational Findings
While the comparison of the average number of clicks, hovers, etc. across conditions is informative, it does not speak directly to the changes in behavior that may be expected from changes in condition. In particular, the inclusion of an adaptive system, as discussed in Section 3.2, aims to reduce the effects of occlusion. If a user is able to see more relevant points more consistently, we do not necessarily expect the user to simply click more or less. Rather, we would expect that they would become moreefficient at performing whatever task they may hope to perform. In particular, we can examine two metrics which may reveal more about how changing conditions affect user behavior: the number of insights a user records per interaction, and the number of insights a user records per viewport transformation.
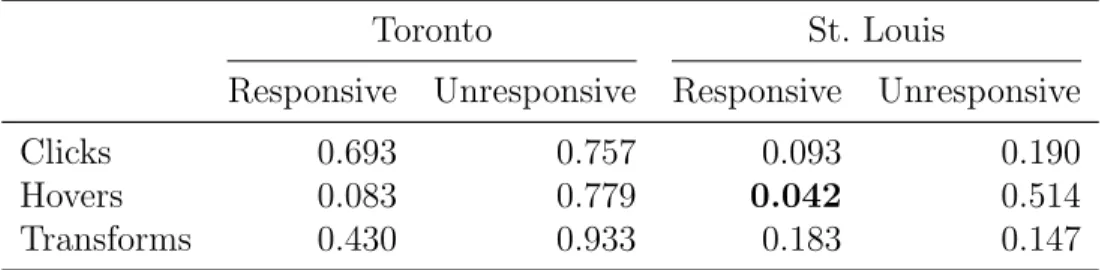
Toronto St. Louis
Responsive Unresponsive Responsive Unresponsive
Clicks 0.693 0.757 0.093 0.190
Hovers 0.083 0.779 0.042 0.514
Transforms 0.430 0.933 0.183 0.147
Table 6.4: p-values of regressions on clicks and hovers to predict number of insights. Statis-tically significant p-values (p < 0.05) are in bold.
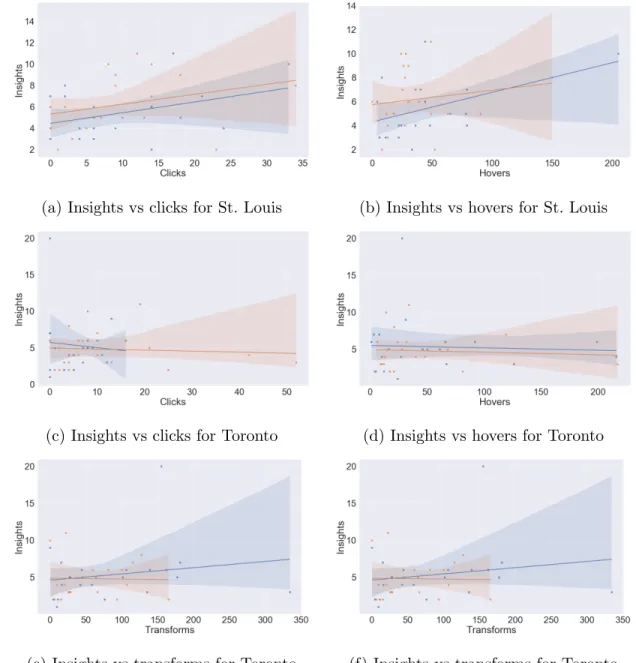
The two major interaction types that users performed were clicks and hovers; as a result, any changes in insights per interactions are likely to be observed with respect to these two types of interactions. Ordinary least squares regressions were run on the number of clicks, hovers, and viewport transformations that an individual performed during an experimental condition to predict the number of insights a user gathered during that same condition. A visualization of the regressions is shown in Figure 6.2; the F-statistic p-values of the slopes are shown in Table 6.4.
Ideally, the analysis of insights per interaction type would include a comparison of the slopes of different conditions; i.e. comparing the slope of the regression on clicks across responsive and unresponsive conditions. However, since none of the regressions themselves are statistically distinguishable form having slope of 0, a comparison across conditions may just amount to measuring comparisons of noise. As a result, that analysis is left out of the paper.
(a) Insights vs clicks for St. Louis (b) Insights vs hovers for St. Louis
(c) Insights vs clicks for Toronto (d) Insights vs hovers for Toronto
(e) Insights vs transforms for Toronto (f) Insights vs transforms for Toronto
Figure 6.2: Regression models on interactions and transformations to predict number of insights. Data from responsive conditions are inblue, data from unresponsive conditions are inorange.
Chapter 7
Discussion
Interpretation of the results presented in Chapter 6 must begin with a discussion of how users interacted with the visualization. The beginning of Chapter 6 discusses the fact that users did not interact with the visualization as much as expected; in particular, users did not click on the visualization as much as expected. This discrepancy between expectation and reality is likely due to a flaw in the experimental design: the information given on-hover was nearly identical to the information given on-click. This information parity means that there is no incentive for users to click on data points, other than to keep their information in a persistent state on the sidebar.
This breaking assumption is particularly problematic in the context of an experiment that relied on user clicks to trigger the experimental condition. This discrepancy is why Chapter 6 starts with an analysis of user clicks, and narrows the analysis to a group of users whose interactions met the expectations of the experimental design. However, this narrowed user group is not an ideal form of analysis; a better solution would be an experiment revision that addressed the design missteps causing the discrepancy between expectations and reality. Such a revision is discussed in Section 7.5. The rest of this chapter attempts to glean lessons and information from the results in Chapter 6 despite the experimental design flaws.
7.1
Statistically Significant Change in Zooms
The only statistically significant result in Tables 6.1, 6.2, and 6.3 is a change in the average number of zooms performed with the Toronto dataset. In particular, there is a significant
increase in the number of zooms under the responsive condition. This finding is difficult to interpret, especially since it did not hold across both datasets, and regressions on the number of viewport transformations did not show any statistical significance. It should be noted that one possibility is that this measurement arose form noise: this experiment aimed to measure a number of user interaction metrics, and enough measurements across enough dimensions could lead to an erroneous statistically significant measurement.
Another possibility is that users truly were driven to perform more zooms under the re-sponsive condition. This would likely indicate that the mixed-initiative system, using the re-drawing embedded reporting scheme, actually increases the need for users to zoom. This could be explained by considering that the higher-density nature Toronto dataset would create more occlusion overall, and so re-drawing datapoints could create a type of dynamic occlusion that is more difficult to deal with for users than static occlusion. However, this interpretation should be taken with a grain of salt, as the same analysis on the (marginally less dense) St. Louis dataset did show statistical significance.
7.2
Statistically Significant Inconsistency
The other statistically significant results were from the “inconsistency” section of the SUS survey, which showed that users perceived a decrease in inconsistency in the responsive condition of the Toronto dataset, but an increase in inconsistency of the responsive condition of the St. Louis dataset. This result forces the authors to consider that these results are further measurements of noise. Importantly, this survey data seems to run counter to the results about zooms discussed above. If the visualization was truly less inconsistent in the responsive condition of the Toronto dataset, that refutes the hypothesis that the “dynamic occlusion” created by re-drawing in the Toronto dataset causes confusion. Furthermore, if the inconsistency measurement was truly correlated to the number of zooms a user had to perform, we’d expect to either see a statistically significant decrease in the number of zooms in the responsive condition of the St. Louis dataset, or we’d expect to see no statistical significance in the inconsistency survey measure for the St. Louis dataset. These observations seem to support the hypothesis that the statistical significance of zooms in the Toronto dataset is indeed a statistically significant measure of noise.
7.3
Interpreting a Lack of Statistical Significance
It is tempting to state that the lack of statistically significant results to support the alterna-tive hypothesis means that we must accept the null hypothesis. That is, the easy conclusion is “the adaptive system did nothing”. However, it is more accurate to say that there is not enough evidence to reject the null hypothesis. Why is this a crucial distinction? Because it does not destroy any hope of an effective mixed-initiative system. Overall, it is important to note that these results should not dissuade researchers from further work on mixed-initiative systems like the one designed in this thesis. We acknowledge, even in the design, that the system this thesis uses is both flawed and not as powerful as it could be. It is entirely possible that further research and development could lead to promising new techniques and systems.
7.4
Lessons from Open Comments
The open comments section of the post-experiment surveys may provide another window into the analysis of this experiment. Some of these lessons are good: the fact that users found the visualization well-designed, yet were overwhelmed by the size and density of the datasets, indicates that the chosen datasets worked well to induce a need for an assistive or mixed-initiative agent to help users make sense of the data. However, it is problematic that some users did not notice a difference between the two conditions. It is entirely possible that these users just did not click enough to trigger the mixed-initiative system; this would require further analysis. However, it does raise the question of whether users should have been informed about the mixed-initiative system before using the visualization under the responsive condition. It is possible that being informed in that manner would have made them more aware of their “partner” in analysis, allowing them to take the re-drawings into further consideration and perhaps make more use of the mixed-initiative agent.
7.5
Future Work
This thesis is one towards the type of high-level mixed-initiate system that has been de-scribed by various visual analytics and human-computer interaction researchers over the years. A wide swath of work, some of it theoretical and some of it empirical, follows from the experiment laid out in this thesis.
7.5.1
Differentiate Modes of Information
As has been discussed multiple times in this chapter, the low number of user clicks caused by a discrepancy between experimental expectations and how users behaved may have impeded the mixed-initiative system from performing optimally or for all users. One simple fix for this would be to differentiate the modes of how a user receives information. For example, limiting hover information to just the name of a restaurant or the type of crime may have further incentivized users to use the sidebar differently, taking advantage of an increased display of information or its persistent state. However, this is a “band-aid” fix, as it only addresses a shortcoming of visual design; ideally, a more powerful agent would more fully solve this issue.
7.5.2
More Powerful Agent
The agent described in Sections 3.1 and 3.2 is incredibly powerful because its observations are described by a general mark and channel spaceM. Limiting the agent to observing clicks fails to take advantage of the full power of the agent’s formulation. In particular, expanded dynamic and observational models for the HMM could take advantage of user hovers, pans, and zooms to more accurately predict user attention. Furthermore, an expanded HMM model would alleviate the discrepancy discussed above by allowing the mixed-initiative agent to react to any interaction, and not rely as heavily on visualization design.
7.5.3
Further Analysis of Insights
The analysis of user insights performed in this paper only touches upon quantity, not quality or type. This was largely due to the time constraints of this paper; other studies in the field have developed methods for performing quantitative analysis of insights that take into account quantity, quality, and type. In particular, a paper by Saraiya, North, and Duca lays out a method for hand-coding insights into different categories, allowing them to perform more fine-grained analysis [41]; however, even those authors admit that the time-intensity of their method makes large-scale analysis difficult.
7.5.4
Expanded, Longitudinal Study
The study used in this thesis is of a type commonly employed in information visualization and visual analytics research, getting non-expert users to perform narrow, time-limited, and externally-motivated tasks. While this type of study undoubtedly has its use in preliminary analysis, a longer study which deploys the adaptive system described in Chapter 3 to expert users in their everyday environments (such as the study described by Saraiya et. al [42]) would allow for a more holistic analysis of the effect that such systems have on users.
Chapter 8
Conclusion
This thesis lays out the design of a mixed-initiative systems, and investigates the effect of the system on user interaction and system usability. It does so by laying out a visualization system, created from first principles and without regard to an underlying or linked adaptive system. It then builds a mixed-initiative system by outlining how an existing predictive algorithm can be employed as a real-time computer agent, providing feedback and guidance to a user in the form of a novel redrawing technique. Finally, the thesis lays out the experimental design itself, outlining the two-by-two format that allows for a compromise of generalizability and study integrity, and analyzing the findings.
The authors of the thesis believe this to be the first mixed-initiative adaptive system based on a design-agnostic algorithm that does not rely ona prior knowledge of the visual system in use. The technique of providing feedback to the user via responsive re-order of the z-index of visual elements is also believed to be novel.
Although the results were largely found to be statistically insignificant, the authors point to a body of future work that can be performed to refine the experiment and create a more rigorous and robust mixed-initiative system.
References
[1] James F Allen. Mixed-Initiative Interaction. IEEE Intelligent Systems and Their Ap-plications, 14(5):14–16, 1999.
[2] Amazon. Mechanical Turk, 2020.
[3] Aaron Bangor, Philip T Kortum, and James T Miller. An Empirical Evaluation of the System Usability Scale. International Journal of Human–Computer Interaction, 24(6):574–594, 2008.
[4] Scott Bateman, Regan L. Mandryk, Tadeusz Stach, and Carl Gutwin. Target assistance for subtly balancing competitive play. Conference on Human Factors in Computing Systems - Proceedings, pages 2355–2364, 2011.
[5] Leilani Battle, Peitong Duan, Zachery Miranda, Dana Mukusheva, Remco Chang, and Michael Stonebraker. Beagle: Automated extraction and interpretation of visualizations from the web.Conference on Human Factors in Computing Systems - Proceedings, 2018-April, 2018.
[6] Leilani Battle and Jeffrey Heer. Characterizing Exploratory Visual Analysis: A Liter-ature Review and Evaluation of Analytic Provenance in Tableau. Computer Graphics Forum, 38(3):145–159, 2019.
[7] Jacques Bertin. Semiology of graphics; diagrams networks maps. Technical report, 1983. [8] Enrico Bertini and Denis Lalanne. Surveying the complementary role of automatic data analysis and visualization in knowledge discovery. In Proceedings of the ACM SIGKDD Workshop on Visual Analytics and Knowledge Discovery, VAKD ’09, pages 12–20, 2009. [9] Paul Booth, Nicholas Gibbins, and Spyros Galanis. Towards a Theory of Analytical Behaviour: A Model of Decision-Making in Visual Analytics. In Proceedings of the 52nd Hawaii International Conference on System Sciences, 2019.
[10] John Brooke. SUS - A quick and dirty usability scale. Usability evaluation in industry, 189(194):4–7, 1996.
[11] Stuart Card. Information Visualization. Human-computer interaction: Design issues, solutions, and applications, 181(2), 2009.
[12] Stuart K. Card, Jock D. Mackinlay, and Ben Shneiderman. Information visualization: using vision to think. In Readings in information visualization: using vision to think. 1999.
[13] Joel Chan, Joseph Chee Chang, Tom Hope, Dafna Shahaf, and Aniket Kittur. Solvent: A mixed initiative system for finding analogies between research papers. Proceedings of the ACM on Human-Computer Interaction, 2(CSCW), 2018.
[14] Wenqiang Cui. Visual Analytics: A Comprehensive Overview. IEEE Access, 7:81555– 81573, 2019.
[15] Daniela D’Aloisi, Amedeo Cesta, and Rodolfo Brancaleoni. Mixed-Initiative Aspects in an Agent-Based System. 1996.
[16] Sebastian Deterding, Jonathan Hook, Rebecca Fiebrink, Marco Gillies, Jeremy Gow, Memo Akten, Gillian Smith, Antonios Liapis, and Kate Compton. Mixed-initiative creative interfaces. Conference on Human Factors in Computing Systems - Proceedings, Part F1276:628–635, 2017.
[17] A. Endert, W. Ribarsky, C. Turkay, B. L.William Wong, I. Nabney, I. D´ıaz Blanco, and F. Rossi. The State of the Art in Integrating Machine Learning into Visual Analytics.
Computer Graphics Forum, 36(8):458–486, 2017. [18] Facebook. React, 2020.
[19] Mi Feng, Cheng Deng, Evan M. Peck, and Lane Harrison. HindSight: Encouraging Ex-ploration through Direct Encoding of Personal Interaction History. IEEE Transactions on Visualization and Computer Graphics, 23(1):351–360, 2017.
[20] David Gotz and Michelle X. Zhou. Characterizing users’ visual analytic activity for insight provenance. In 2008 IEEE Symposium on Visual Analytics Science and Tech-nology, pages 123–130. IEEE, oct 2008.
[21] Tovi Grossman. The bubble cursor: enhancing target acquisition by dynamic resizing of the cursor’s activation area. In Conference on Human Factors in Computing Systems, pages 281–290, 2005.
[22] Andrew Head, Elena Glassman, Gustavo Soares, Ryo Suzuki, Lucas Figueredo, Loris D’Antoni, and Bj¨orn Hartmann. Writing reusable code feedback at scale with mixed-initiative program synthesis. Proceedings of the 4th ACM Conference on Learning at Scale, pages 89–98, 2017.
[23] Marti A Hearst. Introduction to Essays on Mixed-Initiative Systems. IEEE Intelligent Systems and Their Applications, 14(5):14, 1999.
[24] Jeffrey Heer and Ben Shneiderman. Interactive dynamics for visual analysis. Queue, 10(2):30–55, 2012.
[25] Eric Horvitz. Principles of Mixed-Initiative User Interfaces. In Conference on Human Factors in Computing Systems, pages 159–166, 1999.
[26] Mikkel R. Jakobsen and Kasper Hornbæk. Interactive visualizations on large and small displays: The interrelation of display size, information space, and scale. IEEE Trans-actions on Visualization and Computer Graphics, 19(12):2336–2345, 2013.
[27] Daniel Keim, Gennady Andrienko, Jean Daniel Fekete, Carsten G¨org, J¨orn Kohlham-mer, and Guy Melan¸con. Visual analytics: Definition, process, and challenges. In
Lecture Notes in Computer Science (including subseries Lecture Notes in Artificial In-telligence and Lecture Notes in Bioinformatics), volume 4950 LNCS, pages 154–175, 2008.
[28] Daniel a Keim, Florian Mansmann, Jim Thomas, and Daniel Keim. Visual Analyt-ics: How Much Visualization and How Much Analytics? ACM SIGKDD Explorations Newsletter,