EFFECTS OF DIAGRAMS ON STRATEGY CHOICE IN PROBABILITY PROBLEM SOLVING
Chenmu Xing
Submitted in partial fulfillment of the requirements for the degree of
Doctor of Philosophy under the Executive Committee of the Graduate School of Arts and Sciences
COLUMBIA UNIVERSITY 2016
© 2016 Chenmu Xing All rights reserved
ABSTRACT
EFFECTS OF DIAGRAMS ON STRATEGY CHOICE IN PROBABILITY PROBLEM SOLVING
Chenmu Xing
The role of diagrammatic representations and visual reasoning in mathematics problem solving has been extensively studied. Prior research on visual reasoning and problem solving has provided evidence that the format of a diagram can modulate solvers’ interpretations of the structure and concept of the represented problem information, and influence their problem solving outcomes. In this dissertation, two studies investigated how different types of diagrams influence solvers’ choice of solution strategy and their success rate in solving probability word problems. Participants’ solution strategies suggested that problem solvers tended to construct solutions that reflect the structure of a provided diagram, resulting in different representations of the mathematical structure of the problem. For the present set of problems, a binary tree or a binary table tends to steer solvers to use a sequential-sampling strategy, which defines simple or conditional probabilities for each selection stage and calculates the intersection of these
probabilities as the final probability value, using the multiplication rule of probability. This strategy choice is structurally matched with the diagrammatic structure of a binary tree or a binary table, which represents unequally-likely outcomes at the event level. In contrast, an N-by-N (outcome) table steers solvers to use of an outcome-search strategy, which involves searching for the total number of target outcomes and all the possible outcomes at the equally-likely outcome level, and calculates the part-over-the-whole value as the final probability, using the classical definition of probability. This strategy is strongly cued by the N-by-N (outcome) table, because the table structure represents all equally-likely outcomes for a probability problem, and
organizes the information so that the target outcomes can be seen as a subset embedded in the whole outcome space. When an N-ary (outcome) tree was provided, choices were split between the two solutions, because the N-ary tree structure not only cues searching for equally-likely outcomes but also organizes the problem information in a sequential-sampling, stage-by-stage way. Furthermore, different diagrams seem to be associated with different patterns of
characteristic errors. For example, solving a combinations problem with an N-by-N table tended to elicit erroneous solutions involving miscounting those self-repeated combinations represented by the table’s diagonal cells as valid outcomes. Typical errors associated with the use of a binary tree involved incorrect value definitions of the conditional probability of the outcome of a selection. And the N-ary tree may lead to less successful coordination of all the target outcomes for the studied problems, because the target outcomes were dispersed in the outcome space depicted by the tree, thus not salient.
The findings support arguments (e.g., Tversky, Morrison, & Betrancourt, 2002) that in order to promote problem solving success, a diagrammatic representation must be carefully selected or designed so that its structure and content can be well-matched to the problem structure and content. And for computational efficiency, information should be spatially organized so that it can be processed readily and accurately. In addition to the implications for effective diagram design for problem solving activities, the findings also offer important insights for probability education. It is suggested that a variety of diagram types be utilized in the
educational activities for novice learners of probability, because they tend to highlight different probability concepts and structures even for the same probability topic.
i TABLE OF CONTENTS LIST OF TABLES ... v LIST OF FIGURES ... vi ACKNOWLEDGEMENTS ... ix CHAPTER I: INTRODUCTION ... 1
Background of the Problem ... 1
Overview of the Present Research ... 4
Significance of the Research ... 7
CHAPTER II: LITERATURE REVIEW ... 9
Visual Representations in Mathematics Problem Solving ... 9
Applications of Visual Representations in Mathematics Activities ... 9
Effects of Visual Representations on Mathematics Problem Solving ... 10
Taxonomy of Visual Representations in Mathematics Problem Solving ... 11
Diagrams in Mathematics Problem Solving ... 13
Definition of a Diagram ... 13
Functions of Diagrams in Problem Solving ... 13
Diagrams and Mathematics Problem Solving Success ... 15
Principles for Effective Diagram Design ... 17
Diagrams for Probability Problem Solving for the Current Study ... 18
Tree versus Table: Structures and Applications ... 19
Probability Concepts and Problem Types ... 20
Structural Compatibility between Diagrams and Probability Problems ... 22
ii
Method ... 29
Participants ... 29
Materials ... 30
Design and Procedure ... 33
Results ... 34
Coding ... 34
Statistics Training Experience by Test Form ... 36
Analysis of the Work-Group (Combinations) Problem: Effects of the N-by-N Table versus the Binary Tree ... 36
Strategy choice ... 36
Solution Success ... 38
Error Analysis ... 38
Discussion ... 40
Analysis of the Spinner (Independent Events) Problem: Effects of the N-by-N Table versus the N-ary Tree ... 41
Strategy Choice ... 42
Solution Success ... 43
Error Analysis ... 43
Discussion ... 44
CHAPTER IV: STUDY 2 ... 46
Method ... 48
Participants ... 48
iii
Design and Procedure ... 50
Results ... 51
Coding and Scoring ... 51
Mathematics Training Experience by Condition ... 51
Strategy Choices by Diagram ... 53
Solution correctness by diagram ... 57
Discussion ... 59
CHAPTER V: GENERAL DISCUSSION ... 64
Summary ... 64
Implications ... 67
Limitations and Future Directions ... 69
REFERENCES ... 71
APPENDIX A: STUDY 1 TASK MATERIALS ... 76
Form A: Problems, Instructions, and Diagrams ... 76
Form B: Problems, Instructions, and Diagrams ... 77
Form C: Problems, Instructions, and Diagrams ... 78
Demographics Survey ... 79
APPENDIX B: STUDY 2 TASK MATERIALS ... 80
Form A: Problems and Diagrams ... 80
Form B: Problems and Diagrams ... 84
Filler Problems for Both Forms ... 88
iv
LIST OF TABLES
CHAPTER II: LITERATURE REVIEW ... 9
Table 1. Key Probability Concepts (and Distinctions) Underlying the Probability Topics ... 21
CHAPTER III: STUDY 1 ... 29
Table 2. Study Design and Test Forms for Study 1 ... 33
Table 3. Strategy Choices and Correctness for the Work-Group Problem by Diagram Type ... 37
Table 4. Strategy Choices and Correctness for the Spinner Problem by Diagram Type ... 42
CHAPTER IV: STUDY 2 ... 46
Table 5. Undergraduate Majors and Post-Secondary Mathematics Courses Taken by Participants in Study 2 ... 53
Table 6. Frequencies of Strategy Choices and Correctness for the Four Problems by Diagram Condition (Standard Deviations in Parentheses) ... 54
Table 7. Omnibus Test of Diagram Effects on the Use of the Outcome-Search Strategy ... 55
Table 8. Specific Comparisons between the No-Diagram Condition and Each Diagram Condition on Use of the Outcome-Search Strategy ... 56
Table 9. Omnibus Test of Diagram Effects on the Use of the Sequential-Sampling Strategy ... 57
Table 10. Specific Comparisons between the No-Diagram Condition and Each Diagram Condition on Use of the Sequential-Sampling Strategy ... 57
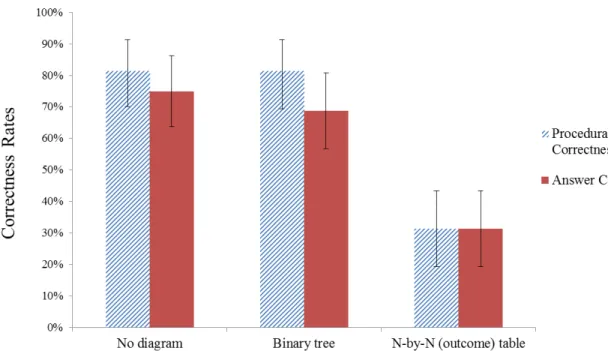
Table 11. Omnibus Test of Diagram Effects on the Procedural Correctness Rates ... 59
Table 12. Specific Comparisons between the No-Diagram Condition and Each Diagram Condition on the Procedural Correctness Rates ... 59
v
LIST OF FIGURES
CHAPTER II: LITERATURE REVIEW ... 9
Figure 1. An annotated N-by-N table for a combinations problem ... 23
Figure 2. An annotated N-by-N table for an independent events problem ... 23
Figure 3. An annotated binary tree for a combinations problem ... 24
Figure 4. An annotated binary table for a combinations problem ... 24
Figure 5. An annotated N-ary tree for a combinations problem ... 25
CHAPTER III: STUDY 1 ... 29
Figure 6. Tree for the Spinner problem ... 31
Figure 7. Table for the Spinner problem ... 32
Figure 8. Tree for the Work-Group problem ... 32
Figure 9. Table for the Work-Group problem ... 32
Figure 10. Two solution strategies for the Work-Group problem ... 35
Figure 11. Two solution strategies for the Spinner problem ... 35
Figure 12. Frequencies of strategy choices for the Work-Group problem by diagram type ... 37
Figure 13. Correctness rates for the Work-Group problem by diagram type ... 38
Figure 14. A common misuse of the N-by-N table ... 39
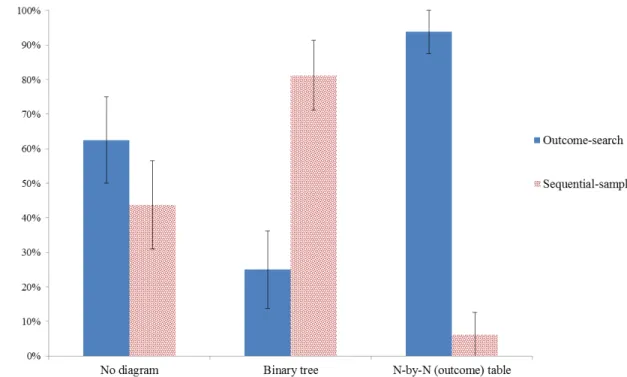
Figure 15. Frequencies of strategy choices for the Spinner problem by diagram type ... 43
Figure 16. Correctness rates for the Spinner problem by diagram type ... 44
CHAPTER IV: STUDY 2 ... 46
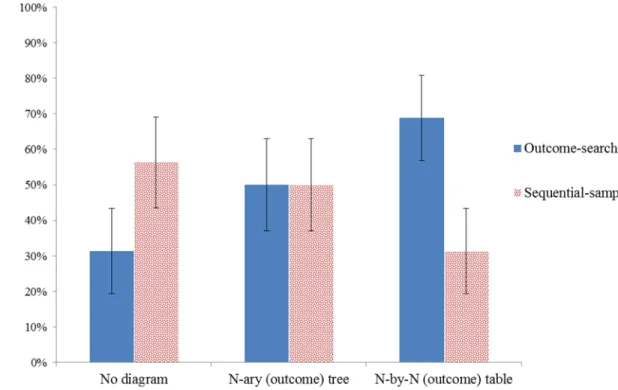
Figure 17. Frequencies of strategy choices for the four problems by condition in Study 2 ... 54
vi
ACKNOWLEDGEMENTS
First and foremost, I would like to thank my advisor, Professor James Corter, for his mentorship and support over the course of my study. Thank you for your invaluable and step-by-step guidance on my dissertation and other research work, and also giving me a desirable amount of independence to think and explore ideas. You have helped me to see my potential and have motivated me to work hard on realizing it. You have fostered in me an ever-growing mindset, faith and passion for carrying on my research. For your contributions to my growth and your profound impact on me, I am eternally grateful.
Thank you to the rest of my committee members, Professors Barbara Tversky, Stephen Peverly, Roger Anderson, and Doris Zahner, for your important feedback and warm support at all stages of my dissertation work.
I also gratefully acknowledge Springer’s Lecture Notes in Computer Science as the original source of publication for portions of my dissertation to appear. These parts, including but not limited to the description of Study 1 in Chapter 3, are included in a version accepted for publication that can be cited as follows: Xing, C., Corter, J. E., & Zahner, D. (2016). Diagrams affect choice of strategy in probability problem solving. In M. Jamnik, Y. Uesaka, & S. Elzer Schwartz (Eds.), Lecture Notes in Computer Science (LNCS): Diagrammatic Representation and
Inference (Vol. 9781, pp. 3-16). Heidelberg, Germany: Springer.
In addition, I would like to thank Professor Catherine Chase for being another great source of inspiration and thoughts during my doctoral study. Thank you for your valuable advice and all the opportunities you have given me to expand my research and teaching practice in this field. It is truly pleasant to work with you.
vii
I am thankful to Professors John Black and Catherine Chase for letting me recruit
research participants from their classes. I am also thankful for Myra Luna-Lucero and other IRB personnel at TC, whose hard work facilitated the timely completion of my data collection.
I am grateful for the friendship and support from many fellow doctoral students in my department and other important friends. Thank you to Lina (Na Li), Carol Lu and Laura Lu, for all the happiness, help, and encouragement you have given me throughout my graduate school study. Besides all the fun and laughter we have shared, thank you for having kept me strong, encouraged, and perseverant when I face difficult times and self-doubts. Thank you to Sehrish Jamshed, Yangyang Liu, Maria “Sweet” San Pedro, Kristen Bundy, Jie Gao, and many other friends and colleagues at Teachers College. Thank you for your friendship and the insights you have given to my study or life. I am also wholeheartedly grateful to Hong Fan and the rest of the Yu family, Aimee Tiu Wu and the rest of the Wu family, and Joanne Park. You have made the definition of “friend” so close to “family”. Your thoughtfulness and hospitality over all these years have made my stay here a better and more memorable experience. And to Mingxing Wu, thank you for your love and endless support, which is beyond words to describe how important it has been for me to complete the doctoral study.
Lastly, I would like to express my deepest gratitude to my parents and grandparents. Especially to my mother, thank you for always listening to my academic experiences, reflections and research thoughts with great patience and cheering for me all the time. Thank you for always encouraging me to look on the bright side whenever a challenge or disappointment happens. Thank you for supporting me in every possible way so that I can realize my dreams. To your love, patience, support and full faith in me, I owe my accomplishments. This work is dedicated to you.
1
CHAPTER I: INTRODUCTION Background of the Problem
Diagrams are essential tools for representation, communication, and reasoning. In education, diagrams have been used widely, and play an important role in STEM learning and problem solving (e.g., Hegarty & Kozhevnikov, 1999; Heiser & Tversky, 2006; Lowrie & Kay, 2001; Manalo & Uesaka, 2006; Presmeg, 1986a, 1986b; Zahner & Corter, 2010; Novick & Catley, 2013), learning and comprehension of complex systems (Heiser & Tversky, 2006), judgment (Gattis & Holyoak, 1996; Simkin & Hastie, 1987), reasoning (Tversky, Corter, Gao, Tanaka, & Nickerson, 2013), analogical transfer (Gick & Holyoak, 1983; Novick, 1990),
planning (Mason, Corter, Tversky & Nickerson, 2012), and data representation and interpretation (Braithwaite & Goldstone, 2013; Zacks & Tversky, 1999).
But like any tool, a diagram must be well chosen for the task at hand, and its use affects both the process and the product of the activity. First, as an external representation of a
cognitive or educational problem, salient aspects of the diagram must map to relevant aspects of the problem (Markman, 1999; Novick and Hurley, 2001). Second, structural, visuospatial, and implicit aspects of the chosen diagram can influence and alter people’s perceptions, inferences, and judgments of the relations and structures of the represented information (e.g., Gattis & Holyoak, 1996; Tversky, Corter, Gao, Tanaka, & Nickerson, 2013; Zacks & Tversky, 1999). How a diagram steers people to certain inferences and judgments concerning the represented concepts and relations is not arbitrary. Rather, it stems from cognitively natural ways of mapping visuospatial elements and relations to conceptual content and relations, externally or internally, based on shared metaphorical (or analogous) similarity of abstract relational structures (e.g.,
2
Gattis, 2004; Gattis & Holyoak, 1996; Novick & Hurley, 2001; Tversky, Kugelmass, & Winter, 1991).
A rich body of research has explored how specific types of diagrams affect inferences in reasoning and judgment tasks. When asked to describe the relation of individual data points shown in statistical graphs, people given a bar graph tended to describe the relation as comparisons of discrete entities, but as trends of continuous change when given the same information depicted as a line graph (Zacks & Tversky, 1999; Shah, Mayer, & Hegarty, 1999). To describe complex mechanical systems depicted by diagrams, people reading mechanical diagrams with arrows described the functions of the systems, whereas those reading the same diagrams without arrows gave structural descriptions (Heiser & Tversky, 2006). When people tried to keep track of individuals’ locations over different time points, data depicted in lines that connected individuals’ locations over time led to use of people as the dominant information organizer and their movements over time as the structure of the description. On the other hand, when separate dots were entered in the location-by-time cells to represent individuals, people’s attention was directed to the table cells and they were more likely to summarize information by group of people by location (Tversky et al., 2013).
People’s inferences using diagrams are systematically related to the schemas that
different types of diagrams convey. For example, lines connect and associate entities, indicating paths, relations, and movement (Tversky et al., 2013; Tversky, Zacks, Lee, & Heiser, 2000; Zacks & Tversky, 1999); bars and boxes suggest enclosures and separate categories (Tversky et al., 2013; Zacks & Tversky, 1999); and arrows show asymmetric directions and sequences from actions to goals and causes to effects (Heiser & Tversky, 2006; Tversky et al., 2000).
3
Furthermore, the degree to which diagram structures can be analogically mapped onto problem structures, achieving the correct mapping, not only affects the type of inferences people make in reasoning and judgment tasks, but it also has a great impact on problem solving success. Research evidence (e.g., Braithwaite & Goldstone, 2013; Gattis & Holyoak, 1996; Novick & Hurley, 2001; Simkin & Hastie, 1987) suggests that a high degree of visual-conceptual
compatibility often leads to higher accuracy and faster speed in problem solving. For example, in Gattis and Holyoak’s (1996) rate of change judgment tasks, people were given a line graph depicting the relation between two variables, and were asked to infer how the rate of one variable changes with the increase of the other variable. Their findings consistently suggest that for problem solving accuracy, it is crucial for the variable of cause (e.g., the IV) to be assigned to the x-axis and the queried variable (e.g., the DV) to the y-axis, because graph users regularly follow such a mapping convention that a steeper line on the graph indicates faster changes in the y-axis and the queried variable. Violation of the suggested visual-conceptual mapping conventions in graph use leads to significantly lower rates of correct judgment. In a statistical judgment task, Braithwaite and Goldstone (2013) found that people given a line graph depicting the interaction of data points were able more quickly to infer the interaction effect of two variables without loss of accuracy, compared to those using a tabular representation of the data. Hurley and Novick (2010) compared people’s accuracy and speed in making inferences about the information that was represented by following and violating diagrams. With a convention-violating representation (e.g., objects assigned to the lines and relations assigned to the nodes in a network diagram), solvers took longer time to make inferences, which were also more
erroneous. Zahner and Corter (2010) tested the relation of probability problem solvers’ choice of diagrams and their problem solving outcomes. They found that problem solving success was
4
promoted by diagrams, but only when a representation was appropriately matched to a problem type (e.g., Venn diagrams for joint event probability). When Simkin and Hastie (1987) compared the effects of various types of graphs in judgment tasks, bar graphs led to highest accuracy in judging comparisons, while pie charts were most facilitative for judging proportions.
Diagram theorists interpret this kind of phenomena as demonstrating interplay between graph features and problem information types on facilitating or biasing perception and judgment (e.g., Pinker, 1990; Simkin & Hastie, 1987; Zacks & Tversky, 1999). According to Pinker (1990), a diagram itself does not possess universal advantage or disadvantage for information processing. The features of a diagram interact with the types of information to be represented so that the extraction of certain information or structures may be facilitated by certain diagram types but hindered by some other diagram types. Tversky, Morrison, and Betrancourt (2002) proposed two principles for effective graphic design that facilitate information extraction, comprehension, and inference using graphs. The Congruence Principle, based on the cognitive naturalness of visual-conceptual mappings, emphasizes compatibility between the structure and content of a graph and the desired structure and content of the information to be represented. The Apprehension
Principle emphasizes optimal organization and display of information so that it can be perceived readily and accurately.
Overview of the Present Research
The present research gathers evidence that can be used to evaluate theories of WHY diagrams are useful in reasoning, learning and problem solving, and WHEN diagrams are useful. More specifically, the goal is to investigate how structural and content compatibility between diagrams and problems might apply in probability problem solving. Based on the theories and evidence reviewed earlier, we argue that in mathematics problem solving, appropriate diagrams
5
both direct solvers’ attention to the underlying mathematical structures via cognitively natural correspondences, and help to organize problem information to facilitate the coordination of sub-goals and computational stages in the process of problem solving.
Elementary probability problems can sometimes be solved by more than one appropriate solution method. For example, problems are used here that can be solved using strategies based on two distinct probability concepts, the classical definition of probability and the multiplication rule of probability. However, applied probability problems describe a wide variety of real-world situations. Based on evidence from related work (as yet unpublished), I believe that the semantic aspects of these problems evoke interpreted problem structures that may or may not map
naturally to one or more probability concepts and solution strategies underlying these problems. It is predicted that providing an appropriate diagrammatic representation can highlight the underlying problem concept and structure as its diagrammatic structure and components will map to the probability concept.
In the current investigation on diagram effects, we focus on tree diagrams and tables, because they are among the most commonly used diagrams in probability education and problem solving (e.g, Russell, 2000; Zahner & Corter, 2010). Research suggests that these two types of diagrams are often used by problem solvers to represent different probability situations and schemas (e.g., Corter & Zahner, 2007; Novick, 1990; Novick & Hmelo, 1994; Zahner & Corter, 2010). In probability problem solving, N-by-N tables are frequently used to represent all possible combinations for compound-events problems (e.g., Novick, 1990), while outcome trees seem especially appropriate for situations involving sequential selection (e.g., Novick & Hmelo, 1994). Zahner and Corter (2010) found that using tree diagrams was particularly useful for solving conditional probability problems, a type of probability problem that involves reasoning about
6
sequential processes and dependent events. These observations and empirical findings suggest that the structures of trees and tables may be best for representing different problem structures and probability concepts, and may facilitate solution of different types of probability problems. However, this effect has only been demonstrated or hypothesized for a few specific problem instances. The current research aims to specify and summarize the types of probability problems where trees and tables are best suited for problem representation, and to explain these benefits in reference to specific aspects of the diagrams and visual reasoning processes in understanding probability concepts and procedures.
In this research, the aim is to test diagram effects in the domain of probability problem solving. The studies described below explore how using different types of diagrams can affect both the process (strategy choice) and the product (solution success) in probability problem solving. Specifically, the studies investigate whether and how different types of diagrams can steer probability problem solvers to choose one solution strategy or another for solving
probability problems that admit of multiple types of solution strategies. Specifically, four types of generic (i.e., unlabeled) diagrams are used as potential aids in problem solving: binary trees, N-ary (outcome) trees, binary tables, and N-by-N (outcome) tables. By comparing the effect of these different diagrams on solvers’ choice of solution strategy and solution correctness, the two studies of this dissertation seek to answer the following research questions:
Do different types of diagrams for representing probability problems elicit the use of different solution strategies?
Do appropriately chosen diagrams increase solution correctness rates, compared to no diagram given? Does an ill-chosen diagram hurt performance?
7
If such effects are found, what aspects of the diagram seem to account for the differences in strategy choices and may be instrumental to obtain the facilitative effect?
Significance of the Research
The current research has the potential to add three distinctive contributions to research on the role of diagrams in thinking, reasoning, and STEM education.
First, the current research expands the ways in which visual representations have been shown to influence the thinking process and outcomes in cognitive activities. Prior studies have predominantly focused on how diagrams can influence the outcomes of reasoning, such as inferences and judgment (e.g., Heiser & Tversky, 2006; Tversky et al., 2013; Zacks & Tversky, 1999), or the accuracy or speed of problem solving and transfer (e.g., Gattis & Holyoak, 1996; Mason et al., 2012; Sanfey & Hastie, 1998). This research aims to produce empirical evidence that diagrams also affect how people formulate or select solution strategies in the process of problem solving.
Second, this research investigates the particular aspects of tables and tree diagrams that might affect problem solving, beyond their general structure type. Previous investigations have focused on the global structures and applications of schematic diagrams such as tables and tree diagrams in their general format (e.g., Novick & Hurley, 2001; Novick, Hurley, & Francis, 1999), or on the features and applications of some specific variants of a diagram such as cladograms and polygenetic trees (e.g., Novick & Catley, 2013; 2014). The second study described below
systematically manipulates the levels of information abstraction in tables and tree diagrams, to test how this type of visual representation feature interacts with the general structure type of a diagram to affect choice of solution strategy and solution correctness.
8
Lastly, the current research expands the study of diagram effects on reasoning
specifically in the domain of statistics and probability learning and problem solving. The studies explore the issue of compatibility of diagram structures and probability problem structures, and its effect on solvers’ choice of mathematical solution strategies and solution accuracy. The results should have important educational implications for statistics and probability education, because they address how effective visual representations can be designed to facilitate the conceptual understanding of probability and the procedural flexibility for solving its problems, and the factors that might affect novice problem solvers’ choices of formal solution strategies. This dissertation is divided into five chapters. Chapter One provides the background of the problems explored in this dissertation, the goal of the research, and the research questions posed. Chapter Two presents a review of the literature related to the research questions. Chapters Three and Four report the two studies conducted to address the research questions. These two chapters describe in detail the research methodologies including the design, procedure, and test materials. Analysis results and some discussions are also provided following the description of methodology. This dissertation is then concluded by Chapter Five, which provides an overall and general discussion that synthesizes the results of the two studies and the educational and
9
CHAPTER II: LITERATURE REVIEW
External visual representations, such as diagrams, have a great impact on perception, reasoning, and problem solving, in both mathematics and more general domains. This chapter is a review of the role of external visual representations, especially diagrams, in mathematics problem solving. The primary goal of this chapter is to answer why and when diagrams are useful for problem solving, with an additional focus on how appropriate and effective diagrams may be designed for representing probability problems, highlighting their underlying concepts and structures, and facilitating problem solving.
Visual Representations in Mathematics Problem Solving Applications of Visual Representations in Mathematics Activities
External visual representations play an important role in mathematics learning and problem solving (e.g., Arcavi, 2003; Barwise & Etchemendy, 1991; Bishop, 1989; Bruckheimer & Arcavi, 1995; Hadamard, 1945; Nemirovsky & Noble, 1997; Zahner & Corter, 2010). Use of external visual representations can be found in various types of mathematics activities. For example, visual representations are commonly seen in instructional materials and teaching activities (e.g., Banilower, Smith, Weiss, Malzahn, Campbell, & Weis, 2013; Dufour-Janiver, Bednarz, & Belanger, 1987; Fuson & Briars, 1990). Learners and problem solvers often
spontaneously create many forms of visualizations such as pictures, diagrams, and graphs across all stages of problem solving, e.g., problem comprehension and representation, reasoning, solution formulation, and solution explanations (e.g., Edens & Potter, 2008; Hegarty & Kozhevnikov, 1999; Presmeg, 1986a, 1986b; Zahner & Corter, 2010).
In these mathematics activities, a wide variety of types of visualizations have been used. Their forms of representation may vary largely, from concrete (e.g., pictures, manipulatives) to
10
abstract (e.g., symbols, graphs), and from static (e.g., diagrams) to dynamic (e.g., animations, gestures). These various types of visualizations serve multiple different purposes in mathematics. For example, external visualizations have been used to symbolize mathematical notations,
concepts, meanings, and formal solutions (Arcavi, 2003). Schematic diagrams such as tables, trees, and Venn diagrams, are important external visual devices for representing problem
information and cueing mathematics problem solutions (Novick, 1990; Polich & Schwartz, 1974; Schwartz, 1971; Schwartz & Fattaleh, 1972). Graphing, such as lines, bars and scatter plots, has been used as an important means for data representation, feature discovery, and pattern
interpretation, especially in statistics (e.g, Arcavi, 2003; Anscombe, 1973; Gattis & Holyoak, 1996: Pearson, 1895; Salkind, 2006; Zacks & Tversky, 1999).
Effects of Visual Representations on Mathematics Problem Solving
However, research on the effects of using visual images on mathematics problem solving has shown mixed findings (e.g., Hegarty & Kozhevnikov, 1999; Lean & Clements, 1981; van Garderen & Montague, 2003). For example, a correlational study (Lean & Clements, 1981) measured engineering students’ preference for using visual representations and their mathematics test performance. The results revealed that students who preferred to process mathematical information by verbal means tended to outperform those using visual means on the mathematics tests. The authors speculated that the poorer performance associated with visual reasoning was due to reliance on concrete pictorial representation of problem information, which distracted problem processing and solving with unnecessary information. Similarly, in Hegarty and Kozhevnikov’s study (1999) on the relationship between use of visual representation and students’ mathematics problem solving performance, it was found that not all visual representations were associated with higher problem solving success, but only those that
11
depicted the schematic structures of the problems. These findings, which revealed negative or mixed effects of using visual solutions on mathematics problem solving, are in conflict with the positive visual effects found by other studies (e.g., Lowrie & Kay, 2001; Webb, 1979).
Taxonomy of Visual Representations in Mathematics Problem Solving
To explain the contradictory findings of the role of visualizations in mathematics learning and problem solving, the research literature has suggested that different types of visual displays used in mathematics activities should be distinguished, and that their effects on facilitating
problem solving may vary, depending on their visual types and schemas. Presmeg (1986a, 1986b) distinguished five types of visual imagery in mathematics: pictorial imagery, schematic pattern imagery (e.g., diagrams), kinesthetic imagery, dynamic imagery, and memory for formulas.
Among these five different types of visual imagery that Presmeg has distinguished, it was suggested that the most effective visual representation format should be schematic pattern
imagery, because it removes concrete, mathematically irrelevant information from the problem information, and only displays the essential relations described in the problems. Use of concrete pictorial imagery, on the other hand, usually leads to a lower rate of success in mathematics problem solving (Hegarty & Kozhevnikov, 1999; van Garderen & Montague, 2003). Pictorial representations generally impair problem solving success, because the depictions often include irrelevant details for problem solvers to process, which distracts their attention from processing only the essential information and the underlying structure of the problem (Hegarty &
Kozhevnikov, 1999; Lean & Clements, 1981; Presmeg, 1986a, 1986b). That schematic diagrams facilitate mathematics problem solving has been supported by previous research. For example, Hegarty and Kozhevnikov (1999) studied how sixth grade students’ self-created visual
12
either primarily schematic (or diagrammatic) or primarily pictorial, based on whether a diagram or abstract spatial relations were depicted in their gestures or sketches. The results show that while the use of schematic diagrams was associated with higher problem solving success, the use of pictorial representations was associated with more problem solving failures. Similarly, Zahner and Corter’s study (2010) examined probability problem solvers’ spontaneous use of visual representations, and found that problem solving was more successful when diagrams were used, such as trees and Venn diagrams, but not when pictorial images were drawn. Gattis and Holyoak (1996) manipulated the assignment of an independent variable (altitude) to the x- or the y-axis of a line graph and explored how that affected graph users’ accuracy in judging the rate of change of the dependent variable (temperature) as the independent variable (altitude) changes. In one condition, they assigned the variable of altitude to the y-axis so that the graph observes a pictorial correspondence of “up” between the concept of altitude going “up” and the graphic depiction of the y-axis going “up”. In another condition, they assigned altitude to the x-axis and temperature to the y-axis so that the graph observes an abstract, schematic correspondence between the concept of temperature being the effect and the diagrammatic convention of the y-axis being the outcome variable. This reversed assignment of variables to axes did not observe the pictorial correspondence depicted for the other condition. Participants’ performance confirmed that accuracy was increased by the diagrammatic correspondence, but decreased by the pictorial correspondence.
In conclusion, previous research suggests that among all types of external visual
representations, diagrams may be the most facilitative type of external visual representation for mathematics learning and problem solving. Therefore, it is educationally important to examine closely the use of diagrams in mathematics problem solving and their effects in problem solving,
13
and to seek principles for designing or selecting effective diagrammatic representations as aids for problem solving.
In the following sections, the discussion will be focused on diagrams, used in the narrow sense of abstract schematic pattern representations. The role of diagrams in mathematics
reasoning and problem solving activities will be reviewed. Principles for effective diagram design will also be suggested.
Diagrams in Mathematics Problem Solving Definition of a Diagram
A diagram is defined as a type of graphic representation that depicts only abstract structures and spatial relationship without references to literal, quantitative, or context-specific information (Brasseur, 2003; Lowe, 1993). Examples of diagrams that are commonly used in mathematics (including statistics and probability) problem solving include tables, trees, Euler or Venn diagrams, and in a broad sense also graphs and charts such as pies, bars, lines, and
networks such as bipartite graphs.
Functions of Diagrams in Problem Solving
As stated earlier in this paper, diagrams facilitate mathematics problem solving,
compared to other types of visual representations such as pictures and icons. Then the question of interest becomes: how and why do diagrams facilitate mathematics problem solving?
This can be explained by the various functions that diagrams serve in general as well as in mathematics problem solving. Commonly acknowledged advantages of using diagrams over just the text information include that diagrams can ease the process of problem understanding by schematizing and simplifying information from problem text; and diagrams can increase
14
(e.g., Diezmann & English, 2001; Fagnant & Vlassis, 2013; Gagatsis & Shiakalli, 2004; Hegarty & Kozhevnikov, 1999; Larkin & Simon, 1987; Lowe, 1993; Presmeg, 1986b, 2006; Tversky, Morrison, & Betrancourt, 2002; Zahner & Corter, 2010).
To illustrate this point, Larkin and Simon (1987) contrasted the computational efficiency for processing information that is of the same quantity but represented in two different formats: sententially or diagrammatically. Sentential representations equalize the accessibility of
information across the text, thus making certain information implicit and less noticeable, or costing readers extra time and effort to extract the necessary information for use (Larkin & Simon, 1987). On the contrary, diagrammatic representations can make implicit text information explicit and easy to grasp, by organizing information by location on a plane, and by chunking and/or highlighting necessary information for processing and computation (Larkin & Simon, 1987). In addition, Gattis and Holyoak (1996) argued that sometimes graphs can integrate or reduce the number of steps or dimensions that are otherwise involved in purely sentential or mathematical solution procedure. This is argued to be an advantage over sentential
representation, because trying to coordinate information across various dimensions and stages often costs a heavy cognitive load (Gattis & Holyoak, 1996). Thus, information represented diagrammatically has often been found to be more easily recognized, coordinated, and computed (Gattis & Holyoak, 1996; Larkin & Simon, 1987).
Similar to this reason (e.g., Gattis & Holyoak, 1996; Larkin & Simon, 1987) given as to why diagrams facilitate information processing and computational efficiency, Winn (1989) argued that diagrams can simplify otherwise complex information described in narratives, and abstract necessary concepts from unnecessary or irrelevant details. For example, a food-chain diagram can metaphorically depict the roles of animals and their predator-prey relations more
15
efficiently than sentential descriptions (Winn, 1989). A map, as another example of schematic visual representation, eliminates photographic details of roads and architectures, and highlights essential information such as directions, locations, architecture categories, and altitudes (Winn, 1989). Such a diagrammatic representation is argued to increase efficient perception and access to essential information (Winn, 1989).
In addition to easing information processing and computations, several other functions of diagrams have also been identified that may explain why they help mathematics problem
comprehension and solving. Diagrams can be used for developing mathematical insights (e.g., Polya, 1957; Edens & Potter, 2008). They can provide external support to problem solvers’ internal representations and be used to offload intermediate computational results from working memory (Bauer & Johnson-Laird, 1993; Tversky, 2001). And diagrams can also serve as memory cues for problem solutions (e.g., Larkin & Simon, 1987; Novick & Hmelo, 1994; Novick, 1990; Phillips, Norris & Macnab, 2010; Stylianou & Silver, 2004).
Furthermore, using diagrams has been found to be particularly important or useful for solving complex or difficult problems (e.g., Bobek & Corter, 2010; Lowrie & Kay, 2001; Manalo & Uesaka, 2006; Webb, 1979). For difficult or complex problem solving, diagrams can help to coordinate sub-goals (e.g., Zahner & Corter, 2010); to simplify complex situations in the problems and make computations easier (Larkin & Simon, 1987; Lynch, 1990; Winn, 1989); and to offload intermediate calculation results (Schreiber, 2004; Tversky, 2001).
Diagrams and Mathematics Problem Solving Success
Although both theories and empirical evidence suggest that diagrams are powerful representational formats in reasoning and problem solving activities, research has also revealed
16
that diagrams are not invariably associated with problem solving success, nor are they effective for solving problems across all types (Zahner & Corter, 2010).
First, diagrams do not always improve problem solving performance, especially if their perceptual properties fail to conform to the problem schemas they try to represent or the graphing conventions (e.g., Gattis & Holyoak, 1996; Novick & Hurley, 2001). For example, Bauer and Johnson-Laird (1993) tested the effectiveness of different types of diagrammatic representations for syllogistic reasoning. The results showed that only those diagrams of which the spatial relations were depicted analogous to the structure and content of the problem
information significantly increased answer accuracy compared to no diagram given. On the other hand, when a diagram depicted problem elements and relations in a spatially arbitrary way, it even decreased answer accuracy compared to verbal reasoning only. In Hurley and Novick’s (2010) study, the results of diagram users’ performance in judgment tasks showed that convention-violating diagrams not only impaired answer accuracy but also prolonged the reaction time. Thus, Hurley and Novick (2010) concluded that effectiveness of diagrams for accurate and efficient problem solving requires that a diagram is constructed so that it facilitates
the perceptual inferences of the problem information.
Second, a diagram may be an appropriate representation for one type of problem, but not another, depending on the degree to which its structure and content can correspond to those of the problems. For example, in a study that examined the effect of various types of user-created visualizations on probability problem solving (Zahner & Corter, 2010), the results showed that the effectiveness of a diagram for problem solving was contingent on the types of probability problems it was created to represent. For example, the use of tree diagrams was found facilitative for solving problems of conditional probability and combinations, but not significantly so for
17
compound independent events or fundamental principles of combinatorics. The tree structure features conditional and hierarchical leveling (Novick & Hurley, 2001) and typically cues a temporal ordering schema (Zahner & Corter, 2010). This may explain why a tree diagram is particularly helpful for solving conditional probability and combinations problems, because it is structurally well-matched to the problem features, which involve sequential events and finding probabilities that are dependent of the previous event outcomes. However, such a visual schema may not always be essential for highlighting the probability concepts of compound independent events or fundamental counting principles, because events are independent of each other, and sometimes the efficient search for outcomes does not follow a temporal or hierarchical order.
Given the evidence reviewed above, the next question to be addressed is: what types of diagrams are effective for mathematics problem solving? Or in other words, what types of diagrams should mathematics educators provide to facilitate problem understanding, ease information processing and search, increase computational efficiency, and thus improve student problem solving?
Principles for Effective Diagram Design
Simply put, a diagram must be an appropriate representation of the problem information so that necessary information can be highlighted and accurately grasped for use. To be specific, Tversky, Morrison, and Betrancourt (2002) have suggested two cognitive principles for effective diagram design: the Principle of Congruence and the Principle of Apprehension. The Principle of Congruence requires the content and structure of a diagram to be consistent with the content and structure of the problem that it is used to represent; the Principle of Apprehension suggests that the information and schema that a diagram conveys must be organized so that it can be easily noticed and grasped (Tversky, Morrison, & Betrancourt, 2002).
18
Practically speaking, that means an effective diagram must be designed or selected to share a high structural similarity with the type of problem it is to represent in order to facilitate problem solving. Why is this structural compatibility between a diagram and a problem type particularly important? I believe this can be explained by the cognitively natural correspondences between perceptual properties and nonvisual concepts, and the graphing and communicative conventions that graph authors and viewers regularly observe (Zacks & Tversky, 1999).
Furthermore, research evidence has suggested that these visual-conceptual correspondences and graphic use conventions are not only consistently followed by experienced graph authors and users (Novick & Hurley, 2001), but also by people without awareness or explicit knowledge of these conventions (Zacks & Tversky, 1999).
To conclude, different types of diagrams are applicable to different situations, and are usually facilitative only for solving those problems of which they are appropriate visual
representations. Different types of appropriate diagrammatic representations may lead problem solvers to extract different types of information depending on their unique perceptual structures, perceive and interpret the structure of a mathematics problem differently, and thus choose different solutions (Gattis & Holyoak, 2004; Pinker, 1990; Zacks & Tversky, 1999). The degree of shared structural similarity between a diagram and a problem type can also affect problem solving success, so that a higher structural compatibility may lead to a higher rate of solution success.
Diagrams for Probability Problem Solving for the Current Study
In this dissertation, two types of diagrams, namely trees and tables, are examined in terms of their effect on solving probability problems of different topics. Trees and tables have been commonly-used visual representations in probability education and problem solving activities
19
(Bobek & Corter, 2010; Russell, 2000; Zahner & Corter, 2010). However, they differ in their diagrammatic structures (Novick & Hurley, 2001), and thus may highlight different schematic information about a probability problem, and lead to different inferences and ways of using the problem information. An overview is provided that analyzes the structures of trees and tables, and the probability concepts and problem structures that they may cue respectively.
Tree versus Table: Structures and Applications
Novick and Hurley (2001) analyzed the basic structures and schematic components of trees and tables. The global structure of a table features the cross-classification of elements of two variables or sets, or elements of a single set that are selected twice. The rows and columns each represent a variable or set, with each row or column cell representing an element contained in a set. Each intersection cell represents the combination of two elements that are selected respectively from the two sets or the two selections. The diagonal cells of an N-by-N table are special intersection cells when the table represents combinations of elements of a single set, because a diagonal cell represents the combination of an item by itself (e.g., an outcome that the same element is selected for both times). The global structure of a tree diagram features
hierarchical levels of events. The tree structure starts with a single node, which branches out into subsequent levels; and these subsequent levels serve as the root nodes for their following level, and branch again. Different levels of events are often dependent so that the identities of one level depend on the identities of the preceding level, although it depends on the specific situations. Items listed at the same level are mutually exclusive and identical in status, whereas items listed at different levels differ in status or sequence.
20 Probability Concepts and Problem Types
Three probability topics that are among the most commonly taught topics in elementary probability are permutations, combinations, and the fundamental counting principle of
independent events.
All these types of problems ask for the probability that an intersection (or combination) of the favorable events will occur. However, two underlying concepts distinguish these three types of problems: whether joint events are independent of each other; and whether the order of the combination s is important or not. Table 1 shows the probability principles underlying these types of problems.
In permutations, objects are selected or arranged with regard to the order of an object position. In combinations, objects are selected without regard to the order of an object position. And in both permutations and combinations, events of selecting or arranging an object are dependent of each other, which is that the probability that a selection occurs affects the probability of the next selection. For example, the probability of the outcome of selecting a second ball from an urn of five balls will be affected by the probability of the outcome of the first selection, because the number of balls that remain selectable is reduced. On the other hand, for independent events, the selections of the favorable events are independent of each other, which is that the probability of the outcome of the first selection does not affect the second selection. For example, the probability of getting a tail from flipping a coin is not affected by flipping another coin, because all the possible outcomes for such an event to occur remain the same, regardless of the number of the trials. To put it in a more practical way, the same
population element cannot be selected at two different “places” in permutations or combinations problems, but can keep occurring in some types of independent events.
21 Table 1
Key Probability Concepts (and Distinctions) Underlying the Probability Topics
Probability Topics Joint Events/Outcomes
Independent? Order Important?
Permutations (sampling without replacement) Dependent
Yes Combinations (sampling without replacement) Dependent No Independent Events (sampling with replacement) Independent Yes
Conceptually (as well as procedurally), probability for these situations can be defined and computed in two ways: the classical definition of probability; and the multiplication rule of probability.
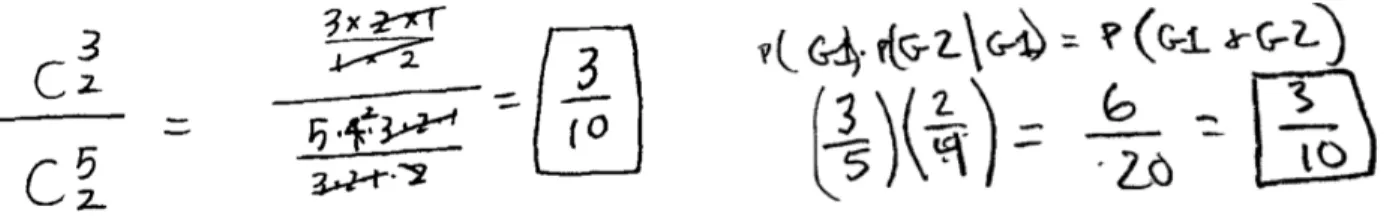
Following the classical definition of probability, measuring the probability that an event will occur is based on outcomes that are equally likely to happen. Thus, in a classic sense, the probability of an event is determined by the number of all possible outcomes of the target event over the number of all possible outcomes that are equally likely to happen. For example, to find the probability two girls will be selected from a group of three girls and two boys, the classical definition will define the probability as 3/10, by dividing 3 (the number of all possible outcomes that two girls will be selected) into 10 (the number of all possible outcomes that two students will be selected). A strategy like this is termed the “outcome-search” strategy.
In a different sense, probability can be defined as the chance of the intersection of events
by the multiplication rule of probability. According to the multiplication rule of probability, the probability is determined as the chance that all the target events will happen. For example, to find the probability that both events, A and B, will occur, the multiplication rule defines the probability as P(A∩B) = P(A) × P(B|A), meaning the probability that both A and B will occur is
22
the probability that A will occur multiplied by the probability that B will also occur given A occurred. Using the same probability problem above, the multiplication rule will define the probability as 3/10 using a different approach – by multiplying 3/5 (the probability that the first selection is a girl) by 2/4 (the probability that the second selection is a girl, too, given the first girl has been selected). A strategy like this is termed the “sequential-sampling” strategy. Structural Compatibility between Diagrams and Probability Problems
Given this conceptual and procedural understanding of probability in permutations, combinations, and fundamental counting principle of independent events, tables and trees may naturally cue students with different underlying concepts and structures for probability problems, according to the diagrammatic structures they each depict.
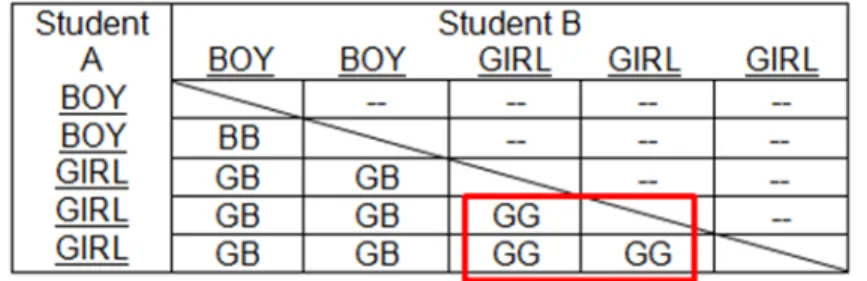
An N-by-N table (shown in Figure 1 and Figure 2) is used to illustrate the table structure in relation to the kind of probability concepts and structures that it may highlight. An N-by-N table is the prototype of the table structure. As Novick and Hurley’s (2001) diagram analyses demonstrate, the cells of such a table represents all possible equally-likely outcomes of the target event and in the whole outcome space. Furthermore, as the example shows, it depicts the target outcomes as a subset of outcomes embedded in the whole outcome space. Therefore, it is reasonable to speculate that the structure of an N-by-N table cues problem solvers to process a probability problem in the sense of classical definition, and to search for all possible and all target outcomes that are equally likely to happen.
Although an N-by-N table should cue the classical definition of probability and an outcome-search solution strategy in general, it has different levels of structural compatibility with problems of different topics, depending on whether events are dependent or independent. To represent the equally-likely outcomes for an independent events problem, every intersection
23
cell represents a valid combination of the selections from two sets, or from a single set twice (represented by the row and the column). However, to represent the outcomes for a permutations or combinations problem, only the non-diagonal intersection cells are valid representations. In permutations and combinations, events are dependent, which means the selection of an object cannot be repeated. Therefore, as all the diagonal cells represent those self-repeated
combinations, they are invalid and should not be included in the counting of equally-likely outcomes. This difference in the visual-conceptual compatibilities suggests that the structure and components of an independent events problem can be better mapped onto the visual structure and components of an N-by-N table, compared to a dependent events problem (i.e., permutations, combinations).
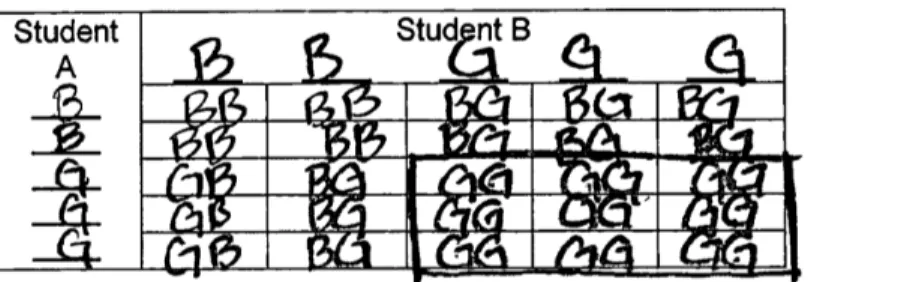
Figure 1. An annotated N-by-N table for a combinations problem. The intersection cells
represent all possible outcomes that two students may be selected from a group of five students (represented by the table column and row). The stricken diagonal cells indicate invalid outcomes. The dashes indicate non-essential repetitive outcomes.
Figure 2. An annotated N-by-N table for an independent events problem. The intersection cells
represent all possible color combinations for the two spinners (each with three equal-size color sections, represented by the table column and row).
24
A binary tree (shown in Figure 3) is used to illustrate the tree structure and how it may highlight certain probability concepts and structures. A binary tree features a hierarchical
structure where events of unequally-likely probabilities are depicted to happen sequentially from left to right (or top to bottom if rotated by 90 degrees clockwise). Therefore, I believe that with this kind of a diagram structure, a binary tree will cue problem solvers to solve probability problems with the multiplication rule, which defines the probability of the outcomes of each selection event sequentially, and then multiplies them to find the probability that all target events will occur.
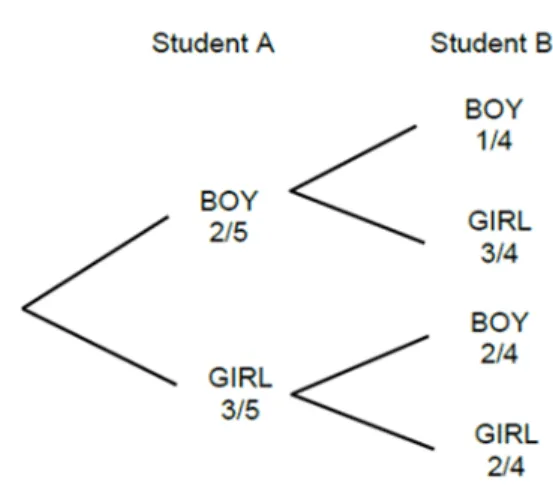
Figure 3. An annotated binary tree for a combinations problem. The nodes of a level represent
the outcomes and their probabilities from a certain selection, as two students are selected from a group of five students (two boys and three girls).
Figure 4. An annotated binary table for a combinations problem. Each intersection cell
represents the joint probability of the outcomes of two selections, as two students are selected from a group of five students (two boys and three girls).
25
The diagram effect may become more complicated (or flexible) when variation formats of trees and tables (i.e., binary tables and N-ary trees) are involved in problem representation. For example, although a binary table (shown in Figure 4) has the global structure of a table, it represents the intersections of events that are unequally likely to happen, rather than equally-likely outcomes. Therefore, although the global structure of a binary table visually depicts the target event (i.e., selecting two girls) as a subset of all possible event intersections, it may still cue the sequential-sampling strategy that defines probability by the multiplication rule.
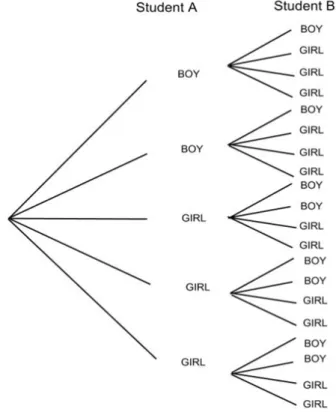
Figure 5. An annotated N-ary tree for a combinations problem. The nodes of a level represent all
possible outcomes from a certain selection, as two students are selected from a group of five students.
On the other hand, although an N-ary (outcome) tree (shown in Figure 5) has the global feature of hierarchy and sequence, it enumerates all equally-like outcomes. Therefore, users may be cued to either principle. N-ary (outcome) tree users may be cued to use an outcome-search
26
strategy if their attention is directed to the outcomes that the diagram enumerates. Or, they may be cued to use a sequential-sampling strategy, if their attention is directed to the selection events that the diagram depicts in a sequential order. However, even if the N-ary (outcome) tree
structures may cue the same solution strategy as the N-by-N (outcome) table structures, their effectiveness may be different. Each has its own advantage and disadvantage in terms of facilitating problem solving accuracy. For solvers to search for outcomes for an independent events problem, information may be less efficiently organized by an N-ary (outcome) tree as the tree branches are likely to distance one target outcome from another, and make the search of all target outcomes more difficult than an N-by-N (outcome) table. On the other hand, this
information is chunked by an N-by-N (outcome) table that integrates all the equally-likely outcomes within the table space for computational efficiency. However, for representing
permutations and combinations problems, N-ary (outcome) trees may facilitate problem solving accuracy more, because the branches of an N-ary (outcome) tree do not include any false self-repeated combinations, but the diagonal cells on an N-by-N (outcome) table can easily trap solvers to count them as valid outcomes.
The goal here is to investigate whether and how trees and tables at different levels of outcome abstraction (i.e., binary tree; N-ary tree; binary table, N-by-N table) lead to different results in interpreting mathematical structures and selecting solutions for probability problems. The diagrams were selected to manipulate two factors: the type of diagram structure (tree versus table) and the abstraction level of the represented outcome space (either a large space of equally-likely outcomes, or a smaller space of unequally-equally-likely outcomes). To test the diagram effects on choice of solution strategy and solution correctness, problems representing two probability topics were used: combinations and fundamental principles of independent events. These specific types
27
of problems were chosen because they admit of multiple types of solution strategies (i.e., the outcome-search strategy and the sequential-sampling strategy), and each can be represented by both trees and tables.
It is hypothesized that the choice of solution strategy is influenced by the diagrammatic representation of a problem. The idea is that different types of diagrams should bias people to formulate different mathematical solution strategies, due to the similarity correspondences between a diagram’s structure and the selected strategy’s mathematical structure. That is, the problem solver tends to choose a solution with procedural or mathematical structure that can be easily aligned with the structure of a diagram. Specifically, it is predicted that the N-by-N table will lead to more frequent use of an outcome-search strategy for the problems, because it represents the problem outcomes at an equally-likely outcome basis, and its N-by-N matrix structure integrates these combination outcomes so that the target outcomes and all possible outcomes may be perceived as a simultaneously sampled subset of a full set. The binary tree is predicted to cue the sequential-sampling strategy, because it features a hierarchical and
sequential leveling structure with the nodes at each selection (branch) level representing
unequally-likely outcomes of a selection. The binary table is also predicted to cue the sequential-sampling strategy, because the four cells of the table represent selection events with unequally-likely outcomes, and the overall structure does not offer a high compatibility with the outcome-search solution structure (i.e., equally-likely target outcomes as a subset of all possible
outcomes). Finally, for the N-ary (outcome) tree, it is hypothesized that both strategies may be cued, because it not only features a sequential and hierarchical structure that may cue the sequential-sampling strategy, but also cues searching for all possible equally-likely outcomes.
28
With regard to the influence that different types of diagrams have on problem solving, it is hypothesized that when the content and structure of a diagram is well-matched to those of a problem type, and when information is organized in an efficient way that minimizes extra information processing or coordination of sub-stages of solution procedure, problem solving success will be high.
29
CHAPTER III: STUDY 1
This chapter describes the design and results of the first study (Study 1). The design of the study will be described in detail, followed by the data analysis results, and a discussion of the study findings and implications with regard to the research questions this dissertation sets out to explore. The effects of three types of generic diagrams for solving two probability word
problems were tested via a self-paced problem solving task. The primary goal was to examine: first, whether different types of diagrams can steer probability problem solvers to choose different solution strategies for problems that admit of multiple strategies; and second, whether they affect problem solution correctness.
Method Participants
The participants were 48 students (39 or 81.3% female) recruited from a university in New York City. Their average age was 25.60 years (SD = 4.03 years). To be qualified for the experiment, a participant had to have taken at least one undergraduate- or graduate-level statistics course prior to participation. On average, participants reported to have taken 2.33 statistics courses. However, their levels of training varied: 19 (or 38.6%) participants reported having taken one statistics course, 11 (or 22.9%) participants reported two, 10 (or 20.8%) reported three, and 8 (or 16.7%) participants reported four or more such courses. Their
undergraduate major background also varied: 15 (or 31.3%) reported non-STEM majors (e.g., literature, music), 21 (43.8%) in social science (e.g., psychology), 5 (10.4%) in mathematics or statistics, and 7 (14.6%) in other STEM domains (e.g., natural science, engineering, economics).
30 Materials
Each participant solved three elementary probability word problems, representing three different probability topics: combinations, independent events, and conditional probability. The first two problems/topics were the target materials for this study, because they admit of two distinct salient solution strategies: the outcome-search strategy and the sequential-sampling strategy (described in the literature review and below). The third problem, involving conditional probabilities (and referred to below as the Weather problem), did not invoke alternative solution strategies, and was treated merely as a filler problem for purposes of this investigation.
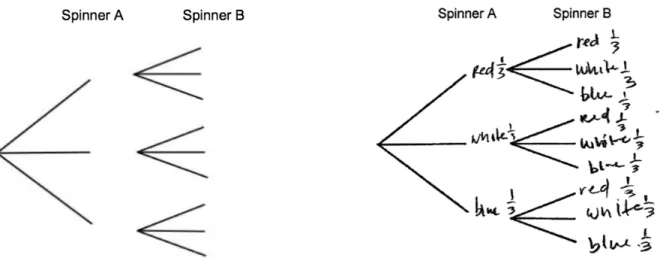
The problem text for the independent events problem (also called the Spinner problem) was:
Two spinners are constructed. Each spinner has 3 color sections of equal size: red, white, and blue. The two spinners are spun at the same time, and the result of each spinner is recorded. What is the probability of getting the same color on both spinners?
In the diagram conditions, either a tree (Figure 6) or a table (Figure 7) was provided to the problem solver in addition to the problem text. These diagrams were unlabeled, but the number of branches (or rows and columns) was appropriate to the problem.
The problem text for the combinations problem (also called the Work-Group problem) was as follows. The generic diagrams for this problem are presented in Figure 8 and Figure 9.
Five students are in a work group. The teacher randomly selects two of them to present the group work. If there are 2 boys and 3 girls in this group, what is the
31
Although these two problems represent two different probability topics, the same two broad strategies can be used to solve each one. For the combinations (Work-Group) problem, the outcome-search strategy defines the probability as 3/10: 3 possible ways of selecting two girls over 10 possible ways of selecting any two students, from a group of two boys and three girls. The sequential-sampling strategy finds the probability as P (G1∩G2) = P (G1) × P (G2|G1) = (3/5) × (2/4) = 3/10. Similarly, for the independent events (Spinner) problem, the probability defined by the outcome-search strategy is 3/9 (or 1/3): 3 total outcomes that both spinners land on the same color over 9 possible color combinations between the two spinners. Using the sequential-sampling strategy, the probability that both spinners land on a particular color (e.g., red) is P (R1∩R2) = P (R1) × P (R2) = (1/3) × (1/3) = 1/9. And because the spinners can land on any of the
three color sections, the total probability is three times the probability of obtaining a particular color twice, equal to 3 × (1/3) × (1/3) = 3 × 1/9 = 3/9 (or 1/3).
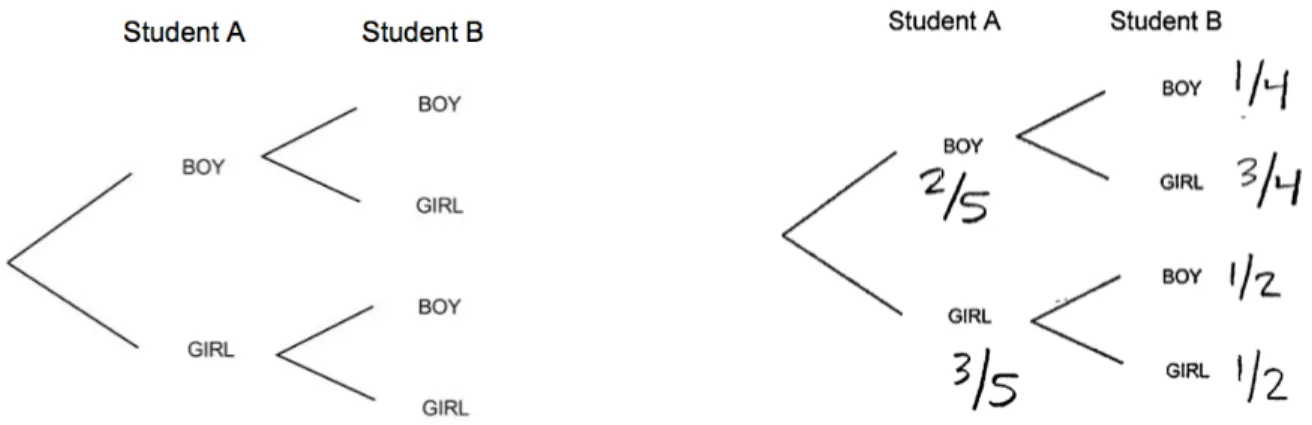
Figure 6. Tree for the Spinner problem. The panel on left shows the unlabeled tree provided with
the Spinner problem in Study 1. The panel on right shows how it was annotated by one participant.
32
Figure 7. Table for the Spinner problem. The panel on left shows the unlabeled table provided
with the Spinner problem in Study 1. The panel on right shows how it was annotated by one participant.
Figure 8. Tree for the Work-Group problem. The panel on left shows the unlabeled tree provided
with the Work-Group problem in Study 1. The panel on right shows how it was annotated by one participant.
Figure 9. Table for the Work-Group problem. The panel on left shows the unlabeled table
provided with the Work-Group problem. The panel on right shows how it was annotated by one participant.
33 Design and Procedure
Three test forms were used, each presenting the problems in a different order (Table 2). The first problem for each test form was given in text only, with no provided diagram. For the second and the third problems, one was given with a generic tree diagram, and the other one was given with a generic table diagram. Problems were presented in different orders, counterbalanced to equate possible carry-over effects. Thus, each problem was attempted by three independent groups of participants, with one third of them solving it with no provided diagram, one-third with a tree diagram, and one-third with a table diagram. As Table 2 shows, three types of provided diagrams were used: an N-by-N (outcome) table and a binary tree for the Work-Group
(combinations) problem; and an N-by-N (outcome) table and an N-ary (outcome) tree for the Spinner (independent events) problem.
Table 2
Study Design and Test Forms for Study 1
Problem 1 Problem 2 Problem 3
Form A Spinner (no diagram) Weather (binary tree) Work-Group (N-by-N table) Form B Weather (no diagram) Work-Group (binary tree) Spinner (N-by-N table) Form C Work-Group (no diagram) Weather (binary table) Spinner (N-ary tree)
Participants (N=48) were randomly assigned to the three test forms, with 16 participants in each test form. Participants were tested individually in a laboratory setting, with no interaction with an on-site experimenter, although they may ask the experimenter questions for clarifying the task instructions during the experiment. In the task, each participant was given a booklet in which each problem was presented on a separate page. To prevent participants from seeing more than one diagram at a time, they were instructed not to look at any other problems when they