University of Mannheim / Department of Economics
Working Paper Series
BOOTSTRAPPING SAMPLE QUANTILES OF
DISCRETE DATA
Carsten Jentsch Anne Leucht
Working Paper 14-15
CARSTEN JENTSCH AND ANNE LEUCHT
Abstract. Sample quantiles are consistent estimators for the true quantile and satisfy central limit theorems (CLTs) if the underlying distribution is continuous. If the distribution is dis-crete, the situation is much more delicate. In this case, sample quantiles are known to be not even consistent in general for the population quantiles. In a motivating example, we show that Efron’s bootstrap does not consistently mimic the distribution of sample quantiles even in the discrete independent and identically distributed (i.i.d.) data case. To overcome this bootstrap inconsistency, we provide two different and complementing strategies.
In the first part of this paper, we prove thatm-out-of-n-type bootstraps do consistently mimic
the distribution of sample quantiles in the discrete data case. As the corresponding bootstrap confidence intervals tend to be conservative due to the discreteness of the true distribution, we propose randomization techniques to construct bootstrap confidence sets of asymptotically correct size.
In the second part, we consider a continuous modification of the cumulative distribution function and make use of mid-quantiles studied in Ma, Genton and Parzen (2011). Contrary to ordinary quantiles and due to continuity, mid-quantiles lose their discrete nature and can be estimated consistently. Moreover, Ma, Genton and Parzen (2011) proved (non-)central limit theorems for i.i.d. data, which we generalize to the time series case. However, as the mid-quantile function fails to be differentiable, classical i.i.d. or block bootstrap methods do not lead to completely satisfactory results andm-out-of-nvariants are required here as well.
The finite sample performances of both approaches are illustrated in a simulation study by comparing coverage rates of bootstrap confidence intervals.
Introduction
Since the seminal work of Efron (1979), bootstrapping has been established as a major tool for estimating unknown finite sample distributions of general statistics. Among others, this method has successfully been applied to construct confidence intervals for sample quantiles of contin-uous distributions; see e.g. Serfling (2002, Chapter 2.6), Sun and Lahiri (2006), Sharipov and Wendler (2013) and references therein. In this case, the asymptotic behavior of quantile estima-tors is well-understood. Based on the well-known Bahadur representation, a CLT can then be established for sample quantiles in case of an underlying distribution exhibiting a differentiable cumulative distribution function (cdf) and a positive density at the quantile level of interest. This allows for the application of classical results on the bootstrap to mimic the unknown finite sample distribution.
If the underlying distribution is discrete, the situation is much more delicate. Sample quan-tiles may not even be consistent in general for the population quanquan-tiles in this case. This issue occurs due to the fact that the cdf is a step function. This leads to inconsistency if the level of
Date: May 15, 2014.
1991 Mathematics Subject Classification. 62G09, 62M10, 62G05. JEL subject code C13, C15.
Key words and phrases. Bootstrap inconsistency; Count processes; Mid-distribution function;m-out-of-n
boot-strap; Integer-valued processes.
2 CARSTEN JENTSCH AND ANNE LEUCHT
the quantile of interest lies in the image of the cdf and, consequently, CLTs do not hold true anymore. Before we illustrate this inconsistency with the help of a simple, but very insightful toy example below, first, we fix some notation that is used throughout this paper. Let Qp for
p∈(0,1) be the usual populationp-quantile of a probability distribution with cdfF defined via its generalized inverse, i.e.
Qp =F−1(p) = inf
t {t:F(t)≥p}. (1)
With observations X1, . . . , Xn at hand, the sample p-quantile Qbp is defined as the empirical
counterpart to (1), that is,
b
Qp =Fbn−1(p) = inft {t:Fb(t)≥p}, (2)
where Fbn(x) =n−1Pni=11(Xi ≤x) denotes the empirical distribution. Here and in the sequel, ⌈x⌉(⌊x⌋) denotes the smallest (largest) integer that is larger (smaller) or equal to x.
Toy example: Coin flip data.
Suppose a coin is flipped independently n times and we observe a sequenceX1, . . . , Xn of zeros
and ones such that P(Xi = 0) = p= 1−P(Xi = 1) for some p ∈(0,1). Let Xmed=Q0.5 and
b
Xmed=Qb0.5 denote the population median and the sample median, respectively. This leads to
P(Xbmed= 0) = n X k=⌈n 2⌉ n k pk(1−p)n−k. (3)
If the coin is fair, i.e. p= 1/2, we have Xmed= 0 and, by symmetry properties, we get
P(Xbmed= 0) = (1 2, n odd 1 2 + n n/2 1 2 n+1 , n even. (4)
From Stirling’s formula, we get n/n2 12n+1 =O(n−1/2), which leads to
P(Xbmed= 0) = 1−P(Xbmed= 1)→
1
2 (5)
as n→ ∞. Thus, the sample median is not a consistent estimator and its limiting distribution
is an equally-weighted 2-point distribution, i.e. a fair coin flip itself.
In this paper, as a first result, we show that one consequence of the estimation inconsistency illustrated in (5) is that the classical bootstrap of Efron for i.i.d. data is inconsistent for sample quantiles if they do not consistently estimate the true quantile. More precisely, we prove that the Kolmogorov-Smirnov distance between the cdfs and their bootstrap analogues do not converge to zero, but to non-degenerate random variables. These turn out to be functions of a random variableU ∼U nif(0,1) in the special case of the sample median for the fair coin flip discussed in the example and in Theorem 1.1 below. To the authors knowledge, such a specific phenomenon has not been observed in the bootstrap literature so far.
Toy example: Coin flip data (continued).
Let X1∗, . . . , Xn∗ be i.i.d. (Efron) bootstrap replicates of X1, . . . , Xn and let Xbmed∗ denote the
bootstrap sample median based on the bootstrap observations. Then, we have analogously to (3)
P∗(Xbmed∗ = 0) = n X k=⌈n 2⌉ n k b pkn(1−pbn)n−k, (6)
where pbn=n−1Pnt=11(Xt= 0). In Theorem 1.1 below, we show that
P∗(Xbmed∗ = 0) = 1−P∗(Xbmed∗ = 1)−→D U ∼U nif(0,1). (7)
By combining the result in (7) with (5), we get inconsistency of Efron’s bootstrap, see
Theo-rem 1.1 below for details.
In view of the results displayed in the toy example, it is worth noting that, more generally, the populationp-quantileQp may be defined as any real numberqthat satisfies the two inequalities
P(X≤q)≥p and P(X≥q)≥1−p, (8)
where X ∼ F, i.e. the definition (1) corresponds to the smallest possible value of q in (8). In particular, it is not unusual to define the median Xmed as the center of the smallest and the
largest possible values of the median with respect to definition (8). The sample median Xbmed
is then defined in direct analogy. However, this choice does not affect at all the inconsistency results above and we prefer the definitions via (1) and (2) for two reasons. First, they naturally fit into the more general notation of the (generalized) inverse of the cdf and, secondly, the (sam-ple) median then takes values in the support ofPX1 only.
Still, one would like to establish consistent bootstrap results not only for the continuous setting, but also in general for discrete distributions. In this paper, as the use of ordinary quantiles in discrete settings can be discussed conversely, we provide two different and complementing strate-gies to tackle the issue of bootstrap inconsistency for sample quantiles in the discrete setup that is illustrated in the toy example above.
In the first part of this paper, we investigate whether them-out-of-nbootstrap (or low intensity bootstrap) leads to asymptotically consistent bootstrap approximations. In several contexts where the classical bootstrap fails, this modified bootstrap scheme is known to be a valid alter-native; see e.g. Swanepoel (1986), Angus (1993), Deheuvels, Mason and Shorack (1993), Athreya and Fukuchi (1994, 1997) and Del Barrio, Janssen and Pauly (2013) among others. We prove that the i.i.d. m-out-of-n bootstrap is consistent for sample quantiles without centering in the i.i.d. discrete data case, but also that inconsistency for Efron’s bootstrap remains if the proce-dure is applied with centering. These differing results seem to be odd at first sight, but they can be explained by systematically different centering schemes. Another somewhat surprising result is that, on the one hand, bootstrap consistency can be achieved for i.i.d. data as well as dependent time series data for one and the same i.i.d.m-out-of-nbootstrap procedure (without centering) as long as only single sample quantiles are considered. But on the other hand, an
m-out-of-nblock bootstrap procedure `a la Athreya, Fukuchi and Lahiri (1999) has to be used to mimic correctly the joint limiting distribution ofseveral sample quantiles in the time series case. To be able to establish this theory, we had to derive the joint limiting distribution of vectors of sample quantiles for weakly dependent time series processes. This might be of independent interest.
The consistency results achieved for the m-out-of-n bootstrap are then applied to construct bootstrap confidence intervals. As these tend to be conservative due to the discreteness of the
4 CARSTEN JENTSCH AND ANNE LEUCHT
true distribution, we propose randomization techniques similar to the construction of random-ized tests (e.g. classical Neyman-Pearson tests) to construct bootstrap confidence intervals of asymptotically correct size.
All afore-mentioned difficulties related to discrete distributions are mainly due to the jumps occurring in the distribution function, which leads to many quantiles having the same values. An-other look at quantiles of discretely distributed data is to employ the so-called mid-distribution function proposed by Parzen (1997, 2004). This concept has been further studied in Ma, Genton and Parzen (2011) and has been applied successfully e.g. to probabilistic index models in Thas, de Neve, Clement and Ottoy (2006). The corresponding mid-quantile function is a continuous, piecewise linear modification of the ordinary quantile function.
In the second part of this paper, we make use of mid-quantiles. Although the distributions of the mid-quantiles lose their discrete nature, they allow for a meaningful interpretation in many relevant situations. Exemplary, compare two (small) samples stemming from coin flip scenarios. Both their sample medians may be computed to 0. Actually, this is not much infor-mation since the samples widely may differ. Assume for example that in the first sample five out of nine heads (equal to 0) may be occurred and in the second sample eight out of nine heads occurred. It would be of much more use to regard the empirical proportion of heads and tails within each sample to describe their underlying distributions and to reflect possible differences. Based on such considerations Parzen (1997, 2004) established the concept of mid-distribution functions to handle sample medians more likely. Contrary to ordinary quantiles, it turns out that the mid-quantiles can be estimated consistently. Moreover, (non-)central limit theorems of the sample mid-quantiles can be achieved, where the limiting distributions crucially depend on whether the mid-distribution function is differentiable or not at the quantile of interest.
First, we generalize the limiting results obtained in Ma, Genton and Parzen (2011) to the time series case under a τ-dependence condition introduced by Dedecker and Prieur (2005). This extension is motivated by a growing literature on modeling of and statistical inference for count data that appears e.g. as transaction numbers of financial assets of in biology where the the evolution of infection numbers over time is of great interest; see for instance Fokianos, Rahbek and Tjostheim (2009) and Ferland, Latour, and Oraichi (2006). In particular, the theory pro-vided in this paper covers parameter-driven integer-valued autoregressive (INAR) models but also observation-driven integer-valued GARCH (INGARCH) models. By construction, the mid-quantile function is continuous, but it fails to be differentiable. Caused by this non-smoothness, it turns out that classical i.i.d. or block bootstrap methods do not lead to completely satis-factory results and m-out-of-n variants are required here as well. Moreover, due to boundary effects, randomization techniques still have to be used in order to construct confidence intervals of asymptotic correct level 1−α.
The rest of the paper is organized as follows. Part I focuses on bootstrapping classical quantiles. In a first Section 1.1 we show inconsistency of Efron’s bootstrap in the special case of the fair coin flip. Afterwards, in Section 1.2 we discuss validity of low intensity bootstrap methods for quantiles in a much more general framework that covers a large class of discretely distributed time series. In Section 1.3 randomization techniques for the construction of (1−α) confidence sets are provided before the finite sample behavior of our methods is illustrated in Section 1.4. In Part II we consider the alternative concept of mid-quantiles. In Section 2.1 we generalize the asymptotic results established in Ma, Genton and Parzen (2011) for the i.i.d. case to the case of weakly dependent time series data. Bootstrap validity is discussed in Section 2.2 and,
based on these results, confidence intervals for mid-quantiles are provided in Section 2.3. Nu-merical experiments are reported in Section 2.4. Finally, both Parts I and II are discussed in a comparative conclusion. All proofs and auxiliary results are deferred to a final section of the paper.
Part I: Bootstrapping sample quantiles
1.1. Inconsistency of Efron’s Bootstrap.
In this section, we prove for the simple example of a fair coin flip and the sample median that Efron’s bootstrap is not capable in general to estimate consistently the limiting distribution of sample quantiles from discretely distributed data. To check for bootstrap consistency, we make use of the Kolmogorov-Smirnov distance and show that neither
dKS(Xbmed∗ ,Xbmed) = sup x∈R P∗(Xbmed∗ ≤x)−P(Xbmed ≤x) (9)
(without centering) nor
dKS(Xbmed∗ −Xbmed,Xbmed−Xmed) = sup x∈R
P∗(Xbmed∗ −Xbmed≤x)−P(Xbmed−Xmed≤x)
(10) (with centering) do converge to zero for increasing sample size, but to non-degenerate distribu-tions, which turn out to be different in these two cases. Dealing with the non-centered case (9) first and due toXi ∈ {0,1} for the coin flip example, it suffices to consider
sup x∈[0,1) P∗(Xbmed∗ ≤x)−P(Xbmed≤x) =P∗(Xbmed∗ = 0)−P(Xbmed= 0) , (11) because |P∗(Xb∗
med ≤ x)−P(Xbmed ≤ x)| = 0 holds for all x /∈ [0,1). Further, we know that
P(Xbmed= 0)→1/2 with n→ ∞by (5) such that we have to investigate
P∗(Xbmed∗ = 0) = n X k=⌈n2⌉ n k b pkn(1−bpn)n−k (12)
in more detail. For the case with centering (10), things become slightly different and it suffices to consider
sup
k∈{−1,0}
P∗(Xbmed∗ −Xbmed ≤k)−P(Xbmed−Xmed≤k)
(13)
in this case. Precisely, we get the following results.
Theorem 1.1 (Inconsistency of Efron’s bootstrap). For independent and fair (p = 0.5) coin
flip random variables X1, . . . , Xn and i.i.d. (Efron) bootstrap replicates X1∗, . . . , Xn∗, it holds
P∗(Xbmed∗ = 0) = n X k=⌈n 2⌉ n k b pkn(1−pbn)n−k −→D U ∼U nif(0,1). (14)
This leads to:
(i) For Efron’s bootstrap without centering, it holds
dKS(Xbmed∗ ,Xbmed)−→D U− 1 2 ∼U nif(0,1/2). (15)
6 CARSTEN JENTSCH AND ANNE LEUCHT
(ii) For Efron’s bootstrap with centering, it holds
dKS(Xbmed∗ −Xbmed,Xbmed−Xmed)−→D 1
1 2 ≤U U + 1 1 2 > U −1 2 =:S, (16)
where the cdf ofS is given by
FS(x) =x1[0,1
2)(x) + 1[12,∞)(x).
1.2. The m-out-of-n bootstrap.
1.2.1. Coin flip data.
Of course, there are other situations discussed in the literature, where the ordinary Efron’s bootstrap fails; see Bickel and Friedman (1981, Section 6), Mammen (1992), Horowitz (2001) and references therein. The most prominent example is the maximum of i.i.d. random variables
X1, . . . , Xn, that is, Mn = max(X1, . . . , Xn). In this case, bootstrap inconsistency of Mn∗ =
max(X1∗, . . . , Xn∗) has been investigated in Angus (1993). To circumvent this problem and in
view of the well-known limiting result [cf. Resnick (1987, Chapter 1)]
P(a−n1(Mn−bn)≤x) −→
n→∞G(x) ∀x∈R for suitable distributionsPX1, sequences (a
n)nand (bn)nand a non-degenerate cdfG, Swanepoel
(1986), Deheuvels, Mason and Shorack (1993) and Athreya and Fukuchi (1994, 1997) used the low-intensity m-out-of-n-bootstrap. That is, drawing with replacement m times with m → ∞
such thatm=o(n) to getX1∗, . . . , Xm∗ and to mimic the distribution ofa−n1(Mn−bn) by that of
a−m1(Mm∗ −bm). This task has been generalized by Athreya, Fukuchi and Lahiri (1999) to time
se-ries data, where additionally a low-intensity block bootstrap has been proposed and investigated.
The situation addressed in this paper is somehow comparable. A closer inspection of (3) and (6) leads to the conclusion that if we were allowed to replace pbn byp for asymptotic
considera-tions, we would get the same limiting results. Obviously, from (5) and (7), this is not the case. However, as
√
n(pbn−p)→ ND (0, p(1−p)), (17)
inconsistency stated in Theorem 1.1 for the coin flip can be explained by the fact that the convergence pbn−p=OP(n−1/2) is just “too slow”. Hence, the bootstrap is not able to mimic
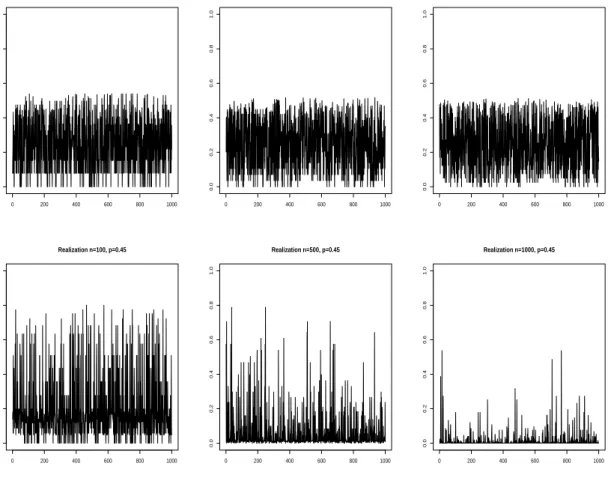
the underlying scenario correctly since the latter completely differs for p = 1/2 and p 6= 1/2. Note that the limiting distribution is a non-degenerate 2-point distribution in the first and degenerate in the second case; compare Theorem 1.3 below and Figure 1. Therefore, the natural question is whether an m-out-of-n bootstrap may be capable to “speed up” the convergence of
b
pn(relative to the convergence of the empirical cdf on the bootstrap side) and whether this does
lead to bootstrap consistency. The following theorem summarizes our findings in this direction for the sample median without and with centering corresponding to the results of Theorem 1.1.
Theorem 1.2 (Consistency and inconsistency for the m-out-of-n bootstrap for the sample median). For independent and fair (p = 0.5) coin flip random variables X1, . . . , Xn, we draw
i.i.d. bootstrap replicates X1∗, . . . , Xm∗. Suppose that m/n+ 1/m = o(1) as n → ∞ and denote
the bootstrap sample median based on X∗
1, . . . , Xm∗ byXbm,med∗ .
(i) For them-out-of-n bootstrap without centering, it holds
0 200 400 600 800 1000 0.0 0.2 0.4 0.6 0.8 1.0 Realization n=100, p=0.5 0 200 400 600 800 1000 0.0 0.2 0.4 0.6 0.8 1.0 Realization n=500, p=0.5 0 200 400 600 800 1000 0.0 0.2 0.4 0.6 0.8 1.0 Realization n=100, p=0.5 0 200 400 600 800 1000 0.0 0.2 0.4 0.6 0.8 1.0 Realization n=100, p=0.45 0 200 400 600 800 1000 0.0 0.2 0.4 0.6 0.8 1.0 Realization n=500, p=0.45 0 200 400 600 800 1000 0.0 0.2 0.4 0.6 0.8 1.0 Realization n=1000, p=0.45
Figure 1. 1000 realizations of supkP∗(Xbmed∗ ≤k)−P(Xbmed≤k)
of a coin flip for sample sizes n∈ {100,500,1000} (from left to right) and for p ∈ {0.5,0.45}
(from top to bottom).
(ii) For them-out-of-n bootstrap with centering, it holds
dKS(Xbm,med∗ −Xbmed,Xbmed−Xmed)−→D
1 21 U < 1 2 =:S,e
where U ∼U nif(0,1) such that 2Se∼Bin(1,0.5) is Bernoulli-distributed.
Remark 1.1. The results of Theorem 1.2 that state consistency for the non-centered sample
median, but inconsistency for the centered version for the m-out-of-n bootstrap, seem to be
surprising at first sight. However, by a closer inspection of part (ii) this oddity can be explained by
the fact thatXmed= 0, while Xbmed andXbm,med∗ take the values 0and1 with limiting probability
1/2 each. Hence, the centering differs on the bootstrap and the non-bootstrap side of (ii). This
effect is caused by the estimation inconsistency of the sample median.
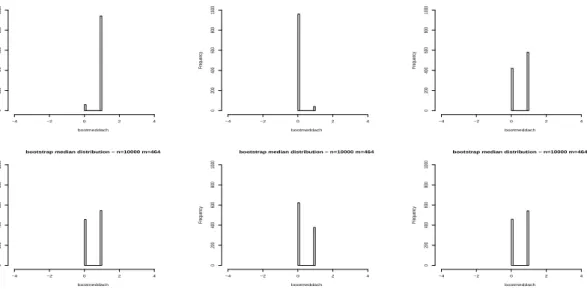
In Figure 2, the differing asymptotic behavior of Xbmed,m∗ form=n andm =n2/3 is illustrated via histogram plots for coin flip data. For the first case, the asymptotic uniform distribution of
P∗(Xb∗
med,n= 0) is reflected by the high variability of the histograms, whereas the probabilities
seem to be more balanced in the second case.
8 CARSTEN JENTSCH AND ANNE LEUCHT
bootstrap median distribution − n=10000 m=10000
bootmeddach Frequency −4 −2 0 2 4 0 200 400 600 800 1000
bootstrap median distribution − n=10000 m=10000
bootmeddach Frequency −4 −2 0 2 4 0 200 400 600 800 1000
bootstrap median distribution − n=10000 m=10000
bootmeddach Frequency −4 −2 0 2 4 0 200 400 600 800 1000
bootstrap median distribution − n=10000 m=464
bootmeddach Frequency −4 −2 0 2 4 0 200 400 600 800 1000
bootstrap median distribution − n=10000 m=464
bootmeddach Frequency −4 −2 0 2 4 0 200 400 600 800 1000
bootstrap median distribution − n=10000 m=464
bootmeddach Frequency −4 −2 0 2 4 0 200 400 600 800 1000 Figure 2. Histograms ofXb∗
med,mbased on i.i.d. bootstrap replicatesX1∗, . . . , Xm∗
from fair coin flip data X1, . . . , Xn for n = 10000 and m = n (first row) and
m=n2/3 (second row).
the sample median. This seems to be very restrictive at first sight. In the following, we turn to a much more general setup and show that asymptotics follow immediately from the results established for the coin flip example. Consequently, it turns out to be not that toyish at all. 1.2.2. General setup.
We now turn to more general distributions than the Bernoulli distribution and suppose that (Xt)t∈Z is a sequence of random variables that might inherit a certain dependence structure. In
the last decade, Poisson autoregressions [e.g. Ferland, Latour, and Oraichi (2006) and Fokianos, Rahbek and Tjostheim (2009)], INAR processes [e.g. McKenzie (1988), Weiß (2008), and Drost, van den Akker and Werker (2009)] and various extensions of these models have attracted increas-ing interest, see Fokianos (2011). We intend to derive results that hold true for a broad range of processes including the previous one. Doukhan, Fokianos and Tjøstheim (2012) and Doukhan, Fokianos and Li (2012) showed that these processes areτ-dependent with geometrically decaying coefficients. Therefore, we will use this concept in the sequel and state its definition for sake of completeness. However, it can be seen from the proofs below that any other concept of weak dependence being sufficient for a CLT of the empirical distribution function can be applied here as well.
Definition 1. Let (Ω,A, P) be a probability space and (Xt)t∈Z be a strictly stationary sequence
of integrable Rd-valued random variables. The process is called τ-(weakly) dependent if
τ(h) = sup D∈N 1 Dh≤t1sup<···<tD {τ(σ(Xt, t≤0),(Xt1, . . . , XtD))} −→ h→∞ 0, where τ(M, X) =E sup f∈Λ1(Rp) Z Rp f(x)dPX|M(x)− Z Rp f(x)dPX(x) ! .
Here, M is a sub-σ-algebra of A, PX|M denotes the conditional distribution of the Rp-valued
random variable X givenM, and Λ1(Rp) denotes the set of 1-Lipschitz functions from Rp toR,
Remark 1.2. If a process (Xt)t∈Z on (Ω,A, P) is τ-dependent and if A is rich enough, then
there exists, for all t < t1 < · · · < tD ∈ Z, D ∈ N, a random vector (Xet1, . . . ,XetD)′ which is
independent of (Xs)s≤t, has the same distribution as (Xt1, . . . , XtD)′ and satisfies
1 D D X j=1 EkXetj −Xtjk1 ≤ τ(t1−t); (18)
cf. Dedecker and Prieur (2004). This L1-coupling property will be an essential device for the
proofs of our results below. Also note that in particular sequences of i.i.d. random variables
(Xt)t∈Z are τ-dependent with τ(0) ≤2EkX1k and τ(h) = 0 for h 6= 0. Nevertheless, we state
the i.i.d. case separately in all our Theorems since τ-dependent processes are assumed to have
finite first moment which is not necessary in our results if the data are i.i.d..
Regarding the marginal distribution PX1, we assume that it has support supp(PX1) =V, that
is,P(Xi∈V) = 1, where
V ={vj |j∈T ⊆Z} (19)
for some finite or countable index set T with vj < vj+1 for all j ∈T. Further, we assume that
V has no accumulation point. As the cdf F is a step function, there is always a p∈(0,1) such that the p-quantile Qp = vj, say, as well as vj+1 satisfy both inequalities in (8). Recall that
this covers particularly the population median in the fair coin flip example. In the following, we consider the asymptotics for the sample quantileQbp as defined in (2) and its bootstrap analogue
b Q∗p,m= (Fbm∗(p))−1 = inf t {t:Fb ∗ m(t)≥p}, where Fb∗ m(x) = m−1 Pm
i=11(Xi∗ ≤ x) denotes the empirical bootstrap distribution function.
Similar to (3), for all x∈R, we have
P(Qbp≤x) =P n X i=1 1(Xi ≤x)≥ ⌈np⌉ ! = n X j=⌈np⌉ n j Fj(x)(1−F(x))n−j.
For the bootstrap p-quantile Qb∗p,m based on i.i.d. bootstrap pseudo replicates X1∗, . . . , Xm∗, we get the analogue representation
P∗(Qb∗p,m≤x) =P∗ m X i=1 1(Xi∗ ≤x)≥ ⌈mp⌉ ! = m X j=⌈mp⌉ m j b Fnj(x)(1−Fbn(x))m−j.
Further, for all x∈Rand analogue to (17), we have
√
n(Fbn(x)−F(x))→ ND (0, W) where W =cov(1(X0≤x),1(X0 ≤x)).
As for the median in the coin flip example and analogue to (9) and (10), to check for boot-strap consistency, we have to consider dKS(Qb∗p,Qbp) or dKS(Qb∗p −Qbp,Qbp −Qp). To this end,
we first study the asymptotics for the empirical quantile Qbp. In particular, part (iii) of the
following lemma addresses the joint limiting distributions of several empirical quantiles. To the authors knowledge, such a result has not been established in this generality so far and may be of independent interest.
Theorem 1.3 (Asymptotics of empirical quantiles for discrete distributions). Let X1, . . . , Xn
be discretely distributed random variables which are either i.i.d. or observations of a strictly
sta-tionary andτ-dependent process (Xt)t∈Z withP∞h=0τ(h)<∞ and supp(PX1) =V as described
10 CARSTEN JENTSCH AND ANNE LEUCHT
(i) If F(Qp)> p,
P(Qbp=Qp) −→
n→∞1.
(ii) If F(Qp) =p and Qp =vj, say, for some vj ∈V,
P(Qbp =vj) −→
n→∞1/2 and P(Qbp =vj+1)n−→→∞1/2.
(iii) Forp1, . . . , pdsuch that F(Qpi) =pi,i= 1, . . . , k andF(Qpi)> pi,i=k+ 1, . . . , d with
Qpi =vli, say, joint convergence in distribution of Qb= (Qbp1, . . . ,Qbpd)′ holds. Precisely,
we have P(Qb=q) → n−→∞ ( PTkj=1(2·1(qj =Qpj)−1)Zj ≥0 , qi=Qpi, i=k+ 1, . . . , d 0, otherwise (20)
where q= (q1, . . . , qd)′ with qi∈ {vli, vli+1}. Here, the probability of the empty
intersec-tion is set to one and Z = (Z1, . . . , Zk)′ ∼ N(0,W) with covariance matrix W having
entries
Wi,j =
(
cov(1(X0 ≤qi),1(X0 ≤qj)), i.i.d. case
P
h∈Zcov(1(Xh ≤qi),1(X0 ≤qj)), time series case
.
Note that the asymptotics do not depend on the dependence structure of the underlying process as long as single quantiles are considered. This does no longer hold true when the joint distri-bution of several quantiles is considered. Part (iii) above shows that Qb converges to a random variable with 2-point marginal distributions that are indeed dependent not only for the time series case, but also for i.i.d. random variables. More precisely, the probability that the vector of empirical quantiles Qb equals the vector q corresponds asymptotically to the probability that the normally distributed random variable Z takes values in a certain orthant of Rk depending
on q. This is illustrated in the following example.
Example 1.1. In the situation of Theorem 1.3(iii) let k= 2 and suppose(Qp1, Qp2) = (vi1, vi2).
(i) If q= (vi1, vi2), we have P(Qb=q)n→
→∞P(0≤Z1,0≤Z2).
(ii) If q= (vi1, vi2+1), we have P(Qb=q)n→
→∞P(0≤Z1,0≥Z2).
After having established asymptotic theory for sample quantiles in this general setup, it remains to consider the bootstrap analogue, i.e. P∗(Qb∗p,m≤x), in more detail. In particular, forx=Qp
we have by Theorem 1.4 below
P∗(Qb∗p,m=Qp) =P∗(Qb∗p,m≤Qp)−oP(1) = m X k=⌈mp⌉ m k b Fnk(Qp)(1−Fbn(Qp))m−k−oP(1),
which has (asymptotically) exactly the same shape as (12) and the results of Theorems 1.1 and 1.2 transfer directly to this more general setup.
Theorem 1.4 (Consistency of the i.i.d. m-out-of-n bootstrap). Let X1, . . . , Xn be discretely
distributed i.i.d. random variables with supp(PX1) = V as above and we draw i.i.d. bootstrap
replicates X1∗, . . . , Xm∗. Suppose that m/n+ 1/m=o(1) as n→ ∞ and let Qb = (Qbp1, . . . ,Qbpd)
as in Theorem 1.3 andQb∗m= (Qb∗p1,m, . . . ,Qb∗pd,m)for p1, . . . , pd∈(0,1). Then, we have bootstrap
consistency, i.e. dKS b Q∗m,Qb:= sup x∈Rd P∗(Qb∗m ≤x)−P(Qb ≤x)−→P 0.
To capture the dependence structure of the process (Xt)t∈Z in the time series case, we approach
an m-out-of-n(moving) block bootstrap procedure:
Step 1. Choose a bootstrap sample size m, a block length l and let b = ⌈m/l⌉ be the smallest number of blocks required to get a bootstrap sample of length bl ≥ m. Define blocks
Bi,l = (Xi+1, . . . , Xi+l), i = 0, . . . , n−l and let i0, . . . , ib−1 be i.i.d. random variables
uniformly distributed on the set{0,1,2, . . . , n−l}. Step 2. Lay the blocksBi0,l, . . . , Bib−1,l end-to-end together to get
Bi0,l, . . . , Bib−1,l = Xi0+1, . . . , Xi0+l, Xi1+1, . . . , Xi1+l, . . . , Xib−1+1, . . . , Xib−1+l
= X1∗, . . . , Xbl∗
and discard the lastbl−m values to get a bootstrap sampleX1∗, . . . , Xm∗.
An application of this block bootstrap is in particular necessary to obtain bootstrap consistency if several quantiles are considered jointly. This leads to the following theorem.
Theorem 1.5 (Consistency of the block-wise m-out-of-n bootstrap). Let X1, . . . , Xn be
dis-cretely distributed random variables with supp(PX1) = V as above that are observations of a
strictly stationary andτ-dependent process (Xt)t∈Z withP∞h=0h τ(h)<∞. We apply the
block-wise m-out-of-n bootstrap to get a bootstrap sample X1∗, . . . , Xm∗. Suppose that m/n+l/m+
1/m+ 1/l=o(1) asn→ ∞. With the notation of Theorem 1.4, we have bootstrap consistency,
i.e. dKS b Q∗ m,Qb P −→0.
Remark 1.3. It can be seen from Theorem 1.3(iii) that P(Qbp = Qp) −→ P(Z ≥0) = 1/2 as
n → ∞ if F(Qp) = p. Here, Z is a centered normal variable whose variance depends on the
dependence structure of the underlying process. However, for the limit behavior of the sample
quantile itself the variance of Z is not relevant and we only require symmetry around the origin.
In the case of F(Qp)> p the proof of P(Qbp=Qp)−→1 is based on the WLLN which holds for
i.i.d. as well as for τ-weakly dependent data. This implies in particular that in order to mimic
the asymptotic behavior of a single quantile correctly we do not have to imitate the dependence
structure correctly. Hence, the i.i.d. m-out-of-n-bootstrap is also valid for sequences of weakly
dependent random variables if single quantiles are considered; for details follow the lines of the
proof of Theorem 1.4. A similar phenomenon occurs whenm-out-of-nbootstrap is used to mimic
the distribution of Mn = max(X1, . . . , Xn); see Theorem 4 and Section 4 in Athreya, Fukuchi
and Lahiri (1999).
1.3. Randomized construction of confidence sets.
In discrete set-ups it is more appropriate to work with confidence sets rather than confidence intervals for population quantiles. By consistency of the non-centeredm-out-of-ni.i.d. bootstrap (and the m-out-of-nblock bootstrap) we can apply this method to derive such confidence sets. Due to the discreteness of the underlying distribution a naive construction of confidence sets will be to conservative, that is, the effective limiting coverage of an asymptotic (1−α)-quantile is strictly larger than 1−α; actually equal to one ifα <1/2. If one does not want to use conservative confidence sets with (too) large coverages, one can compensate this effect by randomization techniques. More precisely, we proceed as follows: We calculate one confidence set for the sample quantile with coverage larger than the prescribed size 1 −α and another one with a coverage (asymptotically) smaller than 1−α. Then, we choose randomly (with an appropriate distribution) one of these sets and use this to construct a final confidence set for the population
12 CARSTEN JENTSCH AND ANNE LEUCHT
quantile of asymptotic level 1−α. Another difficulty that has to be taken into account is that we have bootstrap consistency only without centering, that is,
P∗(Qb∗p,m≤x)≈P(Qbp ≤x), butP∗(Qb∗p,m−Qbp≤x)6≈P(Qbp−Qp ≤x), (21)
such that the standard construction of bootstrap confidence intervals is not possible. Let Vn
denote the support of the empirical marginal distribution based onX1, . . . , Xn. Then, we define
large and small confidence sets CSL andCSS, respectively, for the sample quantile
CSL= F∗−b 1 Q∗p,m(α/2), F ∗−1 b Q∗p,m(1−α/2) ∩Vn, CSS = F∗−b 1 Q∗ p,m (α/2), F∗−b 1 Q∗ p,m (1−α/2) ∩Vn,
and their coverages
covL=P∗(Qb∗p,m∈CSL), covS =P∗(Qb∗p,m ∈CSS).
Note that covL ≥1−α while the size of covS is not clear in finite samples. It will turn out to
be less than 1−α in the limit. Finally, we specify
p∗= 1−α−covS
covL−covS
and define the bootstrap approximation of the confidence set for the sample quantile
g CS= ( CSL if Y ≤p∗ CSS ifY > p∗ ,
whereY ∼U nif(0,1) is chosen independently from all observations and all bootstrap variables. A corresponding confidence set for the population quantile is then given by
CS=CSg−Qbp+H(Qb∗p,m).
Due to (21) and as P(Qbp ∈ gCS) → 1−α holds, the use of a correction term H(Qb∗p,m) :=
F∗−b 1
Q∗
p,m
(0.4) is necessary as an approximation of the true quantile Qp; see proof of Theorem 1.6
below. In principle, any value in (0,1/2] can be used instead of 0.4.
Theorem 1.6. Suppose that either the assumptions of Theorem 1.4 or Theorem 1.5 hold true.
Then, for α∈(0,1/2), we have
P(Qp ∈CS) −→
n→∞1−α.
Remark 1.4 (On the use ofV orVn). The effect of usingV or Vn is asymptotically negligible.
For applications it might be reasonable to assume either that V is known in advance or that it
is unknown. In the first case V should be used to construct the confidence intervals and in the
latter case Vn seems to be the more reasonable choice.
1.4. Simulations.
In this section, we illustrate the bootstrap performance by means of coverage rates of (1−α )-confidence sets CS for α = 0.05 as proposed in the previous section. To cover both cases of i.i.d. as well as time series data, letX1, . . . , Xn be either
a) an i.i.d. realization of a binomial distributionXi∼Bin(N, π)
or
b) a realization of a (Poisson-)INAR(1) model Xt=β◦Xt−1+ǫt, whereǫt∼P oi(λ(1−β))
is Poisson-distributed and β◦k ∼Bin(k, β) for k ∈N0 denotes the binomial thinning
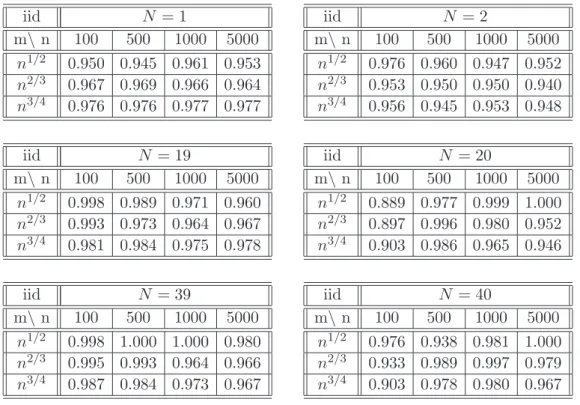
iid N = 1 m\ n 100 500 1000 5000 n1/2 0.950 0.945 0.961 0.953 n2/3 0.967 0.969 0.966 0.964 n3/4 0.976 0.976 0.977 0.977 iid N = 2 m\ n 100 500 1000 5000 n1/2 0.976 0.960 0.947 0.952 n2/3 0.953 0.950 0.950 0.940 n3/4 0.956 0.945 0.953 0.948 iid N = 19 m\ n 100 500 1000 5000 n1/2 0.998 0.989 0.971 0.960 n2/3 0.993 0.973 0.964 0.967 n3/4 0.981 0.984 0.975 0.978 iid N = 20 m\ n 100 500 1000 5000 n1/2 0.889 0.977 0.999 1.000 n2/3 0.897 0.996 0.980 0.952 n3/4 0.903 0.986 0.965 0.946 iid N = 39 m\ n 100 500 1000 5000 n1/2 0.998 1.000 1.000 0.980 n2/3 0.995 0.993 0.964 0.966 n3/4 0.987 0.984 0.973 0.967 iid N = 40 m\ n 100 500 1000 5000 n1/2 0.976 0.938 0.981 1.000 n2/3 0.933 0.989 0.997 0.979 n3/4 0.903 0.978 0.980 0.967
Table 1. Coverage rates of (1−α)-bootstrap confidence setsCS withα= 0.05
for the medianXmed ofXt∼Bin(N,0.5)
for several choices of N, sample sizes nand bootstrap sample sizes m.
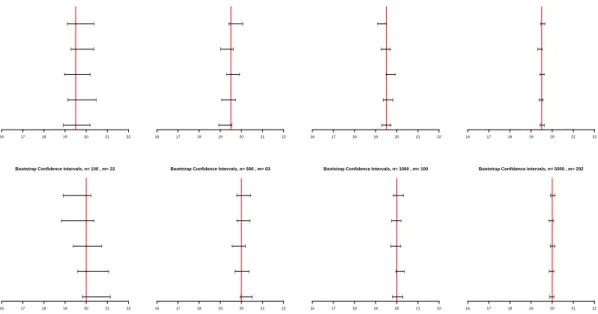
Bootstrap Confidence Sets, n= 100 , m= 22
16 17 18 19 20 21 22
Bootstrap Confidence Sets, n= 500 , m= 63
16 17 18 19 20 21 22
Bootstrap Confidence Sets, n= 1000 , m= 100
16 17 18 19 20 21 22
Bootstrap Confidence Sets, n= 5000 , m= 292
16 17 18 19 20 21 22
Bootstrap Confidence Sets, n= 100 , m= 22
16 17 18 19 20 21 22
Bootstrap Confidence Sets, n= 500 , m= 63
16 17 18 19 20 21 22
Bootstrap Confidence Sets, n= 1000 , m= 100
16 17 18 19 20 21 22
Bootstrap Confidence Sets, n= 5000 , m= 292
16 17 18 19 20 21 22
Figure 3. Confidence sets CS for the median Xmed from five realizations of
X1, . . . , Xn withXi ∼Bin(N,0.5) i.i.d. forN = 39 (upper panels) andN = 40
(lower panels), several sample sizesnand bootstrap sample sizes m=n2/3. The true median is marked with a red vertical line.
14 CARSTEN JENTSCH AND ANNE LEUCHT INAR λ= 3.67206..., iid m\ n 100 500 1000 5000 n1/2 0.989 0.993 0.963 0.972 n2/3 0.978 0.989 0.977 0.969 n3/4 0.985 0.980 0.984 0.988 INAR λ= 4, iid m\ n 100 500 1000 5000 n1/2 0.801 0.778 0.882 0.957 n2/3 0.800 0.923 0.943 0.962 n3/4 0.820 0.901 0.940 0.939 INAR λ= 3.67206..., MBB,l=m1/2 m\ n 100 500 1000 5000 n1/2 0.989 0.990 0.969 0.966 n2/3 0.986 0.982 0.971 0.980 n3/4 0.981 0.979 0.986 0.986 INAR λ= 4, MBB,l=m1/2 m\ n 100 500 1000 5000 n1/2 0.829 0.762 0.868 0.962 n2/3 0.805 0.930 0.928 0.953 n3/4 0.818 0.895 0.942 0.955
Table 2. Coverage rates of (1−α)-bootstrap confidence setsCS withα= 0.05
for the median Xmed of the INAR(1) model Xt =β◦Xt−1+ǫt,β = 0.5 for two
choices of λ and several sample sizes n and bootstrap sample sizes m. Results for i.i.d. resampling (iid, upper tables) and the moving block bootstrap (MBB, lower tables) with block length l=m1/2 are given.
The quantity of interest is the (sample) median, where we consider different parameter settings for both cases a) and b) that lead to degenerate one-point as well as non-degenerate two-point limiting distributions, respectively. In all simulations we have used V to construct confidence sets; compare Remark 1.4.
In Table 1, we show coverage rates of confidence sets for model a) for several sample sizes
n ∈ {100,500,1000,5000} and parameter settings with π = 0.5 and N ∈ {1,2,19,20,39,40}, where odd N leads to a non-degenerate limiting distribution (N = 1 is the fair coin flip) and even N results in a degenerate one-point limiting distribution. In Figure 3, we show typical bootstrap confidence sets for the examples Bin(39,0.5) and Bin(40,0.5). As our theory pro-vided in Section 1.2 suggests, we use the m-out-of-n bootstrap to mimic correctly the limiting behavior of sample quantiles in the degenerate as well as the non-degenerate case. To illustrate how sensitive the bootstrap reacts on the choice of the bootstrap sample size, we show results for several (rounded) values of m ∈ {n1/2, n2/3, n3/4}. For each parameter setting, we generate
K = 1000 time series and B = 1000 bootstrap replicates are used to construct the confidence set as described in Section 1.3. Table 1 reports a good overall finite sample performance of our procedure. Increasing binomial parameter N leads to higher variance of the data generating process, i.e. var(Xt) = N/4. Hence confidence sets are larger and we observe a slight
overcov-erage. Moreover, we observe that confidence sets for even N are more conservative than for odd N which is due to the degeneracy of the limit distribution of the sample median for even
N. Our simulation study shows that the bootstrap method is robust for different choices of the intensitym. If N is large, small choices ofmlead to more conservative confidence intervals than large ones. The effect of overcoverage can be explained by larger variability caused by small bootstrap sample sizes m.
In the set-up b), displayed in Table 2, we consider again the non-degenerate case for λ = 3.67206... such thatXmed= 3 as well as the degenerate case for λ= 4 such that Xmed= 4. As
discussed in Remark 1.3, Table 2 shows that already the i.i.d. low intensity bootstrap leads to valid results and the block bootstrap does not lead to visible improvements of the performance.
Part II: Mid-distribution quantiles
2.1. Asymptotics for sample mid-quantiles.
Suppose we observeX1, . . . , Xnfrom a (τ-dependent) process with discrete support supp(PX1) =
V as defined in (19). Instead of considering classical quantiles as in Part I of the present paper, Parzen (1997, 2004) and Ma, Genton and Parzen (2011) suggested to investigate a modified quantile function of the corresponding so-called mid-distribution function Fmid, which is given
by
Fmid(x) =F(x)−0.5p(x), x∈R,
where, as before, F denotes the cdf of the random variable X with probability mass function
p(x) = P(X = x). Their concept allows for a meaningful interpretation of quantiles in the discrete setup and appears to be beneficial in cases of tied samples. Here, we refer to the paper of Ma, Genton and Parzen (2011) for details. In particular, it is argued there that the corre-sponding mid-quantiles behave more favorably. That is, contrary to classical sample quantiles in discrete setups, they showed that sample (mid-)quantiles based on the mid-distribution function converge to non-degenerate limiting distributions when properly centered and inflated with the usual √n-rate as long as they do not correspond to the boundary values of the support of the underlying distribution. In the latter case the limiting distribution is degenerate for any choice of the inflation factor. Moreover, they show that asymptotic theory coincides for mid-quantiles and classical quantiles if the underlying distribution is absolutely continuous. In view of this, mid-quantiles can be interpreted as a natural generalization of classical quantiles which appears to be robust to discreteness of the underlying distribution.
We first assume the support V to be bounded, V = {v1 < · · · < vd}, say. However, it turns
out that the case of unbounded support can be treated similarly and the asymptotics are even easier; see Remark 2.1 below. According to Ma, Genton and Parzen (2011) the mid-quantile function is a linear interpolation of the points (Fmid(vj), vj), j = 1, . . . , d. More precisely, we
define thepth population mid-quantileQp,mid as
Qp,mid= v1 ifp < Fmid(v1) vk ifp=Fmid(vk), k= 1, . . . , d λvk+ (1−λ)vk+1 ifp=λFmid(vk) + (1−λ)Fmid(vk+1), λ∈(0,1), k= 1, . . . , d−1 vd ifp > Fmid(vd) (22)
and its empirical counterpartQbp,mid as
b Qp,mid = v1 ifp <Fbmid(v1) vk ifp=Fbmid(vk)<Fbmid(vk+1), k= 1, . . . , d λnvk+ (1−λn)vk+1 ifp=λFbmid(vk) + (1−λn)Fbmid(vk+1), λn∈(0,1), b Fmid(vk)<Fbmid(vk+1), k= 1, . . . , d−1 vd ifp >Fbmid(vd) (23)
where Fbmid(x) = n−1Pnk=1{1(Xk ≤ x) −0.5·1(Xk = x)} is the empirical counterpart of
Fmid(x); see also Figure 4 for illustration. Our goal first is to extend the asymptotic results
of Ma, Genton and Parzen (2011) from i.i.d. data to strictly stationary, τ-dependent processes. Similar to Part I of the paper, any other concept of dependence might be applied as long as the
16 CARSTEN JENTSCH AND ANNE LEUCHT
CLT for the empirical distribution function holds. For sake of definiteness, we restrict ourselves to τ-dependence here.
Theorem 2.1 (Asymptotics of sample mid-quantiles for discrete distributions). Suppose that
X1, . . . , Xn are either i.i.d. or observations of a strictly stationary, τ-dependent process (Xt)t∈Z
with P∞h=0τ(h) < ∞. Let the support of PX1 be V = {v
1 < · · · < vd} and denote the
corre-sponding probabilities by a1, . . . , ad. Further, define a0 = ad+1 = 0, v0 = v1 and vd+1 = vd.
Then, we have √ n(Qbp,mid−Qp,mid)−→D 0 ifp < Fmid(v1) or p > Fmid(vd) Z1 ifp=λFmid(vk+1) + (1−λ)Fmid(vk+2), λ∈(0,1), k= 0, . . . , d−2 Z2 ifp=Fmid(vk+1), k= 1, . . . , d−2 Z3 ifp=Fmid(v1) Z4 ifp=Fmid(vd) (24)
where Z1, Z2, Z3, Z4 are random variables having certain non-degenerate distributions as
de-scribed in the following. Z1 is centered and normally distributed with variance
σ21 = 4 vk+1−vk+2 ak+2+ak+1 2 h′k+2Σ(k+2)hk+2, (25) where hk+2= 1, . . . ,1,1−Fmid(vk+2)−p ak+1+ak+2 ,1 2 − Fmid(vk+2)−p ak+1+ak+2 ′ and Σ(k+2) = (Σ j1,j2)j1,j2=1,...,k+2 with Σj1,j2 = P h∈Zcov(1(Xh = vj1),1(X0 = vj2)). The
density of Z2 is that of a centered normal distribution with variance
σ22− = 4 vk+1−vk ak+ak+1 2 n (1, . . . ,1,0.5)Σ(k+1)(1, . . . ,1,0.5)′o
on the negative real line and that of a centered normal distribution with variance
σ22+= 4 vk+2−vk+1 ak+1+ak+2 2 n (1, . . . ,1,0.5)Σ(k+1)(1, . . . ,1,0.5)′o
on the positive real line; such distributions are termed half-Gaussian or two-piece normal
dis-tributions. The distribution of Z3 has point mass of 1/2 in zero and admits a density on the
positive real line which is that of a centered normal distribution with variance σ2
2+. Similarly,
Z4 has point mass of 1/2 in zero and admits a density on the negative real line which is that of
a centered normal distribution with variance σ22−.
Observe that depending on the situation, the limiting results established in Theorem 2.1 include four different types of distributions. These are, degenerate, Gaussian, Gaussian and half-Gaussian with point masses at the boundary. Also observe that we present the limiting results for sample mid-quantiles in a different way than Ma, Genton and Parzen (2011). The results displayed in (24) will turn out to be convenient for investigating the applicability of bootstrap methods in the sequel. Nevertheless, in comparison to the i.i.d. case, only the covariance matrix Σ(k+2) changes.
Remark 2.1 (Boundary issues).
(i) In the boundary cases p < Fmid(v0) and p > Fmid(vd) we even getQbp,mid =Qp,mid with
probability tending to one; see the proof of Theorem 2.1. These stronger results are used in the proofs of bootstrap consistency later on.
p Qp,Qp,mid 1 0.5 1 0.5 0 p Qp,Qp,mid 3 1 2 1 0.5 0
Figure 4. Comparison of quantile function (red, solid) and mid-quantile
func-tion (black, dashed) forBin(1,1/2) (left panel) andBin(3,1/2) (right panel).
(ii) Note that the results of Theorem 2.1 carry over to countable supportV as long as it does
not contain an accumulation point. Then, the cases p < Fmid(v1) and/or p > Fmid(vd)
simply disappear; see also Remark 2 in Ma, Genton and Parzen (2011).
Remark 2.2. Similar to Theorem 1.3, it is possible to prove joint convergence of several sample mid-quantiles. For clarity of exposition, we do not give the exact convergence results here, but mention that multivariate limiting distributions of several sample mid-quantiles can be obtained essentially by combining the univariate results of Theorem 2.1 above.
Before considering the bootstrap for mid-quantiles in Subsection 2.2, we first illustrate the concept of mid-quantiles with the help of a continuation of the coin flip example discussed in the Introduction; compare also Figure 4.
Toy example: Coin flip data for mid-quantiles.
Suppose a fair coin is flipped independently n times and we observe a sequence X1, . . . , Xn
of zeros and ones such that P(Xt = 0) = 1/2 = 1−P(Xt = 1). Let Xmed,mid =Q0.5,mid and
b
Xmed,mid =Qb0.5,middenote the population mid-median and the sample mid-median, respectively.
Then, (22) gives Xmed,mid = 1/2 and from Theorem 2.1, we get
√
n(Xbmed,mid−Xmed,mid)−→ ND (0,1/4). (26)
Thus, the sample mid-median fulfills a CLT and, in particular, it is a √n-consistent estimator
for the mid-median.
2.2. Bootstrapping sample mid-quantiles.
We showed that standard bootstrap proposals may fail in the purely discrete data case for classi-cal sample quantiles. A closer inspection of the bootstrap invalidity result of Theorem 1.1 shows that this issue is caused by the discreteness of the distributions which in turn leads to quantile functions having jumps. In view of this observation, the use of mid-quantiles may circumvent this problem, because the corresponding mid-quantile function is piecewise linear and thus, in particular, continuous by construction; compare Figure 4.
18 CARSTEN JENTSCH AND ANNE LEUCHT
are capable to mimic correctly the limiting distributions established in Theorem 2.1. Here, we allow explicitly the case m=nto cover also Efron’s bootstrap and the standard moving block bootstrap. To fix some notation, let Qb∗p,mid,m denote the pth bootstrap sample mid-quantile based on bootstrap observationsX1∗, . . . , Xm∗. More precisely and analogue to (23), we define
b Q∗p,mid,m= v1 ifp <Fbmid,m∗ (v1) vk ifp=Fbmid,m∗ (vk)<Fbmid,m∗ (vk+1), k= 1. . . , d λ∗mvk+ (1−λ∗m)vk+1 ifp=λ∗mFbmid,m∗ (vk) + (1−λ∗m)Fbmid,m∗ (vk+1), λ∗m ∈(0,1), b F∗ mid,m(vk)<Fbmid,m∗ (vk+1), k= 1, . . . , d−1 vd ifp >Fbmid,m∗ (vd) (27)
where Fbmid,m∗ (x) = m−1Pmk=1{1(Xk∗ ≤ x)−0.5·1(Xk∗ = x)} is the bootstrap counterpart of
b
Fmid(x) based onX1∗, . . . , Xm∗.
Theorem 2.2 (Asymptotics of bootstrap sample mid-quantiles for discrete distributions). Sup-pose either (i) or (ii) hold, where
(i) X1, . . . , Xn are i.i.d. and we draw i.i.d. bootstrap replicates X1∗, . . . , Xm∗ such that m→
∞ and m=o(n) or m=n as n→ ∞
(ii) X1, . . . , Xnareτ-dependent and we apply an m-out-of-nblock bootstrap with block length
lto getX1∗, . . . , Xm∗ such thatl/m+ 1/m+ 1/l=o(1)andm=o(n)or m=nasn→ ∞
Then, we have √ m(Qb∗p,mid,m−Qbp,mid)−→D 0 if p < Fmid(v1) or p > Fmid(vd) Z1 if p=λFmid(vk+1) + (1−λ)Fmid(vk+2), λ∈(0,1), k= 0, . . . , d−2 (28) and √ m(Qb∗p,mid,m−Qp,mid)−→D Z2 if p=Fmid(vk+1), k= 1, . . . , d−2 Z3 if p=Fmid(v1) Z4 if p=Fmid(vd) (29)
in probability, respectively. The distributions of Z1 to Z4 are described in Theorem 2.1.
At this point, it is worth noting that the results of Theorem 2.2 above do not require at all the use of an m-out-of-n-type bootstrap procedure with m =o(n) to mimic correctly the complicated limiting distributions in all cases presented in Theorem 2.1. However, a comparison of (24) with (28) and (29) shows that the correct centering for the bootstrap sample mid-quantiles depends on the true situation. That is, Qb∗p,mid,m has to be centered around the sample mid-quantile
b
Qp,mid for the first two cases and around the population quantile Qp,mid for the latter three.
However, as the true mid-quantile function is generally unknown, the true situation is also not known. Consequently, the results of Theorem 2.2 are per se useless for practical applications as it is not clear which centering has to be used.
To overcome this issue, we require the bootstrap procedure to be valid for all different cases when centered around one and the same quantity. To achieve this, note that the difference of the left-hand sides of (28) and (29) computes to
√
m(Qb∗p,mid,m−Qp,mid)−√m(Qb∗p,mid,m−Qbp,mid) =
r m n n√ n(Qbp,mid−Qp,mid) o = OP r m n (30)
and vanishes form=o(n), but not for m=n. This leads to the following result.
Corollary 2.1(Consistency ofm-out-of-nbootstraps for sample mid-quantiles). Suppose either
(i) or (ii) in Theorem 2.2 hold with m=o(n). Then, we have
dKS
√
m(Qb∗p,mid,m−Qbp,mid),√n(Qbp,mid−Qp,mid)
P
−→0.
2.3. Randomized construction of confidence intervals.
We invoke the ideas of Section 1.3 to construct confidence intervals of level 1−α for mid-quantiles. These quantities take their values in the interval [v1, vd] if V = {v1 < . . . < vd} in
contrast to classical quantiles that take there values only in the countable setV. In particular, if the image of the mid-quantile function is the whole real line, the limit distribution is continuous by Theorems 2.1 and 2.2. Therefore no randomization techniques are required to construct asymptotic exact (1−α) confidence sets. If this is not the case, a randomization procedure as described in the sequel has to be applied. Note that, the asymptotics in the previous section do not rely on the (empirical) mid-quantile itself but on suitably centered and inflated versions. Therefore, instead ofCSL andCSS defined in Section 1.3, we consider large and small intervals
of the form CIL,mid = F√∗−1 m(Qb∗ p,mid,m−Qbp,mid) (α/2), F√∗−1 m(Qb∗ p,mid,m−Qbp,mid) (1−α/2) , CIS,mid(r) = F√∗−1 m(Qb∗ p,mid,m−Qbp,mid) (α/2), F√∗−1 m(Qb∗ p,mid,m−Qbp,mid) (1−α/2) , CIS,mid(l) = F√∗−m1(Qb∗ p,mid,m−Qbp,mid) (α/2), F√∗−m1(Qb∗ p,mid,m−Qbp,mid) (1−α/2)
and their coverages
covL,mid =P∗(√m(Qb∗p,mid,m−Qbp,mid)∈CIL,mid),
cov(S,midr) =P∗(√m(Qb∗p,mid,m−Qbp,mid)∈CIS,mid(r) ),
cov(S,midl) =P∗(√m(Qb∗p,mid,m−Qbp,mid)∈CIS,mid(l) ).
Finally, we specify the probability for choosing the large interval
p∗mid = 1−α−cov(S,midr)
covL,mid−cov(
r)
S,mid
, covS,mid(r) ≤1−α
1−α−cov(S,midl)
covL,mid−cov(
l)
S,mid
, otherwise
and define the bootstrap approximation of the confidence set for the p-level mid-quantile
CI = " b Qp,mid− F∗−1 √m(Qb∗ p,mid,m−Qp,midb ) (1−α/2) √ n , Qbp,mid− F∗−1 √m(Qb∗ p,mid,m−Qp,midb ) (α/2) √ n # ifY ≤p∗mid b Qp,mid− F∗−1 √m(Qb∗ p,mid,m−Qp,midb ) (1−α/2) √ n , Qbp,mid− F∗−1 √m(Qb∗ p,mid,m−Qp,midb ) (α/2) √ n # ifY > p∗mid
and covS,mid(r) ≤1−α
" b Qp,mid− F∗−1 √m(Qb∗ p,mid,m−Qp,midb )(1−α/2) √ n , Qbp,mid− F∗−1 √m(Qb∗ p,mid,m−Qp,midb )(α/2) √ n ! otherwise ,
whereY ∼U nif(0,1) is chosen independently from all observations and all bootstrap variables. This gives an asymptotic confidence interval of level 1−α.
20 CARSTEN JENTSCH AND ANNE LEUCHT
Bootstrap Confidence Intervals, n= 100 , m= 22
16 17 18 19 20 21 22 [ ) [ ] [ ] ( ] [ ]
Bootstrap Confidence Intervals, n= 500 , m= 63
16 17 18 19 20 21 22 [ ] ( ) ( ) [ ] [ ]
Bootstrap Confidence Intervals, n= 1000 , m= 100
16 17 18 19 20 21 22 [ ] [ ] [ ) [ ] ( )
Bootstrap Confidence Intervals, n= 5000 , m= 292
16 17 18 19 20 21 22 [ ] [ ] ( ) [ ) [ )
Bootstrap Confidence Intervals, n= 100 , m= 22
16 17 18 19 20 21 22 [ ] [ ] ( ) ( ) [ ]
Bootstrap Confidence Intervals, n= 500 , m= 63
16 17 18 19 20 21 22 [ ] [ ) ( ] ( ] [ )
Bootstrap Confidence Intervals, n= 1000 , m= 100
16 17 18 19 20 21 22 [ ] ( ) [ ) ( ) ( )
Bootstrap Confidence Intervals, n= 5000 , m= 292
16 17 18 19 20 21 22 [ ] [ ] [ ] ( ) [ ]
Figure 5. Confidence intervals CI for the mid-median Xmed,mid from five
real-izations of X1, . . . , Xn with Xi ∼ Bin(N,0.5) i.i.d. for N = 39 (upper panels)
and N = 40 (lower panels), several sample sizes n and bootstrap sample sizes
m=n2/3. The true mid-median is marked with a red vertical line.
Theorem 2.3. Suppose that the assumptions of Corollary 2.1 hold true. Then, forα∈(0,1/2), P(Qp,mid∈CI) −→
n→∞1−α. 2.4. Simulations.
In this section, we illustrate the bootstrap performance by means of coverage rates of (1−α )-confidence intervalsCI forα= 0.05 as proposed in the previous section. To make the simulation results comparable to those obtained in Section 1.4, we use the same settings here. Recall that the image of mid-quantile functions is continuous which leads to confidence intervals rather than confidence sets; compare Figure 5. Contrary to the results in set-up a) obtained for classical quantiles, all choices of the binomial parameter N lead to non-degenerate distributions for the sample mid-median. In view of Table 3, we observe that the bootstrap works equally well in both cases. Even though the concept of mid-quantiles slightly differs from the classical ones in the discrete set-up, a smooth modification of the quantile function appears to be beneficial wrt coverage rate performance of bootstrap confidence intervals. In comparison to the results displayed in Table 2 for classical quantiles, Table 4 illustrates the necessity of a block-type resampling scheme that takes the dependence structure of the INAR process in setting b) into account.
Conclusion
In this paper, we investigated bootstrap validity for classical quantiles as well as so-called mid-quantiles of discrete distributions. The classical quantile function is piecewise constant and discontinuous which makes statistical inference challenging. The concept of mid-distribution tries to overcome this deficiency by relying on piecewise linear mid-quantile functions that are continuous, but not differentiable. This approach is partly motivated by the fact that the latter
iid N = 1 m\ n 100 500 1000 5000 n1/2 0.950 0.920 0.940 0.957 n2/3 0.920 0.943 0.943 0.956 n3/4 0.955 0.954 0.947 0.944 iid N = 2 m\ n 100 500 1000 5000 n1/2 0.876 0.880 0.909 0.916 n2/3 0.877 0.917 0.929 0.940 n3/4 0.905 0.938 0.923 0.930 iid N = 19 m\ n 100 500 1000 5000 n1/2 0.910 0.944 0.937 0.957 n2/3 0.930 0.942 0.960 0.950 n3/4 0.940 0.950 0.959 0.944 iid N = 20 m\ n 100 500 1000 5000 n1/2 0.930 0.930 0.939 0.931 n2/3 0.937 0.928 0.941 0.942 n3/4 0.941 0.924 0.930 0.940 iid N = 39 m\ n 100 500 1000 5000 n1/2 0.914 0.946 0.930 0.950 n2/3 0.903 0.928 0.932 0.956 n3/4 0.918 0.939 0.950 0.966 iid N = 40 m\ n 100 500 1000 5000 n1/2 0.921 0.937 0.914 0.942 n2/3 0.928 0.941 0.944 0.944 n3/4 0.926 0.948 0.942 0.933
Table 3. Coverage rates of (1−α)-bootstrap confidence setsCI withα= 0.05
for the mid-medianXmed,mid ofXi∼Bin(N,0.5) for several choices ofN, sample
sizesn and bootstrap sample sizesm.
INAR λ= 3.67206, iid m\ n 100 500 1000 5000 n1/2 0.739 0.761 0.777 0.803 n2/3 0.748 0.773 0.794 0.798 n3/4 0.749 0.808 0.785 0.792 INAR λ= 4, iid m\ n 100 500 1000 5000 n1/2 0.739 0.779 0.742 0.754 n2/3 0.758 0.764 0.768 0.765 n3/4 0.748 0.780 0.772 0.772 INAR λ= 3.67206, MBB, l=m1/2 m\n 100 500 1000 5000 n1/2 0.825 0.887 0.925 0.931 n2/3 0.861 0.925 0.930 0.950 n3/4 0.867 0.927 0.942 0.936 INAR λ= 4, MBB, l=m1/2 m\n 100 500 1000 5000 n1/2 0.827 0.903 0.899 0.924 n2/3 0.858 0.916 0.928 0.949 n3/4 0.853 0.935 0.922 0.950
Table 4. Coverage rates of (1−α)-bootstrap confidence setsCI withα= 0.05
for the mid-medianXmed,mid of the INAR(1) modelXt=β◦Xt−1+ǫt,β= 0.5
for two choices of λ and several sample sizes n and bootstrap sample sizes m. Results for i.i.d. resampling (iid, upper tables) and the moving block bootstrap (MBB, lower tables) with block lengthl=m1/2 are given.
22 CARSTEN JENTSCH AND ANNE LEUCHT
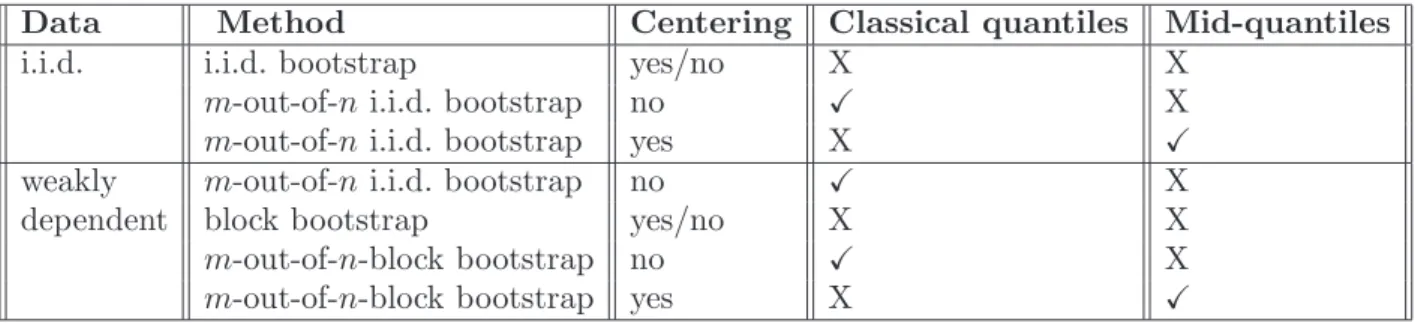
Data Method Centering Classical quantiles Mid-quantiles
i.i.d. i.i.d. bootstrap yes/no X X
m-out-of-n i.i.d. bootstrap no X X
m-out-of-n i.i.d. bootstrap yes X X
weakly m-out-of-n i.i.d. bootstrap no X X
dependent block bootstrap yes/no X X
m-out-of-n-block bootstrap no X X
m-out-of-n-block bootstrap yes X X
Table 5. Bootstrap (in-)consistency for single sample (mid-)quantiles
function coincides with the classical quantile function if the underlying distribution is contin-uous. Indeed, in contrast to classical quantiles, mid-quantiles can be estimated consistently. Regarding the validity of bootstrap methods this concept alone is not entirely successful. In both cases, low-intensity (block) bootstrap methods are required to mimic the distribution of the (mid-)quantile estimators correctly. In particular two tuning parameters, i.e. the intensity
m and the block length l have to be chosen, irrespective of the type of quantiles. Moreover, in order to overcome the issue of potentially too conservative intervals, randomization techniques have to be invoked. An overview of the (in-)consistency of all bootstrap methods addressed in this paper is given in Table 5.
Still, smoothness of mid-quantile functions in comparison to ordinary quantile functions turns out to be beneficial wrt the finite sample performance. Despite the application of randomization techniques, confidence sets for classical quantiles tend to be quite conservative. This effect is not observed for the mid-distribution counterparts where bootstrap consistency for commonly centered quantities lead to a straightforward construction of confidence intervals. Therefore, the question arises whether further smooth modifications of mid-quantiles may lead to even better results. A first attempt has been proposed by Wang and Hutson (2011) which is motivated by the Harrell-Davis quantile estimator for continuous distributions. These quantile estimators appear as sums of weighted order statistics where the weights are smooth functions of Beta cdfs. However, while Harrell and Davis (1982) use this method for the order statistic of the sample itself, Wang and Hutson (2011) apply this to the support instead. Hence, it is not clear how their definition of quantiles can be used directly for continuous data and whether there is a deep relationship between classical quantiles and these variants as in the case of mid-quantiles. Therefore, we did not follow this line of research in the present paper. Nevertheless, we conjecture that proving consistency of i.i.d. and block bootstrap methods is straightforward since the proof of asymptotic normality in Wang and Hutson (2011) relies on the CLT for the empirical cdf and the ∆-method only. The construction of other smooth modifications of quantiles and even more importantly the identification of their relationship to classical quantiles for continuous distributions and convenience for practitioners goes far beyond the scope of our paper and should be investigated in future research.
Proofs and auxiliary results
Proof of Theorem 1.1.
We first prove (14). With the notation
Zn=√n b Fn(ǫ)−F(ǫ) p var(1(X1 ≤ǫ)) and Zn∗ =√npFbn∗(ǫ)−Fbn(ǫ) var(1(X1 ≤ǫ))
for any fixedǫ∈(0,1) and by using the fact that for any distribution functionGonR,G(x)≥t
if and only if x≥G−1(t), we get
P∗(Xbmed∗ = 0) = P∗(Xbmed∗ ≤ǫ) =P∗ 1 2 ≤Fb ∗ n(ǫ) = 1−P∗(Zn∗<−Zn) = 1−Φ (−Zn) + Φ (−Zn)−P∗(Zn∗ <−Zn)
In conjunction with Polya’s Theorem, we get from Lemma A.1 that
|Φ (−Zn)−P∗(Zn∗<−Zn)| ≤sup x∈R|
Φ (x)−P∗(Zn∗ < x)|=oP(1).
By Slutsky’s Theorem, it remains to show that
1−Φ (−Zn)−→D U ∼U nif(0,1),
which follows from Zn −→D Z ∼ N(0,1), the Simulation Lemma and from U := 1−Ue ∼
U nif(0,1) if Ue ∼U nif(0,1). The result in (i) follows immediately from (11) and
P∗(Xbmed∗ = 0)−P(Xbmed= 0) −→D U− 1 2 ∼U nif(0,1/2).
Now, we show the result in (ii). AsXbmed,Xbmed∗ ∈ {0,1},Xmed= 0 and due to (5) and (13), we
have to derive the asymptotics of the bivariate random variables
P∗(Xbmed∗ −Xbmed≤ −1)−P(Xbmed−Xmed≤ −1)
P∗(Xbmed∗ −Xbmed≤0)−P(Xbmed−Xmed≤0)
= P∗(Xbmed∗ −Xbmed≤ −1) P∗(Xbmed∗ −Xbmed≤0)−12 +oP(1)
to compute the supremum of both components. By straightforward calculations and due to
P∗(Xbmed∗ ≤ 0) = 1 −Φ(−Zn) +oP(1) as obtained in the first part of this proof, the last
expression becomes
1(Xbmed= 0)P∗(Xbmed∗ ≤ −1) + 1(Xbmed= 1)P∗(Xbmed∗ ≤0)
1(Xbmed= 0)P∗(Xbmed∗ ≤0) + 1(Xbmed= 1)P∗(Xbmed∗ ≤1)−12 +oP(1) = 1(12 <Φ(−Zn))P∗(Xbmed∗ ≤0) 1(21 ≥Φ(−Zn))P∗(Xbmed∗ ≤0) + 1(12 <Φ(−Zn))−12 +oP(1) = 1(12 <Φ(−Zn))(1−Φ(−Zn)) 1(12 ≥Φ(−Zn))(1−Φ(−Zn)) + 1(12 <Φ(−Zn))−12 +oP(1),
which converges in probability by the continuous mapping theorem (see e.g. Pollard (1984, III.6)) towards 1(12 <Φ(−Z))(1−Φ(−Z)) 1(12 ≥Φ(−Z))(1−Φ(−Z)) + 1(12 <Φ(−Z))−12 = 1(12 <Ue)(1−Ue) 1(12 ≥Ue)(1−Ue) + 1(12 <Ue)−12 .(31) Further, it holds 1 1 2 <Ue (1−Ue) = ( 1−U ,e 12 <Ue 0, 12 ≥Ue ≤ ( 1 2, 12 <Ue 1−Ue−12, 12 ≥Ue = 1 1 2 ≥Ue (1−Ue) + 1 1 2 <Ue −1 2
24 CARSTEN JENTSCH AND ANNE LEUCHT
such that the second component of (31) is always the maximum of both. To derive the cdf, let
x∈R and, withU = 1−Ue, we get P 1 1 2 ≥Ue (1−Ue) + 1 1 2 <Ue −12 ≤x = P 1 1 2 ≤U U + 1 1 2 > U −1 2 ≤x = P 1 1 2 ≤U U + 1 1 2 > U −1 2 ≤x, U ≥ 1 2 +P 1 1 2 ≤U U+ 1 1 2 > U −12 ≤x, U < 1 2 = P 1 2 ≤U ≤x+ 1 2 +P 1 2 ≤x, U < 1 2 = 0, x <0 x, x∈[0,1/2) 1/2, x≥1/2 + 0, x <0 0, x∈[0,1/2) 1/2, x≥1/2 = x1[0,1 2)(x) + 1[12,∞)(x). Proof of Theorem 1.2.
(i) This part is a special case of Theorem 1.4.
(ii) The second statement follows similarly to the proof of Theorem 1.1 by using part(i), the results from above and from
P∗(Xbm,med∗ −Xbmed≤ −1)−P(Xbmed−Xmed≤ −1)
P∗(Xb∗
m,med−Xbmed≤0)−P(Xbmed−Xmed≤0)
! = 1( 1 2 <Φ(−Zn))P∗(Xbm,med∗ ≤0) 1(21 ≥Φ(−Zn))P∗(Xbm,med∗ ≤0) + 1(12 <Φ(−Zn))−12 ! +oP(1) = 1(12 <Ue)12 1(12 ≥Ue)12 + 1(12 <Ue)− 12 +oP(1) = 1(U < 12)12 1(U ≥ 1 2)12 + 1(U < 12)− 12 +oP(1) as 1(U < 1/2)1/2 = 1(U ≥ 1/2)1/2 + 1(U < 1/2)−1/2 and 1(U < 1/2) = 2Se is Bernoulli-distributed.
Proof of Theorem 1.3. (i) Note that Qbp and Qp take their values in V only. Under our
assumptions onV there exists an ǫ >0 such that for each p∈(0,1)
P(Qbp=Qp) =P(Qbp ∈(Qp−ǫ, Qp+ǫ]).
This implies
P(Qbp =Qp) =P(p≤Fbn(Qp+ǫ))−P(p≤Fbn(Qp−ǫ)) (32)
due to the monotonicity of Fbn. The first term on the rhs tends to one by the WLLN,
which is a consequence of Theorem A.1, and the second term vanishes asymptotically with the same reasoning.