VCU Scholars Compass
VCU Scholars Compass
Theses and Dissertations Graduate School
2019
Group Decision-Making
Group Decision-Making
Edward Cook
Virginia Commonwealth University
Follow this and additional works at: https://scholarscompass.vcu.edu/etd
Part of the Business Administration, Management, and Operations Commons, Management Sciences and Quantitative Methods Commons, and the Operations Research, Systems Engineering and Industrial Engineering Commons
© The Author
Downloaded from Downloaded from
https://scholarscompass.vcu.edu/etd/5928
This Dissertation is brought to you for free and open access by the Graduate School at VCU Scholars Compass. It has been accepted for inclusion in Theses and Dissertations by an authorized administrator of VCU Scholars Compass. For more information, please contact [email protected].
Group Decision-Making
A dissertation submitted in partial fulfillment of the requirements for the degree of Doctorate of Philosophy at Virginia Commonwealth University.
by
Edward Lewis Cook
Doctor of Philosophy in Systems Modeling and Analysis
Director: Jason R. W. Merrick
Professor, Department of Supply Chain Management & Analytics
Virginia Commonwealth University Richmond, Virginia
ii
© Edward Lewis Cook 2019
iii
Acknowledgement
I would like to thank my daughters, Elizabeth, Caroline, and Anna, for their support and encouragement through the years of my studies. Beginning with my
deployment to the Green Zone in Baghdad where the idea to pursue this degree started and then continuing through the years of classes and research, they have suffered the loss of time with their father and yet have been encouraging and loving throughout. I am also grateful for the guidance and tutelage and friendship of my advisor, Dr. Jason Merrick. From the initial meeting soon after I returned to the US from Iraq still trying to adjust to life back home to the very last days of completing this work, he has been positive and encouraging and insightful. What I have learned form him is incalculable and invaluable. Finally, I need to thank Roxanne, my partner in life and in business. She is my Muse and my inspiration. Anything good I have achieved flows from her.
iv
Table of Contents
Chapter 1. Introduction ... 1
1.1. Individual and Group Decisions ... 1
1.2. Decision Analysis for Group Decisions ... 2
1.3. Game Theory for Non-cooperative Groups ... 6
1.4. Outline of the Dissertation ... 9
Chapter 2. The Value of Cooperative Group Decision Making ... 1
2.1. Developing the Group Value Hierarchy ... 5
2.2. Defining the utility function ... 7
2.3. Creating the single-dimensional utility functions ... 9
2.4. Determination of Alternatives ... 10
2.5. Scoring the value for each objective across alternatives ... 12
2.6. Conducting utility gap assessment ... 13
2.7. The Implementation ... 17
2.8. Outcomes ... 19
2.9. Stakeholder Reactions ... 22
2.10. Program Conclusion ... 23
2.11. Contributions from this Practical Approach ... 24
v
3.1. A Formal Framework for Group Decisions in Cooperative and Non-Cooperative
Situations ... 3
3.2. Optimal Strategies in Collaborative and Non-Collaborative Group Decisions ... 7
3.3. An Example of Two Diners ... 9
3.4. Non-Cooperative Decision-Making ... 14
3.5. Summary of Findings and Implications ... 27
3.6. Increasing Objectives ... 31
3.7. Contributions from the “Cost of Conflict” ... 32
Chapter 4. Social Network and Group Decisions ... 1
4.1. Social Network Theory Background ... 3
4.2. Social Networks and Influence in Strategic Group Decisions ... 4
4.3. Deriving Extrinsic Weights ... 6
4.3.1. Hub and Spoke ... 6
4.3.2. Chain ... 10
4.4. Interpretation of the results of stakeholder network examination: ... 12
4.5. Characterizing the influence of stakeholders ... 13
4.6. Returning to the Motivating Example ... 19
4.7. Contributions from Stakeholder Network Analysis... 24
Chapter 5. Conclusions ... 27
vi
Table of Figures
Figure 1. The Value Hierarchies of the Six Stakeholder Groups. ... 6 Figure 2. Top Two Levels of the Group Value Hierarchy... 7 Figure 3. Examples of value and utility curves. ... 10 Figure 4. The utility of each alternative decomposed by stakeholder (upper) and
objective (lower). ... 14 Figure 5. Utility gaps for each alternative by objective and each stakeholder. ... 16 Figure 6. Utility comparison: three original alternatives and the new pilot and roll
alternative. ... 18 Figure 7. Example of normal form game representing the outcomes of the possible choices by each decision-maker under the i-th objective. ... 5 Figure 8. The normal form game considering each decision-makers two objective utility function. ... 6 Figure 9. Example of Normal Form Game representing plays on two attributes
(“Matching Pennies” and “Disharmony”). ... 8 Figure 10. The seven traditional games and the two nontraditional but related games that were used to explore Non-Cooperative decision-making behavior... 9 Figure 11. Example of Normal Form Game representing two objectives about going to dinner. ... 10 Figure 12. Two Examples of Normal Form Games representing the combined objectives about going to dinner... 11
vii
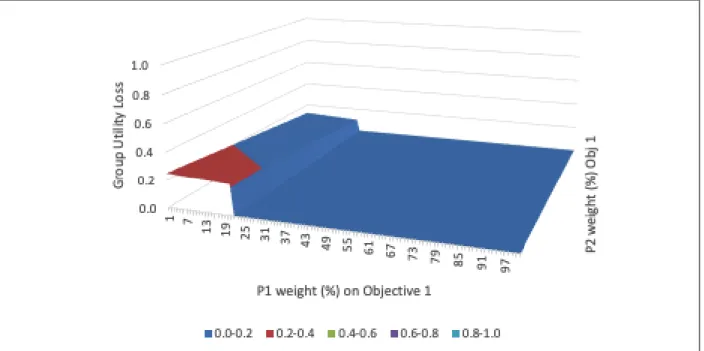
Figure 13. Regions of Group Utility Lost in Non-Cooperative Decision-Making for two diners going to dinner. ... 13 Figure 14. Example of two objectives modeled as “Matching Pennies” and
“Coordination”. ... 15 Figure 15. Regions of Group Utility Lost in Non-Cooperative Decision-Making for
“Matching Pennies” versus “Coordination”. ... 16 Figure 16. Regions of Pure Strategy Equilibria for “Matching Pennies” versus
“Coordination”. ... 16 Figure 17. Example of two objectives modeled as “Battle of the Sexes” and
“Coordination”. ... 18 Figure 18. Regions of Group Utility Lost in Non-Cooperative Decision-Making for “Battle of the Sexes” and “Coordination”. ... 19 Figure 19. Regions of Pure Strategy Equilibria for “Battle of the Sexes” and
“Coordination”. ... 19 Figure 20. Example of two objectives modeled as “Coordination” and
“Anti-Coordination”. ... 21 Figure 21. Regions of Group Utility Lost in Non-Cooperative Decision-Making for
“Coordination” and “Anti-Coordination”. ... 22 Figure 22. Regions of Pure Strategy Equilibria for “Coordination” and
“Anti-Coordination”. ... 22 Figure 23. Example of two objectives modeled as “Coordination” and “Hawk-Dove”. ... 23 Figure 24. Regions of Group Utility Lost in Non-Cooperative Decision-Making for
viii
Figure 25. Regions of Pure Strategy Equilibria for “Coordination” and “Hawk-Dove”. ... 25
Figure 26. Example of two objectives modeled as “Deadlock” and “Hawk-Dove”. ... 26
Figure 27. Regions of Group Utility Lost in Non-Cooperative Decision-Making for “Deadlock” and “Hawk-Dove”. ... 26
Figure 28. Regions of Pure Strategy Equilibria for “Deadlock” and “Hawk-Dove”. ... 27
Figure 29. The Cost of Conflict with 2 to 5 objectives... 32
Figure 30. The network structure for the Hub and Spoke configuration. ... 7
Figure 31. The network structure for the Chain configuration. ... 10
Figure 32. A five-node network structure. ... 15
Figure 33. The network configuration of the six stakeholders from the bank example. . 19
ix
Table of Tables
Table 1. The Alternatives Considered. ... 12
Table 2. Results of the Pairings of Games Indicating if the entire region (or part) has a difference between the Nash equilibrium and the optimal group utility. ... 28
Table 3. Betweenness Centrality of Five Node Example. ... 14
Table 4. Strength Centrality of the Five Node Example... 16
Table 5. Strength Centrality for Hub and Spoke. ... 17
Table 6. Strength Centrality for Chain. ... 18
Table 7. The weights elicited from the corporate stakeholders. ... 21
Table 8. The extrinsic weights for the corporate stakeholders from the network model. 21 Table 9. The Strength Centrality of the real example of the bank implementation. ... 25
x
Abstract
GROUP DECISION MAKING
By Edward Lewis Cook, Ph.D.
A dissertation submitted in partial fulfillment of the requirements for the degree of Doctor of Philosophy at Virginia Commonwealth University.
Director: Jason R. W. Merrick, Professor, Department of Supply Chain Management & Analytics
The present work explores improvements in group decision-making. It begins with a practical example using state-of-the-art techniques for a complex, high-risk decision. We show how these techniques can reveal a better alternative. Although we created an improved decision process, decision-makers were apt to protect their own organizations instead of the project. This tendency was reduced over the course of the decision-making process but inspired the first conceptual component of this work.
The first concept describes the “Cost of Conflict” that can arise in a group
decision, using game theory to represent the non-cooperative approach and comparing the outcome to the cooperative approach. We demonstrate that it is possible for the group to settle on a non-Paretto Nash equilibrium. The sensitivity of the decision-maker weights is revealed which led to the second conceptual portion of this work.
The second concept applies social network theory to study the influence between decision-makers in a group decision. By examining the number and strength of
xi
extrinsically derived weights by adding the network influences from other decision-makers. The two conceptual approaches provide a descriptive view of non-cooperative decisions where decision-makers still influence each other. These concepts suggest a prescriptive approach to achieving a higher group utility.
1
Chapter 1.
Introduction
Our aim in this work is to improve group decision-making, examining cooperative and non-cooperative group decisions in three studies. First, we implemented state-of-the-art methods in group decision theory and multi-attribute utility theory for high-value decision at a Fortune 100 company to demonstrate the value of a cooperative group decision amongst the executives. Second, we study the potential loss when the cooperative group approach is not used, which we call the “Cost of Conflict”. Finally, we study the influence individual stakeholders can have on a cooperative group decision using social network theory.
1.1. Individual and Group Decisions
In the last one hundred years, the understanding of decision-making has
advanced across a number of fields. With structural underpinnings from philosophy and mathematics, decision analysis has been further enhanced by the understanding of human cognition from psychology and economics. The flow of decision theory’s development began with the individual decision-maker and was described by Keynes (1921), Ramsey (1926), and de Finetti (1937, 1949) by modeling a rational, sequential process. In this initial work, the process was wholly owned by the individual decision-maker but even at this early stage, notions of game theory began to come through as seen in de Finetti’s work (de Finetti 1949) in which a game context is considered. It is not just the single decision-maker who can have influence on the final outcome of a decision process. The decision-maker plays a role in the “market” of the decision as one would in a financial market. This idea of a market introduces the decisions of
2
others as important or at least of impact to the decision process of the individual
decision-maker. The inauguration of game theory came with the landmark work of von Neumann and Morgenstern (1944) who for the first time fully described a coherent approach to games that was both mathematically rigorous and predictive.
Although game theory would later become important to understanding the group decision process and how individuals could come together to make a group decision, in these earlier stages of development, decision analysis remained largely focused on the decision process of the individual decision-maker. The work built from single objective decisions and then moved on to advance into work on multi-objective decisions.
Significant work still remains to be done in the understanding of group decision-making. Moreover, the approach of expanding from the understanding of the individual decision-maker to describe the group decision may not be sufficient to create both a description of how decisions are made and a direction on how the could be improved. Game theory may provide that needed tool.
1.2. Decision Analysis for Group Decisions
Broadly group decision can be thought of as any decision where a group of two or more individuals must jointly decide from a set of outcomes which impact all of the individuals in the group. For focus, this work will not include three classes of group decision-making as described by Keeney (2013). “One class is negotiations, because the individual negotiators are trying to best satisfy their own objectives rather than the group’s objectives, and each individual has veto power. A second class of decisions ruled out is voting situations where all votes are tabulated to select an alternative
3
according to a pre-specified rule, such as the candidate with the most votes wins. In this case, there is a collection of individual decisions by the voters that leads, with no specific group action, to a selected alternative. The third class of decisions is social planning or social welfare decisions where an individual planner or organization, after taking judgments and preferences of individuals affected by the decision into account, makes the decision.”
Early attempts to develop group decision-making theory began with the individual utility constructs and then expanding from there by aggregating those utilities through some function, but problems arose. Arrow’s Impossibility Theorem (Arrow 1951) was one of the first to show that the aggregation was likely to result in the group utility matching that of only one decision-maker. The solution to the problems of extending individual decision-making to group decision-making has been approached in several different ways. First, Raiffa (1968) posited the application of a group utility function and also a group probability distribution which can then be used to calculate a group
expected utility for every alternative in the decision hierarchy. Others extended this approach through a Bayesian view (Seidenfeld 1989, Mongin 1995, 1998, Gilboa 2004). All of these suffered from the underlying issue of the applicability of applying a Bayesian approach to a group. The second approach which Keeney and Raiffa (1976) described was to develop a group utility function directly. Aumann (1976) and Clemen & Winkler (1999) and O’Hagan (2006) worked to understand approaches to obtain group
probabilities for each event so that the expected utility could be derived from there.
All of these approaches have issues. Mongin (1995) concluded that the only consistent aggregation would be through a dictator who would aggregate according to
4
one individual (likely the dictator) of the group thus making the group’s aggregations those of the individual. Arrow (1951) began this process of seeing the limits of
aggregations approaches with his impossibility theorem which showed that fairness to each individual would be lost as their preferences are brought together with any kind of ranking function. This approach of aggregating individual decision has stymied many in their attempts to bring it to coherence and match experimental results.
Keeney & Nau (2011) describe a two-stage process to overcome these issues. First, the group members develop a common understanding of the decision problem and then each evaluates the alternates from their individual perspective. Second, the group collectively evaluates the alternatives using the individual evaluations as inputs. They start with the axioms of expected utility applied to acts whose outcomes depend on previous events (the individual perspective) and add a State-Independence axiom which separates subjective probabilities for events from the utility of the outcomes. The probabilities are independent of the state space of outcomes. With these axioms,
Keeney & Nau (2011) declare: “If the group preferences also satisfy an independence condition stating that only the marginal distributions of the members’ utilities are
relevant and that any one member has sovereignty over group choices that affect only herself, then it follows that the group effectively has state-dependent expected utility preferences over the original set of acts, which are represented by a weighted sum of the state-independent expected-utility functions of the individual members. The values of the weights depend on both the members’ relative strengths of preference among the alternatives and the relative importance of the members in the group. If the group
5
members are in agreement on these parameters, then appropriate values for the weights can, in principle, be determined by separate consideration of these issues.”
Keeney (2013) steps away from much of the problems of extending individual decisions to group decisions by removing the implicit assumption that each of the group members hold the same frame for their decision problem as the other decision-makers. This means that each decision-maker is concerned with the same consequences and each considers all of the events to matter. To broaden the applicability of the approach Keeney (2013) assigns different probabilities to specific events for each decision-maker and different utilities to specific consequences for each decision-maker. Finally, each decision-maker can have a different view on the impact of the consequences. This construction makes the previous Keeney & Nau (2011) formulation a special case. With the decision frame broadened, Keeney (2013) outlines both a procedure and a
formulation for how the decision will be made. The procedure has the individuals create their own view of the decision including their individual weighting of outcomes which allows for zero weighting if the outcome is of no consequence to the individual. The individual values are then brought together in a weighting function that must be
determined through some process such as equal weighting or percentage ownership, or seniority, or some other formulation. Keeney solves the original issue of Arrow’s
Impossibility Theorem and develops his analysis from a broad set of axioms, but he leaves behind the work to create a rigorous approach to balancing the weighting of each individual’s impact to the overall group decision.
The multitude of previous attempts from Raiffa (1968), Hylland & Zeckhauser (1981), Seidenfeld et al. (1989), and Mongin (1995) to describe a generalized approach
6
to a group decision have all resulted in an impossibility theorem. This makes Keeney (2013) an important step forward. Nevertheless, the issue of ability to implement remains. This solution is that the group expected utility for an alternative is the weighted sum of the individual member’s expected utilities for that alternative. The approach solves problems such as maintaining the integrity of the individual decision analysis and is explicit in how the answers of the individuals should be combined into a group answer; however, a significant issue remains. How is the group to decide what the appropriate weighting is across the individuals? This is discussed in section 4. Additionally, what happens if the group is not acting fully cooperatively with the aim of maximizing the group utility? Perhaps they may harbor some intent to maximize their own utility at the expense of the group, even if not explicitly. One possible solution is to expand the analysis frame further and not “decide” but rather “discover” how the
decision-makers are interacting.
1.3. Game Theory for Non-cooperative Groups
In their seminal work, John von Neumann and Oskar Morgenstern (1944)
described the first fully coherent approach to game theory. Their aim was to understand the mechanism of games and to make the connection back to economics as a way to explore other theoretical mechanisms for observed outcomes. They were looking to establish not an analogy between games and economic behavior but a true and direct relationship. They declared “that the typical problems of economic behavior become strictly identical with the mathematical notions of suitable games of strategy.” von Neumann and Morgenstern (1944 p.4). With this declaration, a new field of study was born, but not just for economic understanding. Game theory would grow to impact
7
many fields of study including decision analysis, but first, more development was needed. In the first chapter, von Neumann and Morgenstern (1944) describe game theory’s purpose as a tool to understand stable institutional arrangements or “standards of behavior” for any given situation or game. The theory tries to predict what stable institutional form will emerge from any given game. The theory does not posit an a priori arrangement, but rather expects one to emerge out of the game play itself. It is the preferences and tastes of the players working within the rules of the game that produces the form. In this way, game theory, as described by von Neumann and Morgenstern (1944), departs from classical economic theory which describes the form first and then describes the outcomes.
H.W. Kuhn (1950, 1953) described extensive form games which allow the designer of the game mechanism to specify how the game would play out and in what order the participants would play. This understanding persists today with extensive form games becoming an entire class of study within game theory. At the same time new insights were also developing. The extensive form includes an element of time in contrast to the strategic form of a game which describes the actions and strategies of the players but not the play-by-play of the game itself. A third description, providing even less information, is the characteristic form of a game which describes the set of payoffs to players no matter what the remaining players of the game do.
Additionally, games can be described as cooperative or non-cooperative. In four papers between 1950 and 1953 John Nash made formative contributions to both non-cooperative game theory and to bargaining theory. In two papers, “Equilibrium Points in N- Person Games” (1950) and “Non-Cooperative Games” (1951), Nash proved the
8
existence of a strategic equilibrium for non-cooperative games, now called the Nash equilibrium. Nash also described "Nash program", which defines an approach to understanding cooperative games by breaking them down to their non-cooperative component parts. In another tract of thought, Nash outlined his bargaining theory. With both of these papers, he created an axiomatic bargaining theory. With it, he proved both the existence of the Nash bargaining solution and he executed the first application of the Nash program.
Cooperative games were further advanced with the work of Aumann (1961, 1964) who showed how cooperative games could be played such that an improvement of the Nash Equilibrium was possible through trading of information about strategies by the players. In the 1970’s, work also advanced on the ability of groups to make
decisions impacting themselves. This research first appeared when Groves (1973) explored what happens to teams when the individuals within the team have different interests and utility curves. With divergent interests the team’s action can degenerate into an (N+1)-person game where a manager must be called in to take the input of the team and convert that input into a more complete frame, so that the manager can find the best equilibrium point for the group. Effectively, the team is not deciding the outcome. Groves and Loeb (1975) solve this problem by creating a mechanism by which a central actor or agent draws out the information from the team and presents it back to them in a feedback loop that allows the team to determine the dominant strategy that reveals the best equilibrium point.
Even with this advance the prevailing attitude toward game theory as a tool to help with group decision-making (as a cooperative approach) revealed skepticism that
9
broader applications were possible. Rasmussen (1989) typified this skepticism of applying cooperative gave theory in this articulation “Cooperative game theory may be useful for ethical decisions but its attractive features are inappropriate for most
economic situations, and the spirit of axiomatic approach is very different from the utility maximization of current economic theory.” While decision analysis was moving from utility theory and into predictive analysis of decisions mainly studied and researched by those in operations research, game theory largely remained the purview of economists and was used in relatively narrow sets of research. The employment of von Neumann and Morgenstern’s (1944) work as a tool for decision analysis was still yet to be
realized.
1.4. Outline of the Dissertation
We describe a practical implementation of group decision theory for a multi-million-dollar technology and process change at a nearly 1000-branch bank in Chapter 2. We showed that the latest methods in group decision theory could be used in practice by embedding them in the program management processes of the bank. One of the consistent issues throughout this implementation was the tendency for the
decision-makers to protect their own organizations within the bank at the expense of the overall project, a tendency that was reduced over the course of the decision-making process.
Given the tendency of decision-makers to veer away from a fully cooperative approach, we developed the first of two conceptual portions of this work. Chapter 3 describes the “Cost of Conflict” that can arise in a group decision, using game theory to
10
represent the non-cooperative approach and comparing the outcome to the cooperative group solution.
The second conceptual portion of this work, as described in Chapter 4, we use social network theory as a lens to study the influence that decision-makers can have on each other in a group decision, through the number and strength of connections
1
Chapter 2.
The Value of Cooperative Group Decision Making
Decision-making in a large corporation often requires the engagement of many
stakeholders. This makes it difficult to establish the criteria to evaluate strategies and to determine who will approve the final decision. This multiple stakeholder decision
difficulty can be brought about by a number of dynamics. Sometimes it is driven by a desire to achieve acceptance by the stakeholders in the hopes that the change will land better with the entire organization. Sometimes it is the reliance on an organizational matrix structure that operates with the engagement of multiple stakeholders.
Sometimes the complexity of the issues means no one decision-maker is able to understand, analyze, and choose an approach. Capital One was facing just such a decision. The following is a description of that decision and the practical
implementation of the framework that Keeney (2013) describes as a method to execute against a multi-objective, multi-stakeholder decision.
The company had embarked on an effort to rollout a new Bank Teller system for its nearly 1000-branch network. In addition, a new technology called Branch Image Capture (BIC) would also rollout that would take an image of a check and read the handwritten and encoded information. This imaging capability would ensure the
digitization of all elements of the check instead of the teller hand-keying information into the teller system, as is done in most bank branches. The implications of the change were profound. Information about the customers’ transactions would be rapidly transmitted to all bank systems. Customers could view the information for their
2
operations center for overnight processing. Also, the transactions would be “perfected” while the customer was at the teller line, meaning any issues with the transaction (e.g. mutilated checks, deposit slip errors, etc.) would be fixed immediately. This prevented the need to send “adjustment” letters to the customer explaining that a change had been made to their account. These letters could be a confusing experience for the customer often prompting them to contact the bank’s call center to seek clarification.
For Capital One’s cost structure, the impact was also dramatic. Millions of
dollars would be eliminated since checks and other transaction documents would not be transported to operations centers for processing and fraudulent checks could be spotted rapidly since the information was transmitted immediately. Beyond transportation cost savings, there were additional savings for the operations group from reductions in transaction exceptions and the operator time necessary to resolve them. The implementation also had impacts for the Branch team. The increased functionality allowed tellers to improve conversations with customers and focus on their needs, leading to additional new accounts for all products and services across the Bank. For the technology group, this implementation meant a reduction in antiquated systems that were expensive to maintain and difficult to upgrade. Overall, this new technology led to cost reductions and improved associate engagement and customer satisfaction.
To get the full value of the effort, however, a very significant information
technology upgrade was required. At its heart, three main areas needed improvement: 1. The Teller System plus the adjoining Branch Image Capture (BIC) capability
3
2. A new middleware to provide the connection to the mainframe that held the customer information
3. A back office (centralized for all branches) processing platform to ensure the checks were sent to other banks and the Federal Reserve to receive the funds
The second and third efforts were largely information system upgrades that had smaller impacts on associates and could be implemented in weekend conversions. This weekend implementation provided the opportunity to undo the change should a problem occur. In stark contrast, the first effort would take months to convert each branch and troubleshoot and repair problems. This was not only paramount for
maintaining a good experience for customers but was also a regulatory requirement for the bank. A poor rollout could have meaningful negative impacts on the bank.
Often in a business context, the financially based business case drives the decision-maker by constraining the types of attributes that can be used to make a decision, and then forcing them to be monetized so that a discounted cash flow model (often Net-Present Value) can be employed. This is an approach mandated by most corporate finance departments in an attempt to drive a common view of large programs, especially those with significant infrastructure costs. Although a valuable tool for
deciding if a project would positively impact a business, this methodology does not cover two major concerns for a successful infrastructure implementation.
Risks: Unless they are monetized, a discounted cash-flow model does not
4
these risks within the core decision framework. Instead, the decision-maker is forced to glom on some sort of risk factor to the discounted cash flow model.
Change Management: Since the implementation of a teller system is essentially
a process of putting new tools into the hands of tellers so that they can serve
customers, understanding how those tellers will adapt to the change and implement the new tools is key to making a good decision as to how to do the rollout of a large
infrastructure project. Here again a discounted cash flow model is blind to this consideration unless the impacts are monetized.
The change would affect multiple stakeholders across the organization. The goal was to apply some of the leading ideas in decision analysis and then implement them in a practical setting. Additionally, we wished to apply stakeholder theory (Freeman 1984) from the strategic management literature to include all affected parties across the organization in the decision-making process. We elicited objectives following the findings of Bond et al. (2008, 2010) and developed multi-attribute utility functions for each stakeholder group. To understand utility dependence, we used utility trees to develop a utility function for some stakeholders (Abbas 2011). Finally, we used the group decision-making approach in Keeney (2013) to develop a group utility function increasing traceability and buy-in from the stakeholders. This also allowed the extension of previous applications of objective value-gap analysis (Merrick et al. 2005, Feng and Keller 2006) to stakeholder value-gap analysis and the development of new, superior alternatives. A multi-objective, multi-stakeholder approach to decision-making pushes the underlying theory towards greater complexity but is reflective of the complexity found in typical large corporate decisions.
5
Interestingly, Freeman (1980), the originator of Stakeholder Theory, implemented a form of multi-objective, multi-stakeholder decision analysis. In this application,
Freeman has taken the first step to drive toward a truly inclusive approach to finalizing a decision, but this formulation has each stakeholder creating their own view of the multi-objective decision and then seeking a negotiated final group decision. This would ultimately run into Arrow’s Paradox.
2.1. Developing the Group Value Hierarchy
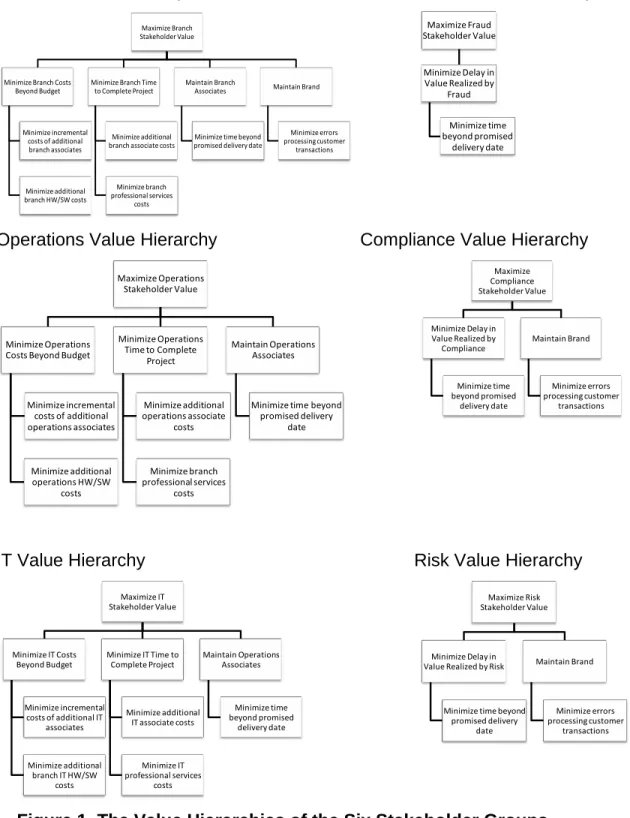
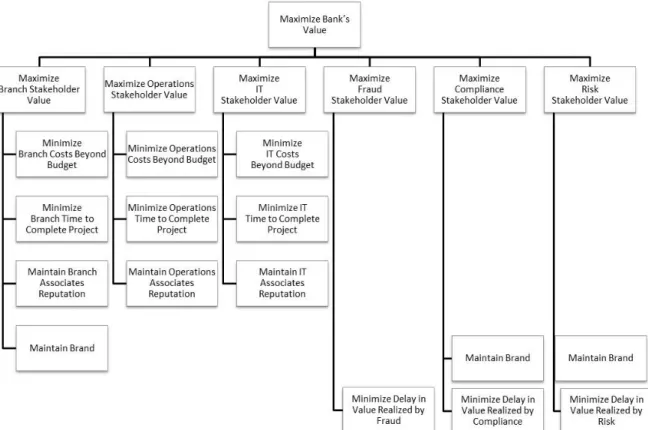
We created the Group Value Hierarchy assigning each of the six executive stakeholder hierarchies to a different branch of the hierarchy. By creating a clear view of the hierarchy of objectives, the decision-makers were better able to understand the characteristics of the objectives and how they related to their underlying concerns. Following Keeney (1992), we constructed the objectives hierarchy by holding facilitated discussions during weekly meetings of the executives. Figure 2 shows the first two levels of that group hierarchy while Figure 1 shows the individual stakeholder hierarchy’s that underlie the group hierarchy.
Although these sessions included regular updates of progress as the component elements of the technology systems were under development and testing, a goodly portion of the time was devoted to group discussion. In these sessions, objectives were brainstormed and then scrutinized by examining problems and potential shortcomings under each objective.
6
Branch Value Hierarchy Fraud Value Hierarchy
Operations Value Hierarchy Compliance Value Hierarchy
IT Value Hierarchy Risk Value Hierarchy
Figure 1. The Value Hierarchies of the Six Stakeholder Groups.
In the discussion, boundaries would be explored that would broaden or shrink the objective such that all were in agreement with its description. The team would then
Maximize Branch Stakeholder Value
Minimize Branch Costs Beyond Budget Minimize incremental costs of additional branch associates Minimize additional branch HW/SW costs
Minimize Branch Time to Complete Project
Minimize additional branch associate costs
Minimize branch professional services
costs
Maintain Branch Associates
Minimize time beyond promised delivery date
Maintain Brand Minimize errors processing customer transactions Maximize Fraud Stakeholder Value Minimize Delay in Value Realized by Fraud Minimize time beyond promised delivery date Maximize Operations Stakeholder Value Minimize Operations Costs Beyond Budget
Minimize incremental costs of additional operations associates Minimize additional operations HW/SW costs Minimize Operations Time to Complete Project Minimize additional operations associate costs Minimize branch professional services costs Maintain Operations Associates
Minimize time beyond promised delivery date Maximize Compliance Stakeholder Value Minimize Delay in Value Realized by Compliance Minimize time beyond promised delivery date Maintain Brand Minimize errors processing customer transactions Maximize IT Stakeholder Value Minimize IT Costs Beyond Budget Minimize incremental costs of additional IT associates Minimize additional branch IT HW/SW costs Minimize IT Time to Complete Project Minimize additional IT associate costs Minimize IT professional services costs Maintain Operations Associates Minimize time beyond promised delivery date Maximize Risk Stakeholder Value Minimize Delay in Value Realized by Risk
Minimize time beyond promised delivery date Maintain Brand Minimize errors processing customer transactions
7
discuss the consequences of failure and success for each objective. Although this did not move to a discussion where the specifics of the value were ascribed, it did help all executives see the meaning of each objective to each executive. They came closer to a shared understanding of what each objective meant in a qualitative sense.
Figure 2. Top Two Levels of the Group Value Hierarchy.
2.2. Defining the utility function
The literature has several implementations using the notion of an additive value function as an appropriate model for the impact that the various objectives would have on the overall outcome. As a landmark, Kirkwood’s (1997) interpretation of Dyer and
8
Sarin (1979) approach assumes mutual preferential independence amongst the attributes. This approach was used by Merrick et al. (2005), Feng and Keller (2006), Ewing et al. (2006) and is fairly standard across the literature. The additive value function can be written as
𝑣(𝑥1, 𝑥2, … , 𝑥𝑛) = ∑𝑛𝑖=1𝑤𝑖𝑣𝑖(𝑥𝑖), 𝑤ℎ𝑒𝑟𝑒 ∑𝑛𝑖=1𝑤𝑖 = 1 (1)
and where 𝑣(𝑥1, 𝑥2, … , 𝑥𝑛) is the overall value for the alternative, xi, and wi is the weight assigned to the i-th objective by the decision-makers, and 𝑣𝑖(𝑥𝑖) is the single attribute value function for that i-th objective.
Since this decision on the approach for program rollout would be made by
multiple executive stakeholders, we used the group utility function from Keeney (2013). This approach sets up the possibility to elicit the utility curve for each stakeholder
against the objectives that matter to them individually. Weights are then applied to each executive stakeholder’s individual utility function to form the group utility, specifically
𝑈𝐺(𝐴𝑘) = ∑ 𝑤𝑚𝑈𝑚(𝐴𝑘) = ∑ 𝑤𝑚(∑𝑚𝑛 𝑝𝑚(𝐸𝑚𝑗)𝑢𝑚(𝑐𝑘𝑚𝑗1 , 𝑐𝑘𝑚𝑗2 , … , 𝑐𝑘𝑚𝑗𝑛𝑚 )) 𝑒=1 𝑛 𝑚=1 𝑛 𝑚=1 (2)
where 𝑈𝑚(𝐴𝑘) is the expected utility of member 𝑚 for alternate 𝐴𝑘; 𝑝𝑚(𝐸𝑚𝑗) is the subjective probability of member 𝑚 for event 𝐸𝑚𝑗, and 𝑢𝑚(𝑐𝑎𝑚𝑒𝑜𝑚 ) is the utility for member
𝑚 over consequence, 𝑐𝑎𝑚𝑒𝑜𝑚 , where 𝑚 = 1, … , 𝑛, 𝑒 = 1, … , 𝑚
𝑛, 𝑎 = 1, … , 𝑘, and
9
With the guidance of the executive stakeholders, we developed the functional forms for each of the six executive stakeholders, Operations (UO), Branch (UB ), Fraud (UF ), Compliance (UC ), and Risk (UR):
𝑈𝑂(𝑎, 𝑐, 𝑡) = [𝑈𝑂(𝑎0, 𝑐∗, 𝑡∗) − 𝑈𝑂(𝑎0, 𝑐∗, 𝑡0) − 𝑈𝑂(𝑎0, 𝑐0, 𝑡∗)]𝑈𝑂(𝑐)𝑈𝑂(𝑡) + 𝑈𝑂(𝑎0, 𝑐∗, 𝑡0)𝑈𝑂(𝑐) + 𝑈𝑂(𝑎0, 𝑐0, 𝑡∗)𝑈𝑂(𝑡) + 𝑈𝑂(𝑎∗, 𝑐0, 𝑡0)𝑈𝑂(𝑎) 𝑈𝐵(𝑎, 𝑐, 𝑡, 𝑏) = [𝑈𝐵(𝑎0, 𝑐∗, 𝑡∗, 𝑏0) − 𝑈 𝐵(𝑎0, 𝑐∗, 𝑡0, 𝑏0) − 𝑈𝐵(𝑎0, 𝑐0, 𝑡∗, 𝑏0)]𝑈𝐵(𝑐)𝑈𝐵(𝑡) + 𝑈𝐵(𝑎0, 𝑐∗, 𝑡0, 𝑏0)𝑈𝐵(𝑐) + 𝑈𝐵(𝑎0, 𝑐0, 𝑡∗, 𝑏0)𝑈𝐵(𝑡) + 𝑈𝐵(𝑎∗, 𝑐0, 𝑡0, 𝑏0)𝑈𝐵(𝑎) + 𝑈𝐵(𝑎0, 𝑐0, 𝑡0, 𝑏∗)𝑈𝐵(𝑏) 𝑈𝐹(𝑣) = 𝑈𝐹(𝑣) 𝑈𝐶(𝑏, 𝑣) = 𝑈𝐶(𝑏∗, 𝑣0)𝑈𝐶(𝑏) + 𝑈𝐶(𝑏0, 𝑣∗)𝑈𝐶(𝑣) 𝑈𝑅(𝑏, 𝑣) = 𝑈𝑅(𝑏∗, 𝑣0)𝑈 𝑅(𝑏) + 𝑈𝑅(𝑏0, 𝑣∗)𝑈𝑅(𝑣)
2.3. Creating the single-dimensional utility functions
Utility functions were determined for each objective using mid-value splitting technique (Keeney and Raiffa 1976) for deterministic attributes and the certainty
equivalent technique (Clemen and Reilly 2001) for uncertain attributes. This evaluation was done by proxy with the author determining the appropriate value depending on the impact to the program and company. This is an aggregation method of sorts, whereby we are driving a collective view of the value on behalf of the executive stakeholders. This layer of abstraction deviates from Keeney (2013) in that utility curves were not determined for each objective completely by each stakeholder. Instead, we used a
10
simplifying assumption that the single utility curve was sufficient because the spread in objectives across the various stakeholders was wide, so that not every objective was of importance to every stakeholder.
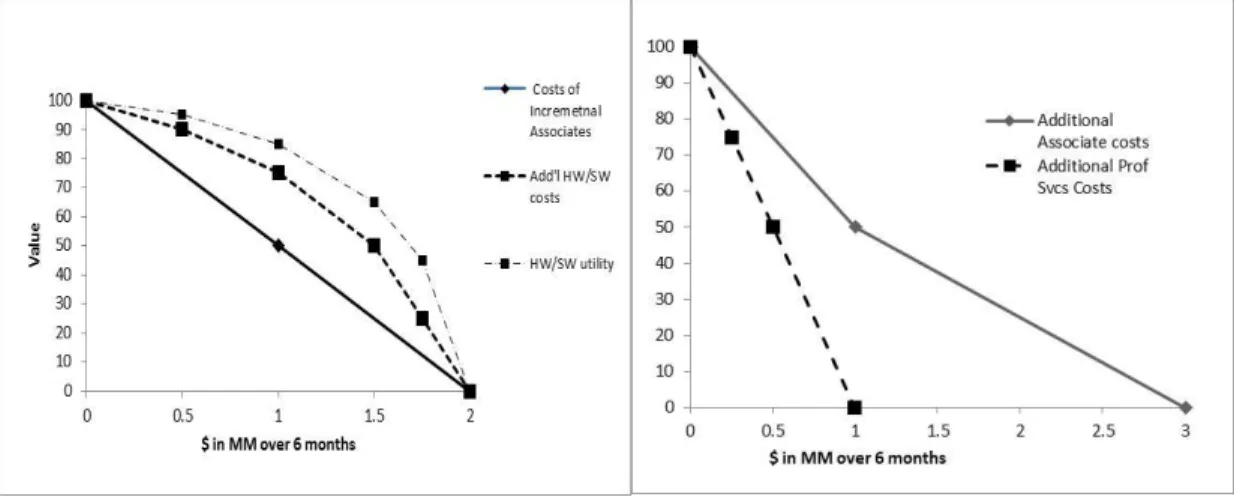
Figure 3 shows the utility functions of “Additional Costs Beyond Budget” and the more straightforward value function of “Additional Time to Complete Project.” The utility function was based on conversation with the executive stakeholders and was created as a singular representation of their individual utility functions. This simplification was used in order to save the time of eliciting each individual utility function. We justify this approach based on the close similarity of each executive stakeholder in their
appreciation for the utility of the various objectives.
Figure 3. Examples of value and utility curves.
2.4. Determination of Alternatives
With the basic structure of the objectives and utility functions in place for the rollout decision, we then developed the alternatives that would be tested against the
11
model. This was an active process that included both one-on-one discussions with executives as well as group discussion in our regular weekly meetings. The information gained from reference interviews with other banks that had executed similar efforts were included in the discussion, as well as the experience of others at Capital One that had seen these types of rollouts in other companies. The experience level was significant and outcomes observed by these experts varied significantly. This presented excellent context to examine the success and failure of previous rollouts. It not only drove the list of alternatives, but also acted as a check that the objectives we had chosen were
relevant. Although there were many possibilities to rollout a teller system to a large branch network, the conversations with executive stakeholders settled into three categories.
1. Big Bang: Over a weekend shift everyone to the new systems and processes
2. Slow Roll: Each week rollout the changes to a small percentage of branches
3. Regional Rollout: Move through each region successively
Before engaging in detailed discussion, we performed a high-level review to ensure effective communication with stakeholders. This was just a simple pros-and-cons view, but relating it back to the objectives in the model, served to create a useful document for driving discussion. This process served as a primer for the executives to begin thinking about the broader impact of each alternative. The success of the scoring effort, we are convinced, was improved by keeping the process inside a framework familiar to the executives.
12
Table 1. The Alternatives Considered.
Alternatives Approach High-level Pros High-Level Cons
Big-Bang Over weekend shift all branches and operations centers simultaneously
Fastest completion Flexibility of date
No room for error correction/learning Training time tight
Slow Roll Each week roll out a small (<5%) percentage of branches
More time to learn from mistakes Balances training load
Cannot adjust systems or repair software issues without retraining
Regional Rollout
Roll out by each of the regions and advance to the next after issues
resolved
More controlled than Big Bang Could target
troubled areas first to remove existing issues
Issues specific to regions may not show till too late
Cannot adjust systems or repair software issues without retraining
2.5. Scoring the value for each objective across alternatives
The determination of the values for the quantitative measures was relatively straightforward. Analysis had already been performed on cost savings and
13
improvements. High and low values had been determined and a “fairway” value determined as well. This allowed a straightforward inclusion in the model. The determination of the more qualitative objectives in the model again relied on a proxy approach. We determined the “fairway” value of these qualitative elements based on the feedback and conversation with the executive stakeholders. The final step was to add in the uncertainty inherent in some objectives to represent the full measure of variability. Defining uncertainty was straightforward as the program had many experienced managers and subject matter experts that had worked on programs of similar complexity. We determined the distributions based on the conversations with these experts and then added those into the model using Monte Carlo simulation. 2.6. Conducting utility gap assessment
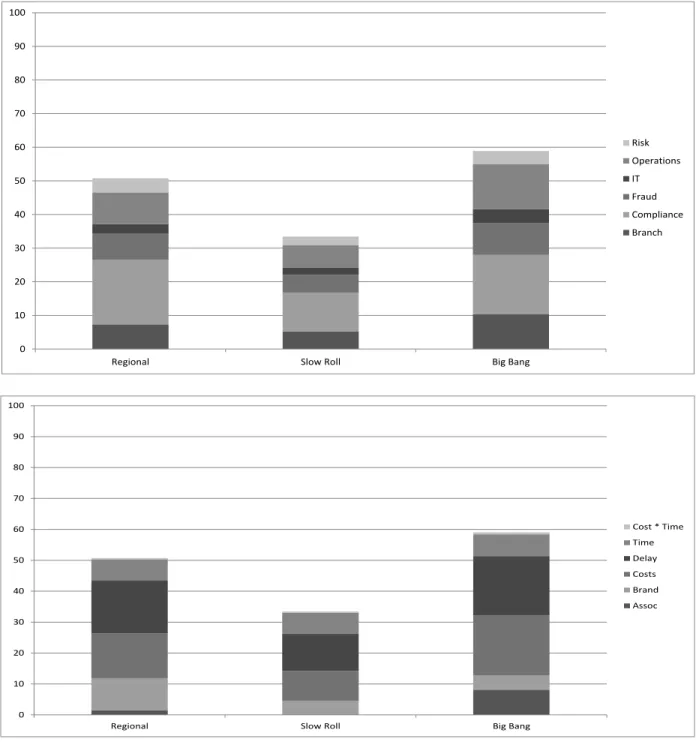
Figure 4 shows the group utility for the three alternatives for program rollout, showing that the Big Bang alternative achieved the highest utility value. The stacked bar chart view in Figure 4 shows the additive components of the group utility function,
allowing the decomposition of the group utility values by component objectives and by stakeholder groups.
14
Figure 4. The utility of each alternative decomposed by stakeholder (upper) and objective (lower).
Following Merrick (2005) we conducted a utility gap assessment. This is a process of assessing the possible maximum utility for an objective versus the actual utility for the objective under a given alternative. This provides a comparison for the
0 10 20 30 40 50 60 70 80 90 100
Regional Slow Roll Big Bang
Risk Operations IT Fraud Compliance Branch 0 10 20 30 40 50 60 70 80 90 100
Regional Slow Roll Big Bang
Cost * Time Time Delay Costs Brand Assoc
15
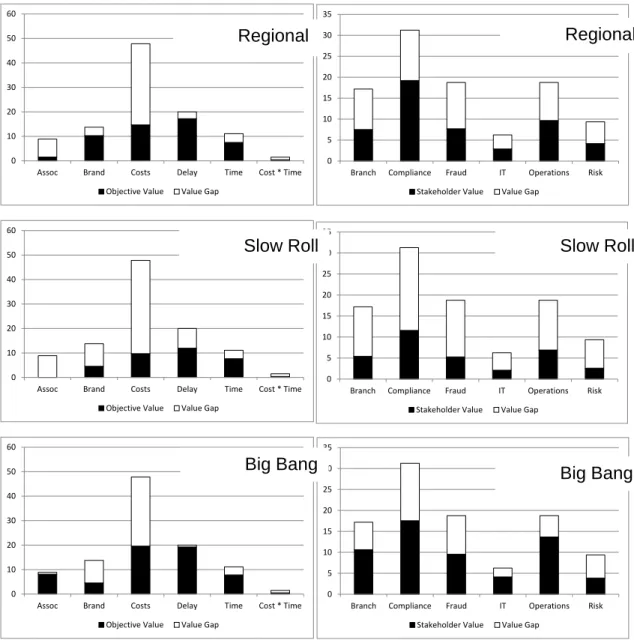
various alternatives, as well as indicating where each alternative fell short. A breakdown of the three alternatives into the five primary component objectives showed the specifics as to where the value was most lacking and where it was closer to realizing the full possible value. This was a typical gap analysis performed in Merrick (2005) and Feng and Keller (2006). However, the form of the group utility function also allowed us to perform utility gap analysis for each stakeholder’s contribution to the group utility function. Figure 5 shows the three alternatives decomposed by objective and decomposed by stakeholder.
In this breakdown, it was clear the Big Bang was the superior alternative in all objectives except for “Brand.” The riskier nature of a rollout occurring all at once with so much new functionality increased the effects of errors which would negatively impact the brand. This highlighted for the executive stakeholders the importance of “Brand” as one of the measures and led to the search of a fourth alternative that might combine the best of the first three alternatives and increase the overall score.
Through this analysis the stakeholders recognized that the initial set of alternatives was not sufficient. This was an important insight that came from this process of looking at rollout alternatives. Seeing that the three alternatives did not handle the concerns of all the executive stakeholders well enough, the search for a fourth better alternative was more clearly needed.
16
Figure 5. Utility gaps for each alternative by objective and each stakeholder.
With much of the uncertainty coming from the speed of the rollout it became clear that a slower, more careful rollout at the beginning was warranted, but a problem
remained: translating a complex analytical model into a useful conversation with time-constrained executive stakeholders. The key to driving a useful conversation was a review of previous similar programs at Capital One and their outcomes across the five main objectives for this program. A lesson’s learned style review is common, so this
0 10 20 30 40 50 60
Assoc Brand Costs Delay Time Cost * Time Objective Value Value Gap
0 10 20 30 40 50 60
Assoc Brand Costs Delay Time Cost * Time Objective Value Value Gap
0 10 20 30 40 50 60
Assoc Brand Costs Delay Time Cost * Time Objective Value Value Gap
0 5 10 15 20 25 30 35
Branch Compliance Fraud IT Operations Risk Stakeholder Value Value Gap
0 5 10 15 20 25 30 35
Branch Compliance Fraud IT Operations Risk Stakeholder Value Value Gap
0 5 10 15 20 25 30 35
Branch Compliance Fraud IT Operations Risk Stakeholder Value Value Gap
Regional Regional
Slow Roll Slow Roll
17
presented a comfortable approach to understanding how to proceed, but delivered in a different framework, namely the five main objectives and a means-to-ends style of analysis. Although the model itself was not explicitly shared with the executives, it did prove to be an insightful tool as it drove the analysis team’s facilitation. In this manner, the discussion was richer with more grounded analysis and led to comfort in the final decision, the Pilot then Rollout approach.
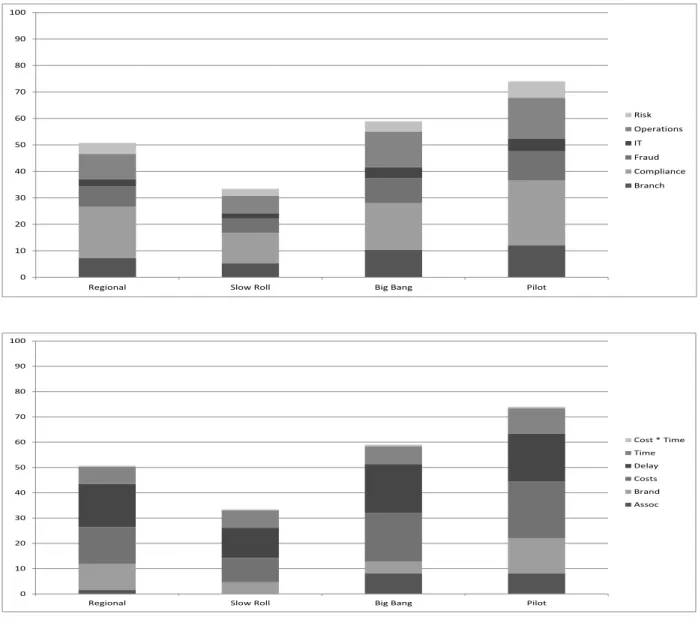
The Pilot and Rollout alternative provided the best closing of the value gap. In particular, the value to “Compliance” increased tremendously as the risk of failures in the processing of customer transactions was better managed through the normal “test-and-learn” approach of a pilot. In the previous three alternatives, there were tradeoffs made between high scores in “Associate” and “Brand,” but with this fourth alternative both of those objectives have high scores. This makes the overall utility for Pilot and Rollout the highest of the four alternatives (see Figure 6).
2.7. The Implementation
Although the implementation approach was determined, the implementation itself was a complex process that required significant oversight. There were several
concerns. First, not all branches were the same. There were regional differences that needed to be accounted for in determining the pace of branch conversion to the new systems and processes. We also implemented a process where a teller who had been through the rollout would go to a future branch to be with them during their rollout. This provided useful expertise at each branch but required a significant scheduling and oversight effort to minimize travel distances.
18
Figure 6. Utility comparison: three original alternatives and the new pilot and roll alternative.
Second, there were elements of technology and procedural changes for each rollout as the branch closed the old systems and converted to the new systems. These two parallel processes were managed by two command centers, one focused on
technology and the other on the branch associates. Each of these command centers worked with their respective teams to ensure that issues were handled and appropriate schedules executed. There were dozens of steps that needed to be completed in each
0 10 20 30 40 50 60 70 80 90 100
Regional Slow Roll Big Bang Pilot
Risk Operations IT Fraud Compliance Branch 0 10 20 30 40 50 60 70 80 90 100
Regional Slow Roll Big Bang Pilot
Cost * Time Time Delay Costs Brand Assoc
19
branch, some of which required a rollback to the old system if done improperly meaning the branch would have to be rescheduled for conversion. A third, central command center was used to coordinate across the two command centers and then into the myriad of other support teams that are part of a large banking operation. All three command centers had to work in close concert in order for the work to go smoothly and for quick issue resolution. The Pilot and Rollout approach allowed these teams to learn during the pilot phases and then hone their techniques as the rollout proceeded over six months.
The third concern was that all this work needed to stay invisible to the customer. As the branch opened on the following day there could be no issues in servicing
customers. As the team had learned through customer feedback sessions, their
expectation was that the branch would simply work and be there to handle their needs. The Pilot and Rollout approach allowed the command center teams to learn where the points of concern would be and how to handle them should anything go wrong. The impact was dramatic. Customers loved the changes and would frequently comment to the tellers that the upgrades were greatly appreciated.
2.8. Outcomes
The value of the Pilot and Roll approach was evident soon after launch of the very first branch. The initial pilot implementation was difficult. The defect rate for some of the new software was unexpectedly high and the gut-wrenchingly difficult call was made to delay by a month. Had the approach been to move forward with a quicker rollout as had been done successfully with other programs, the results would have been
20
disastrous. In fact, in reference calls with three other banks they reported delays of six months, eight months, and for one bank a horrific delay of sixteen months. To be so forthcoming with this information was an indication of the frustration those banks had in getting to the start of their implementation. It also showed how complexity of
implementation could readily turn into significant delays.
Even with this delay, the single branch pilot allowed further surprises to be better managed. As issues appeared, mitigation plans could be put in place for this single pilot that could not have been managed with a multi-branch roll out; the manual nature of the workarounds would have been too cumbersome and difficult to control. With only one branch, it was also easier to experiment with different techniques. Sometimes this resulted in a change to the software; sometimes this resulted in a change in procedure; sometimes changes, that seemed so necessary when the software requirements were elicited, were found to be unnecessary and the process and software was simplified for the future rollout. The impact of this approach was significant. From the reference calls, it was clear that other banks had struggled in implementing this very same
software. Had Capital One experienced even the more moderate six-month delay, the cost overrun would have been in excess of $9M just to maintain the program. Even more time would have been spent to repair any damage done by the issues that caused the concern in the first place. A delay of sixteen-months would have been nearly $24M and surely would have had other costs associated with issues that a poor rollout would have caused. Instead, this decision process, and the new Pilot and Rollout alternative it revealed, avoided these costly delays as predicted in the model.
21
Over the next year the software development was completed in two phases and rolled out into the lone branch. This iterative process allowed for more insights and more adjustments to be used for the ultimate rollout across the entire Capital One branch network. When the rollout to other branches began, there was still trepidation amongst the executives and the program team. Now that multiple tellers would be using the system, multiple defects and issues were likely to surface. To be sure, problems did arise but they proved easier to fix and control than in previous
conversions. Clearly, the reduction in risk was substantial as predicted by the strong scores of the pilot then rollout alternative for the Risk and Compliance stakeholders.
These risks can broadly be placed in three categories: Regulatory risks, Operational risks, and Reputation risks. Regulatory risks are straightforward to
understand but have a low tolerance for error; as a result, Capital One was particularly keen to manage these risks tightly. With a pilot approach it was possible to closely monitor the transactions moving through the system in real time. This was critical to ensuring that all regulatory requirements were met. If there was an issue, this level of monitoring allowed for quick reaction to fix the problem. As a result, there were no regulatory issues with the pilot and rollout approach. This level of monitoring would not have been possible and it was through the decision approach taken that this came to light. Similarly, Operational risks were also easily monitored. The team implemented a balanced score card that grew out of the decision model based on the notion that anything worth measuring to make a decision was likely worth measuring through the rollout. This proved to be true as operational issues popped up and were again easily handled as the team monitored transactions as they began at the teller line all the way
22
through to transmittal outside Capital One and posting to the general ledger. This level of scrutiny would not have been possible in the other approaches.
Reputation risk turned out to be a surprise. Given that the purpose of the
processes and systems implemented was largely transactional, the expectation as that there would be no reputational upside and only risk to be managed. This was not true. Because of the highly scrutinized manner in which the pilot was conducted, customers found the changes to be highly positive. This was shown in the regular survey of
customer satisfaction with their experience in the Branches. The survey participants are selected via a random sample and queried within days of their visit to the branch. In the immediate months after the rollout to a branch scores improves from 1 to 4 percentage points depending on the specific branch. This is a large improvement especially given that many of these branches had maintained very strong scores for years. Achieving a bump up in rating to that significance was a positive surprise. In the comments,
customers said that they saw the extra care that Capital One was putting into the rollout and felt good about that experience. This had not been the result in previous rollouts. The team learned from this impact and pulled together a higher-touch rollout approach across all of the branches which centered on placing tellers, experienced in the new system, into branches that were going through the rollout.
2.9. Stakeholder Reactions
For the Executive Stakeholders, the results of this approach were astounding. Given the complex nature of the implementation and the amount of change introduced into the bank, there were expectations that significant problems would arise. Several
23
expected there to be delays in the rollout schedule. In fact, plans were made to handle as much as a six-month delay given experience with other programs of similar
magnitude. That delay did not happen. Preparations were made to handle fallout that might come from significant issues in processing transactions. That did not happen. Perhaps most surprisingly, executive stakeholders from across the bank were expecting there to be morale issues with associates as fatigue kicked in and issues with
customers might arise. Certainly, the delivery team began to tire under the weight of the work, but engagement scores, a measure of associate happiness at work, actually rose during this period. These scores are measured by survey on a quarterly basis. During the time that the rollout was underway the scores moved up 3 percentage points. This was quite unexpected but because of its significance the approach the team took became a beacon for how such programs should be managed.
For some groups like Compliance and Risk Management, this approach provided a complete reversal of their usual role. Instead of being in the position of having to say “no” to requests, they became an integral part of the decision process. Their needs were imbedded in the decision model. In the very next effort at in the bank, those executives started the process asking for the same level of input. In just a few short months, the positive results are already being repeated in another important effort for the bank.
2.10.Program Conclusion
The program became a beacon for well-disciplined and nuanced risk
24
that the program was a model for how large change efforts should be managed. The impact to the business was immediate and substantial. Costs were reduced at each branch transitioned to the new system and processes. Branch managers lauded the rollout process and how well-managed and controlled it was. Amazingly customer satisfaction ticked up a couple of percentage points, an unprecedented increase for such a large change.
Interestingly, the case for a Pilot and Rollout approach to large program implementation remained unobvious as other programs took different tacks. This indicates that the Pilot and Rollout approach was not a universally appropriate technique that the team simply struggled to discover. Instead, it was clear that each program is different and a separate decision process was warranted for each. An analysis that captured both the quantitative elements and the softer ones was pivotal to the success of the effort. It was also evident that the explicit inclusion of stakeholders in the structured decision-making process was necessary and the conversations required to construct a multi-objective, multi-stakeholder utility model meant a better examination of the potential consequences and improved alignment of the stakeholders. Although Capital One has created successful implementations of complex initiatives, these techniques provided an improvement to the processes already in place.
2.11.Contributions from this Practical Approach
During the early stages of the project, the executives were unwilling to discuss the importance of each objective to their business area in front of the group due to concerns that others would use this information against them. The decision-making
25
process we followed involved the executives in deeper discussions about objectives than previous projects at the company and the sharing of data and information to help build the probability distributions on each attribute. This process improved trust amongst the executives and led them to share the weights they would place on each objective.
The executives quickly realized that the business areas placed very different emphasis on the objectives and would be affected very differently by the alternative implementations of this new technology. In most implementations of multi-attribute utility theory, weights on the objectives are elicited from each stakeholder and the average for each objective across the stakeholders is used in the final utility function. In the
approach described in this chapter, we constructed a utility function for executive’s business area and then weighted the business areas to form the company’s group utility function. This allowed the executives to see how their peers would be impacted by each alternative as well as the overall impact on the company.
The resulting utility gap analysis was eye-opening and led the executives to develop a new alternative that would not have such negative impacts on one or more business areas. This implementation reveals two critical observations that are often over-looked in discussions about decision theory. First, the process of constructing a decision analysis model can have significant positive benefits in building trust and understanding amongst the stakeholders. Second, the value of decision analysis is more than just selecting an alternative; the executives developed a better alternative that would not have been considered without this analysis and it led to a significant return on investment.
1
Chapter 3.
The Cost of Non-Cooperative Group Decision Making
When a group or committee must make a decision, the members of the group may not agree on the merits of each proposed alternative. They may measure success differently or they may have different beliefs about the probability of possible outcomes (Gilboa, Samet, & Schmeidler, 2004; Mongin, 1995, 1998; Seidenfeld, Kadane, & Schervish, 1989). Disagreements about probabilities are often caused by asymmetries in the information each group member has available (Clemen & Winkler, 1987; Winkler, 1981), and can be reduced by sharing or aggregating this information (Brodbeck,
Kerschreiter, Mojzisch, & Schulz-Hardt, 2007). Different measures of success can be caused by individuals assigning different utilities to given levels of a single consequence measure (Dyer & Sarin, 1979), different consequence measures (Keeney, 2013), or different weighting of multiple objectives (Baucells & Sarin, 2003). A frequent
assumption of work in group decision-making is that the group is selecting a single alternative from a common set of alternatives. This is usually the case in a cooperative group decision. However, strategic decision-making can be more complex as it is a process comprised of many individual decisions (Fredrickson & Mitchell, 1984; Papadakis, Lioukas, & Chambers, 1998) with the hope that the overall strategy is aligned (Iaquinto & Fredrickson, 1997).
In a review of the strategic decision-making literature, Eisenhardt and Zbaracki (1992) conclude “that organizations are accurately portrayed as political systems in
2
which strategic decision-makers have partially conflicting objectives.” It seems clear that the individual decision-maker plays an important role in the strategy process
(Hutzschenreuter & Kleindienst, 2006). Furthermore, several studies show that organizational outcomes are improved by dissent and structured conflict (De Dreu & West, 2001; Dooley & Fryxell, 1999; Dooley, Fryxell, & Judge, 2000; Priem, Harrison, & Muir, 1995) and including decision-makers with diverse experience (Horwitz & Horwitz, 2007) and roles in the organization (Simons, Pelled, & Smith, 1999). However, political maneuverings and conflict between decision-maker groups can derail a strategic
decision process (Cooper & Zmud, 1990), often caused by an asymmetry of values and objectives across the decision-makers (Kim & Kankanhalli, 2009; Leidner & Kayworth, 2006; Levine & Rossmoore, 1993).
This section extends the multiple-objective multi-stakeholder decision framework to allow for different sets of alternatives for each decision-maker and models the
strategic interaction of these decisions using a game theoretic approach. Our framework assumes that the decision-makers have multiple, common objectives that are
aggregated through their individual multi-attribute utility function. The outcomes for each decision-maker are affected by the choices of the other decision-makers and this effect can be different for each objective and each decision-maker can assign different
weights to the objectives. The resulting utilities are a game in the sense of Von
Neumann and Morgenstern (1944) and Nash (1951). A game theory construct allows us to study the equilibrium solutions when there is an asymmetry of values and objectives. We are not the first to study games with vector payoffs (Morgan, 2005; Zeleny, 1975; Zhao, 1991), but our focus is not the existence of an equilibrium. Instead, we study the
3
impact of Cooperative and Non-Cooperative approaches to group decision-making when individual decision-makers have their own alternative sets and there is an asymmetry of values and objectives.
3.1. A Formal Framework for Group Decisions in Cooperative and Non-Cooperative Situations
Consider a set of decision-makers 𝑀, with |𝑀| ≥ 2. In the traditional group decision formulation, the set of alternatives 𝐴 is common for all decision-makers. Each decision-maker 𝑚 ∈ 𝑀 can have their own set of mutually exclusive and collectively exhaustive events that represent potential outcomes, denoted by 𝐸𝑚{𝐸𝑚,1, … , 𝐸𝑚,𝑂𝑚}, and their own consequence measure, denoted by 𝑐𝑚(𝑎) ∈ ℝ for 𝑎 ∈ 𝐴. Given the usual rationality assumptions (Pratt, 1964), decision-maker 𝑚 has a probability distribution over 𝐸𝑚 with measure 𝑝𝑚, and a utility function 𝑢𝑚: 𝑐𝑚(𝑎) → ℝ in the sense of (Von Neumann & Morgenstern, 1944).
Given a similar set of rationality assumptions at the group level, the group expected utility for alternative 𝑎 ∈ 𝐴 can be written as
𝑈𝐺(𝐴𝑘) = ∑𝑛𝑚=1𝑘𝑚𝑈𝑚(𝐴𝑘) = ∑𝑛𝑚=1𝑘𝑚(∑𝑚𝑒=1𝑛 𝑝𝑚(𝐸𝑚𝑒)𝑢𝑚(𝑐𝑚𝑒𝑜 (𝑎))) (3)
where 𝑐𝑚𝑒𝑜 (𝑎) is decision-maker 𝑚’s consequence under event 𝐸𝑚𝑒 if they choose alternative 𝑎 and 𝑘𝑚 is the weight of decision-maker 𝑚’s expected utility in the group expected utility, such that ∑𝑚∈𝑀𝑘𝑚 = 1 (Keeney, 2013). Prior work assumed that the decision-makers shared a common set of events, so 𝐸 = 𝐸𝑚 for all 𝑚 ∈ 𝑀, and assumed that the group had a probability distribution formed by aggregating the