University of Massachusetts Amherst
ScholarWorks@UMass Amherst
Travel and Tourism Research Association:Advancing Tourism Research Globally 2011 ttra International Conference
The Financing Activities of Canadian Small and
Medium-sized Enterprises in Tourism Industries
Andrea K. Pierce
Small Business and Tourism Branch, Industry Canada
Follow this and additional works at:https://scholarworks.umass.edu/ttra
This is brought to you for free and open access by ScholarWorks@UMass Amherst. It has been accepted for inclusion in Travel and Tourism Research Association: Advancing Tourism Research Globally by an authorized administrator of ScholarWorks@UMass Amherst. For more information, please contactscholarworks@library.umass.edu.
Pierce, Andrea K., "The Financing Activities of Canadian Small and Medium-sized Enterprises in Tourism Industries" (2016).Travel and Tourism Research Association: Advancing Tourism Research Globally. 71.
The Financing Activities of Canadian Small and Medium-sized Enterprises in Tourism Industries
Andrea K. Pierce
Small Business and Tourism Branch Industry Canada
ABSTRACT
Though there has been substantial research on small and medium sized enterprises in tourism, information on access to financing for these businesses is limited. Given the importance of financing to the success and growth of a business, this report investigates the financing activities of small and medium-sized enterprises (SMEs) in tourism industries and assesses whether this group of SMEs faces unique financing obstacles. Using data from Statistics Canada’s, Survey on Financing of Small and Medium Enterprises, this report finds that Canadian SMEs in tourism industries, although less likely to request external financing, were significantly less likely to be approved for external financing compared to SMEs in non-tourism industries. SMEs in the accommodation industry, which required the most capital, had the most difficulty, receiving on average, less than half of the debt financing they requested in 2007.
Keywords:tourism, small and medium-sized establishments, access to financing
INTRODUCTION
Small businesses (fewer than 100 employees) are of critical importance to tourism in Canada, accounting for 99 percent of businesses in the industry. According to consultations with tourism business owners in Ontario, one of the most significant impediments to improving, modernizing and/or expanding operations for businesses in tourism industries -particularly for small and medium-sized enterprises (SMEs)- is the availability of financing (Sorbara, 2009).
Given the importance of financing to the success and growth of a business, this report was produced to investigate the financing activities of SMEs in tourism industries and identify, if any, the unique financing needs of this group. Using data from Statistics Canada’s Survey on Financing of Small and Medium Enterprises, this report provides an overview of business characteristics and recent financing activity of Canadian SMEs in tourism industries in comparison with Canadian SMEs in non-tourism industries.
LITERATURE
Though there has been substantial research on SMEs in tourism, information on the actual financing needs and obstacles of this group are limited. Access to financing is one of the biggest obstacles to growth for SMEs in Canada. Obtaining financing can be particularly difficult for SMEs in tourism because they are often viewed by financial institutions as relatively risky compared to SMEs in other industries.
The tourism industry operates in a challenging environment. Tourism businesses are extremely vulnerable to outside events, such as changes in the weather/seasons, political and economic issues, health-related concerns, changing demographics, etc. Moreover, many tourism businesses have short operating seasons in which to generate the majority of their annual
revenues, further limiting their ability to recover from any external shocks (Council of Tourism Association, 2006).
Additionally, tourism owners often lack of entrepreneurial drive. Given that tourism businesses are primarily located in attractive regions, a number of entrepreneurs are driven to industry because it would allow them to enjoy the destination while generating adequate income to sustain their lifestyle. These entrepreneurs, known as “lifestyle entrepreneurs”, state non-economic motives as reasons for establishing the business, such as “living in an attractive area” or “being my own boss” (Shaw and Williams, 2004; Morrison et al. 2001). They typically are not growth oriented and lack the skills, training and expertise needed to be successful. In fact, in Canada, tourism businesses account for 13.4 percent of all bankruptcies (Canadian Tourism Commission, 2009a).
METHODOLOGY
To better understand the financing activities of SMEs operating in the tourism industry, this report uses the comprehensive database of the SME Financing Data Initiative Survey on Financing of Small and Medium Enterprises. First released in 2000 by Statistics Canada, this survey measures the demand for, and sources of, financing for Canadian SMEs. The database includes information on the financing application process, firm profiles and demographic characteristics of SME ownership. The representative samples consist of approximately 13,000 respondents in 2004 and 16,000 respondents in 2007.
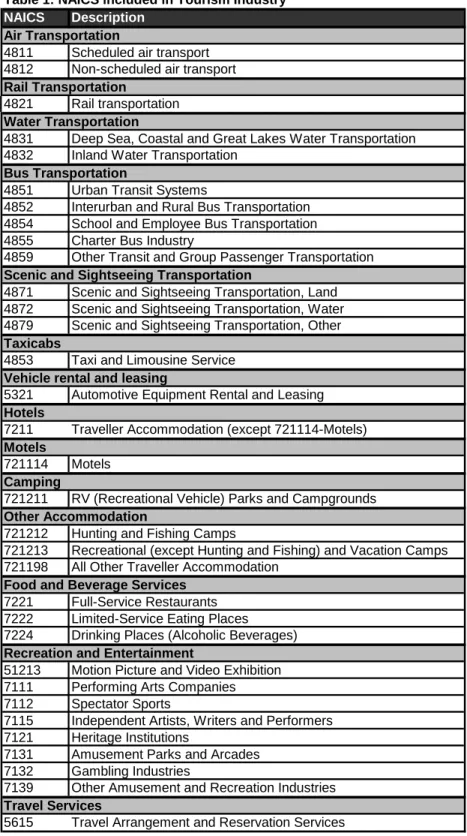
For the purpose of this report, an SME is defined as a business with fewer than 500 employees and less than $50 million in annual revenues. Excluded from this target population are non-profit and government organizations, schools, hospitals, subsidiaries, co-operatives and, financing and leasing companies. A tourism SME is defined as a business which meets the above SME criteria and operates in one of the tourism industries (accommodation, transportation, food and beverage services, travel services or recreation and entertainment). Appendix A provides the complete list of the NAICS codes included in the tourism grouping for the 2004 and 2007 databases.
RESULTS Size and location of SMEs in tourism industries
The majority (99 percent) of businesses in tourism industries in Canada were small businesses (fewer than 100 employees) (See Table 1). In 2007, SMEs in tourism industries were less likely to be micro-businesses (fewer than 5 employees) than SMEs in non-tourism industries (62 percent versus 81 percent). On the other hand, enterprises in tourism industries were more likely to employ 5 or more workers (38 percent versus 18 percent for non-tourism industries).
The distribution of SMEs in tourism industries is fairly proportional to the overall distribution of SMEs across Canada (see Table 1). SMEs in tourism industries were more likely than SMEs in non-tourism industries to be located in Quebec (25 percent versus 21 percent). On
the other hand, SMEs in tourism industries were less likely than those in non-tourism industries to be located in the Prairies (14 percent versus 21 percent).
Table 1
Distribution of SMEs by Size and Region, 2007* Tourism
SMEs
Non-Tourism SMEs Business Size (number of employees)
0 39% 53%
1 — 4 23% 28%
5 — 19 24% 14%
20 — 99 13% 4%
100 — 499 1.1% 0.4%
Region (share of all SMEs in region in parentheses)**
Atlantic 7% (9%) 6% (91%) Quebec 25% (9%) 21% (91%) Ontario 39% (8%) 38% (92%) Prairies 14% (6%) 21% (94%) British Columbia 15% (8%) 14% (92%) Canada 100% (8%) 100% (92%)
Source: SME Financing Data Initiative, Statistics Canada, Survey on Financing of Small and Medium Enterprises, 2007
* Bold values denote statistically significant difference at 5 percent.
** For example, 7% of all tourism SMEs in Canada were located in Atlantic Canada and these tourism SMEs accounted for 9% of all SMEs in Atlantic Canada.
Note: Distributions for the Territories are not available due to low frequency of response. General business characteristics
Table 2 presents a comparison of business characteristic between SMEs in tourism industries and SMEs in non-tourism industries. In 2007, SMEs in tourism industries were typically younger (had been in operation for less time) than their non-tourism counterpart (see Table 2). Interestingly, tourism business owners were more likely than non-tourism business owners to identify their business sales as experiencing either fast growth or slow growth but were less likely to identify their business sales as experiencing no growth (maturity) or decreasing growth (decline) (see Table 2).
Contrary to what has been found in the lifestyle entrepreneurship literature, SME in tourism industries were more likely than SME in non-tourism industries to be growth oriented. In 2007, 45 percent of SMEs in tourism industries had intentions to expand the size or scope of their business in the next three years, while only 40 percent of SMEs in non-tourism industries reported the same intentions. Despite being more growth-oriented, SMEs in tourism industries were less likely to have sufficient financing to fund these expansion plans compared with SMEs in non-tourism industries (see Table 2).
In 2007, SMEs in tourism industries were also more likely to invest in research and development and thereby be innovative compared with their non-tourism counterparts. In particular, 4.6 percent of businesses in tourism industries were considered innovative (spending more than 20 percent of investment expenditure on R&D) compared with only 3.3 percent of businesses in non-tourism industries.
Table 2 Business Characteristics, 2007* Business Characteristic Tourism SMEs Non-Tourism SMEs Year Firm Started Selling Goods
Between 2002 and 2004 (1 to 2 yrs old) 11% 8% Between 1999 and 2001 (3 to 5 years old) 21% 19%
Prior to 1999 (6 or more years old) 68% 73% Stage of Development (as identified by the owner)
Start-up 5% 4%
Fast growth 16% 9%
Slow Growth 48% 38%
Maturity 27% 37%
Decline 5% 11%
R&D expenditure (as a percentage of total expenditure)
0% 78% 77%
10% 15% 17%
11-20% 3% 2%
Over 20% 4.6% 3.3%
Growth Intentions
Intend to expand business within next 2 years 45% 40% Current financing sufficient to fund expansion plans 46% 59%
Method of Acquiring the Business
Bought/Acquired from family member 5% 10%
Bought/Acquired from non-family member 30% 13%
Started from Scratch 63% 77%
Other 2% 1%
* Bold values denote statistically significant difference at 5 percent
Source: SME Financing Data Initiative, Statistics Canada, Survey on Financing of Small and Medium Enterprises, 2007
Business owner characteristics
An individual’s characteristics and background are important determinants of entrepreneurial activity. Previous literature has shown that the tourism industry is a major employer of women (Canadian Tourism Human Research Council, 2009; Industry Canada, 2010). Table 3 shows that in 2007, businesses in tourism industries were significantly more likely to be majority feowned or equally-owned and significantly less likely to be male-owned compared with non-tourism owners.
A recent report by the Canadian Tourism Human Resource Council (2009) found that compared to those working in the Canadian labour force as a whole, tourism workers were slightly more likely to have a mother tongue other than English or French. As shown in Table 3, compared with non-tourism business owners, the mother tongue of an owner in the tourism industry was less likely to be English and more likely to be French or a language other than English or French in 2007. This coincides with a greater concentration of recent immigrant owners and visible minority owners in tourism industries than in non-tourism industries (see Table 3).
SME owners in tourism industries also had less managerial experience than their non-tourism counterpart. As shown in Table 3, 67 percent of non-tourism owners had more than 10 years of managerial experience, while 72 percent of non-tourism owners were in the same position.
Table 3 Owner Characteristics, 2007* Owner Characteristics Tourism SMEs Non-Tourism SMEs Gender
Majority Male Ownership 51% 65%
Majority Female Ownership 26% 16%
Equal Ownership 23% 19%
Background
Visible Minority (other than Aboriginal) 18% 9%
Aboriginal 3% 2%
Disabled 2% 2%
Recent Immigrant (within last 5 yrs) 4% 3%
Held by family members 64% 65%
Mother Tongue English 54% 68% French 24% 18% Other 22% 14% Managerial Experience Over 10 years 67% 72%
* Bold and italic values denote statistically significant difference at 5 percent
Source: SME Financing Data Initiative, Statistics Canada, Survey on Financing of Small and Medium Enterprises, 2007
Obstacles to growth
Achieving growth targets for an SME in the tourism industry can be difficult because they operate in a challenging environment. Current issues facing the tourism industry include, seasonality of industry demand, new competition from emerging economies, exchange rates, increased fuel costs, labour shortage, concerns over global security, and health and safety issues (Canadian Tourism Commission, 2009b; Tourism Industry Association of Canada, 2010).
Among SME owners surveyed in 2004, the most frequently identified obstacle for both tourism and non-tourism business was the “level of taxation” (see Table 4). In 2007, the most frequently cited challenge reported by SMEs owners was “rising business costs” followed by “finding qualified labour”. Interestingly, in comparison with SMEs in non-tourism industries, SMEs in tourism industries were significantly more likely to report “obtaining financing” as an obstacle to business growth in both 2004 and 2007 (see Table 4).
Table 4
Perceived Obstacles to Business Growth*
Obstacles Tourism
Non-Tourism Tourism
Non-Tourism
Finding Qualified Labour 32% 37% 39% 42%
Instability of Consumer Demand 42% 36% 30% 33%
Government Regulations 35% 34% 31% 27% Environmental Regulations/Compliance 11% 12% Level of Taxation 50% 47% Increasing Competition 37% 40% Obtaining Financing 25% 20% 25% 16% Management Capacity 12% 14% 12% 11%
Rising Business Costs 59% 56%
Low profitability 47% 38%
Insurance Rates/Premiums 42% 36% 36% 34%
2004 2007
External to the Firm
Internal to the Firm
*Bold values denote statistically significant difference at 5 percent.
Financing activity
An important factor to the growth and survival of a business is obtaining external
financing. As a result, the following section examines the financing activity of firms operating in tourism industries in comparison with firms operating in non-tourism industries to determine any distinctive financing challenges.
Table 5 shows that SMEs in tourism industries were less likely to request external financing in both 2004 and 2007. Debt financing was the most common type of external financing sought by both types of businesses. In 2007, compared with SMEs in non-tourism industries, SMEs in tourism industries were slightly less likely to seek debt financing (10 percent versus 13 percent), lease financing (8 percent versus 9 percent, and trade credit (8 versus 9 percent).
SMEs in tourism industries were not only less likely to seek financing, they were also less likely to be approved for external financing (Table 5)1. Specifically, in 2004, 87 percent of SMEs in tourism industries were approved for external financing compared with 91 percent of SMEs in non-tourism industries. In 2007, 93 percent of SMEs in tourism industries were
approved for external financing compared with 96 percent of SMEs in non-tourism industries. In particular, SMEs in tourism industries were less likely to be approved for debt financing and significantly less likely to be approved for government loans or grants in 2007.
Table 5
Financing Request and Approval Rates*
Tourism Non-Tourism Tourism Non-Tourism
Request Rate 23% 24% 15% 18% Approval Rate 87% 91% 93% 96% Request Rate 19% 19% 10% 13% Approval Rate 81% 88% 91% 94% Request Rate 2% 3% 4% 5% Approval Rate 97% 96% 93% 93% Request Rate 0.5% 1% 1% 1% Approval Rate 70% 44% 72% 70% Request Rate 9% 12% 8% 9% Approval Rate 95% 89% 100% 99% Request Rate 2% 3% 3% 3% Approval Rate — — 69% 81% Equity Financing Government Loan or Grant 2007 2004 Type of Financing Trade Credit Any External Financing Debt Financing Lease Financing
*Bold values denote statistically significant difference at 5 percent
Note: Request and approval Rates are Industry Canada calculations using the whole sample. Approval rates exclude observations in which loans were withdrawn or are still under review.
Source: SME Financing Data Initiative, Statistics Canada, Survey on Financing of Small and Medium Enterprises, 2004 and 2007
Given the diversity of the industries within tourism, Table 6 demonstrates the request and approval rates by industry within tourism. Of all the tourism industries, the accommodation industry had the highest external financing request rate (21%) followed by the recreation and entertainment industry (18 percent).
1
It should be noted that approval rates presented in Table 5 do not distinguish between partial and full approvals. In other words, a request for financing was considered “approved” as long as “some” amount (not necessarily the full amount) was approved. Moreover, approval rates do not consider size scale. Each request for financing has the same weight in the calculations. That is, a request for $500 would carry equal weight to a request for $50,000.
The most common type of external financing sought by all industries was debt financing, with the exception of travel services which had equal request rates for debt financing and
government loan or grant (see Table 6). The accommodation industry had the highest debt financing request rate (13 percent).
As shown in Table 6, the approval rates for external financing in the recreation and entertainment industry (100 percent) and the accommodation industry (94 percent) were higher than the tourism average (93 percent) in 2007. On the other hand, approval rates in the food and beverage (90 percent) and transportation industries (78 percent) were lower than the tourism average.
Table 6
Financing Request and Approval Rates by Industry, 2007*
Request Rate 21% 13% 18% 10% 16% Approval Rate 94% 90% 100% 78% — Request Rate 13% 10% 9% 9% 9% Approval Rate 95% 86% 100% 83% — Request Rate 6% 4% 5% 2% 7% Approval Rate 91% 91% 100% — — Request Rate 3.9% 2% 0% 0% 1% Approval Rate — 69% — — — Request Rate 9% 9% 6% 4% 7% Approval Rate 100% 99% 100% 100% — Request Rate 4% 2% 6% 0.1% 9% Approval Rate 85% 73% 74% — — Lease Financing Equity Financing Trade Credit Government Loan or Grant Transportation Travel Services Any External Financing Debt Financing
Type of Financing Accommod-ation
Food and Beverage
Recreation and Entertainment
Source: SME Financing Data Initiative, Statistics Canada, Survey on Financing of Small and Medium Enterprises, 2004 and 2007
Debt financing
To investigate the magnitude of the debt requests, Table 7 presents the average approved debt amounts for SMEs in tourism and non-tourism industries. As shown, regardless of the type of debt requested (short term or long term), the average approved loan was smaller for SMEs in tourism industries than for SMEs in non-tourism industries.
Based on the size of loan approved, it is not possible to determine if SMEs in tourism industries were more likely than SMEs in non-tourism industries to be fully or partially denied debt financing or if SMEs in tourism simply requested smaller amounts of debt financing. To find this answer, the ratio of total amount of financing approved-to-requested is considered. As shown in Table 7, this ratio was slightly lower for SMEs in tourism industries than for SMEs in non-tourism industries in 2004. In 2007, this ratio decreased dramatically for SMEs in tourism industries, indicating that on average, SMEs in tourism industries received only 67 percent of the amount of debt financing they requested. This was significantly lower than the 93 percent of approved debt financing for SMEs in non-tourism industries.
Table 7
Approved Debt Financing Amounts
Type of Debt Financing Tourism Non-Tourism Tourism Non-Tourism Average Long-Term Approved $185,000 $195,000 $254,000 $273,000 Average Short-Term Approved $48,000 $87,000 $126,000 $190,000 Average Total Debt Approved $97,000 $129,000 $239,000 $264,000
Approved/Requested Total Debt 86% 88% 67% 93%
2004* 2007
*2004 amounts exclude extreme outliers
Note: Figures are Industry Canada calculations using only the observations in which both request amount and approved amount are included.
Source: SME Financing Data Initiative, Statistics Canada, Survey on Financing of Small and Medium Enterprises, 2004 and 2007
In order to determine if any particular tourism industry had more difficulty accessing financing, Table 9 presents approved debt financing amount by tourism industry in 2007. As can be seen in the table, the accommodation industry had the highest average approved loan amount (both short term and long term). Despite this, the accommodation industry also had the lowest total debt approved-to-requested ratio at 42 percent. This indicates that the average SME in this industry required more debt financing but had more difficulty being approved for the full amount of debt financing they requested compared with SMEs in other tourism industries.
This finding can be partially explained by the characteristics of the accommodation industry. According to a report by the Council of Tourism Associations of British Columbia (COTA) (2006), the perception of risk that lenders have of the tourism industry is driven by the accommodation and food services industries. Specifically, the restaurant industry is extremely competitive, and faces high overhead costs and small profits. As a result these businesses are vulnerable to shocks and changes in consumer preferences. Businesses in the hospitality industry often require significant capital investment in furniture, fixtures and equipment. In many cases these assets are specialized or built in to the building, making them hard to realize in the event of liquidation (COTA, 2006) and causing lenders to be cautious when providing capital.
Table 9
Approved Debt Financing Amounts by Tourism Industry, 2007
Average Long-Term Approved $595,000 $172,000 $137,000 $502,000
Average Short-Term Approved $211,000 $94,000 $133,000 —
Average Total Debt Approved $546,000 $157,000 $183,000 $566,000
Approved/Requested Total Debt 42% 86% 99% 99%
Type of Financing
Accommodation Food and Beverage
Recreation and Entertainment
Transportation
Note: Data for the Travel Services Industry is not available due to low frequency of response
Source: SME Financing Data Initiative, Statistics Canada, Survey on Financing of Small and Medium Enterprises, 2007
Financing terms and conditions
To obtain external financing, businesses are often asked by credit suppliers to provide certain types of documentation or security during the application process. As shown in Figure 1, owners of businesses in tourism industries faced more stringent application requirements when applying for credit than non-tourism business owners. Specifically, in 2007 SMEs in tourism
industries were significantly more likely than SMEs in non-tourism industries to be required to provide business financial statements, appraisals of assets, cash flow projections and a business plan (see Figure 1). Moreover, a higher percentage of SMEs in tourism industries were required to pledge collateral or to provide a co-signature in order to obtain requested credit.
Although not shown here, SMEs in tourism and non-tourism industries paid similar interest rates on their loans (close to 7% in 2007). Moreover, SMEs in tourism industries had slightly longer interest term on their loan (69 months) compared with non-tourism (63 months).
Figure 1
Documents and Security Required During Loan Application Process, 2007*
46% 69% 49% 9% 48% 20% 27% 31% 68% 31% 35% 40% 75% 81% 59% 17% 0% 20% 40% 60% 80% 100% Co-s ignatures Collateral Business Plan Cash Flow Projections Appraisals of As sets Personal Financial Statem ents Formal Application for Financing Business Financial Statem ents
S e c u ri ty D o c u m ent at io n Non-Tourism Tourism
*Bold values denote statistically significant difference at 5 percent
Source: SME Financing Data Initiative, Statistics Canada, Survey on Financing of Small and Medium Enterprises, 2007
Financial performance
Table 10 presents a summary of financial statement figures for the average tourism SME in comparison with the average non-tourism SME. These financial performance figures indicate that in 2004 and 2007 the average SMEs in tourism industries generated less revenue, less profit and has less retained earnings than their non-tourism counterpart. These findings suggest that owners of businesses in tourism industries could have more financial management difficulties, which may partially explain why businesses in tourism industries have more difficulty accessing financing.
Table 10
Selected Financial Statement Figures (average)*
Tourism SMEs
Non-Tourism
SMEs Tourism SMEs Non-Tourism SMEs
Total Revenue $685,000 $951,000 $775,000 $1,167,000
Total Expenses $676,000 $908,000 $745,000 $1,086,000
Net Income/Loss before tax $10,000 $43,000 $30,000 $81,000
Current Assets $101,000 $327,000 $138,000 $476,000 Fixed Assets** $368,000 $302,000 $496,000 $469,000 Total Assets $469,000 $629,000 $634,000 $946,000 Current Liabilities $161,000 $224,000 $177,000 $294,000 Total Liabilities $396,000 $423,000 $496,000 $591,000 Retained Earnings $39,000 $144,000 $73,000 $211,000
Total Shareholder Equity $73,000 $206,000 $138,000 $354,000
2004 2007
*Bold values denote statistically significant difference at 5 percent.
**Fixed assets include total tangible assets, intangible assets, long term investments and other long term assets.
Source: SME Financing Data Initiative, Statistics Canada, Survey on Financing of Small and Medium Enterprises, 2004 and 2007
CONCLUSION
In conclusion, the results presented in this report suggest that SMEs in tourism industries are relatively growth-oriented and innovative; however, their growth may be limited by
constraints on their ability to access financing. In both survey years, fewer SMEs in tourism industries requested external financing and fewer were approved for external financing compared with SMEs in non-tourism industries. The accommodation industry, which required the most capital, had the most difficulty, receiving on average, less than half of the debt financing they requested in 2007.
Financial performance measures indicate that owners of businesses in tourism industries have more financial management difficulties, which may partially explain why businesses in tourism industries have more difficulty accessing financing.
Given the lack of research on the financing activities of businesses in tourism industries, further investigation may help researchers gain a better understanding of the actual financing needs and concerns of this very important group of SMEs.
REFERENCES
Canadian Tourism Commission (2009a). Canadian Tourism Industry Benchmark Study. Retrieved July 29, 2010, from Canadian Tourism Commission website:
http://en-corporate.canada.travel/sites/Corporate/images/pdf/Research/Industry-research/Economic-political-impacts/CanadianTourismIndustryBenchmarking_EN.pdf
Canadian Tourism Commission (2009b). Driving tourism business through difficult times: 2009 Annual Report. Retrieved September 10, 2010, from the Canadian Tourism
Commission website:
http://en-corporate.canada.travel/Corporate/Flyout.page?id=321&fid=338
Canadian Tourism Human Resource Council (2009). Who’s Working For You: A Demographic Profile of Tourism Sector Employees Retrieved October 13, 2010, from the
Canadian Tourism Human Resource Council website:
http://cthrc.ca/en/research_publications/labour_market_information/total_tourism_sector _employment.aspx
Council of Tourism Associations British Columbia (2006). Financing Tourism Operations in BC. Retrieved December 13, 2010 from the COTA website:
http://www.cotabc.com/publications/cota_publication_details.aspx?id=21
Industry Canada (2010). Small Business Financing Profile: Women Entrepreneurs. Retrieved
November 8, 2010, from the SME Financing Data Initiative website: www.sme-fdi.gc.ca
Morrison, A., Baum, T. & Andrew, R (2001). The Lifestyle Economic of Small Tourism Businesses. Journal of Travel and Tourism Research, vol 1. pp 16-25.
Sorbara, G. (2009). Discovering Ontario: Report on the Future of Tourism. Retrieved December 16, 2010 from the Ministry of Tourism and Culture website:
http://www.mtc.gov.on.ca/en/publications/Discover_Ontario_en.pdf
Shaw, G. and A. Williams, (2004). “From Lifestyle Consumption to Lifestyle Production: Changing Patterns of Tourism Entrepreneurship” in R. Thomas (Ed), Small Firms in Tourism: International Perspectives, Oxford, Elsevier, pp 99-114.
SME Financing Data Initiative (2007). Survey of Financing of Small and Medium Enterprises. Ottawa, Statistics Canada.
SME Financing Data Initiative (2004). Survey of Financing of Small and Medium Enterprises. Ottawa, Statistics Canada
Statistics Canada (2007a), Canadian Tourism Satellite Account Handbook, Catalogue no.13-604-MIE, No. 052
Tourism Industry Association of Canada (2010). 6 Issues Facing the Tourism Industry Today. Retrieved on September 10, 2010 from the Tourism Industry Association of Canada
APPENDIX A
Table 1: NAICS included in Tourism Industry
NAICS Description
4811 Scheduled air transport 4812 Non-scheduled air transport 4821 Rail transportation
4831 Deep Sea, Coastal and Great Lakes Water Transportation 4832 Inland Water Transportation
4851 Urban Transit Systems
4852 Interurban and Rural Bus Transportation 4854 School and Employee Bus Transportation 4855 Charter Bus Industry
4859 Other Transit and Group Passenger Transportation 4871 Scenic and Sightseeing Transportation, Land 4872 Scenic and Sightseeing Transportation, Water 4879 Scenic and Sightseeing Transportation, Other 4853 Taxi and Limousine Service
5321 Automotive Equipment Rental and Leasing 7211 Traveller Accommodation (except 721114-Motels) 721114 Motels
721211 RV (Recreational Vehicle) Parks and Campgrounds 721212 Hunting and Fishing Camps
721213 Recreational (except Hunting and Fishing) and Vacation Camps 721198 All Other Traveller Accommodation
7221 Full-Service Restaurants 7222 Limited-Service Eating Places 7224 Drinking Places (Alcoholic Beverages) 51213 Motion Picture and Video Exhibition 7111 Performing Arts Companies 7112 Spectator Sports
7115 Independent Artists, Writers and Performers 7121 Heritage Institutions
7131 Amusement Parks and Arcades 7132 Gambling Industries
7139 Other Amusement and Recreation Industries 5615 Travel Arrangement and Reservation Services
Air Transportation
Rail Transportation
Water Transportation
Bus Transportation
Scenic and Sightseeing Transportation
Taxicabs
Vehicle rental and leasing
Hotels
Recreation and Entertainment
Travel Services
Food and Beverage Services Motels
Camping