Reporting Statistical Validity and Model Complexity in
Computational Studies
B. K. Olorisade
School of Computing and Mathematics Keele University
United Kingdom [email protected]
O. P. Brereton
School of Computing and Mathematics Keele University
United Kingdom [email protected]
P. Andras
School of Computing and Mathematics Keele University
United Kingdom [email protected]
ABSTRACT
Background: Statistical validity and model complexity are both important concepts to enhanced understanding and correctness assessment of computational models. However, Information about these is often missing from publications applying machine learning.
Aim: The aim of this study is to show the importance of providing details that can indicate statistical validity and complexity of models in publications about the use of machine learning in the Citation Screening phase of Systematic Reviews.
Method: We build and compare 15 Support Vector Machine (SVM) models each developed using word2vec (average word) features – and data for 15 review topics from the Text REtrieval Conference (TREC) 2004 dataset.
Results: The word2vec features were found to be sufficiently linearly separable by the SVM and consequently we used the linear kernels. The models tend to use a relatively high number of support vectors. For the negative examples which are the majority class, the SVMs use over 80% of their training data as support vectors in 11 of the 15 models; while an average of approximately 45% of the positive examples are used as support vectors for the positive class.
Conclusions: Exploring the underlying number of support vectors for the SVM models revealed that in this particular context, the models are overly complex compared to ideal expectations. In general, we note that the number of support vectors is much larger than expected for SVM models of data that are likely to have good statistical validity, which requires typically not more than 2%-5% (and preferably much less) of the training vectors to be support
vectors. Therefore, it is essential for studies to produce complexity and validity information in publications to help readers have a better understanding of models being proposed and decide ways in which these may be improved.
CCS CONCEPTS
• General and reference → Cross-computing tools and techniques; Experimentation; Empirical studies • Computing methodologies→ Support Vector Machines
KEYWORDS
Model complexity, statistical validity, CS automation, systematic reviews, model selection, text mining
1 INTRODUCTION
Empirical software engineering is currently witnessing an increased number of studies reporting models from computational research based on machine learning algorithms. A particular example is the use of text mining to automate the Citation Screening (CS) phase of the Systematic Review (SR) process. Systematic review is a rigorous review approach used in software engineering [21] and other disciplines (particularly medicine and education). CS is the process of deciding which of the papers found in the search phase of a SR are relevant and hence should be included in a review and which are not.
There is an on-going campaign on the need for reporting basic information in publications based on computation to ensure that independent researchers will be able to reproduce the results of these studies. The same cannot be said about the statistical validity and complexity of such models. Information that can indicate the statistical validity and complexity of models is rarely reported in studies.
In this study, we explore the need for the explicit provision of statistical validity and complexity details of proposed models in computational studies. In general, a machine learning based model should not be assumed to be statistically valid and/or robust without assessing its complexity – even if such model is reported to have high performance according to the measures used.
2
We conduct this study in the context of the automation of CS in SRs using text mining techniques. We build multiple support vector machines (SVMs) using average word-to-vector (word2vec) features, for binary classification of citations (i.e. to automate the inclusion/exclusion of papers). According to Olorisade et al.[28], SVM based models have been proposed in 31% of the studies on the automation of CS in SRs between 2006 – 2014; making it the most used algorithm in the field. Thus, the choice of the SVM algorithm for this study. The datasets are those used for 15 reviews from the Text Retrieval and Evaluation Conference (TREC) 2004 datasets [12]. The datasets are part of the Drug Evaluation Review Program (DERP) reports made available through the collaboration between the Cochrane Centre and the Evidence based Practice Centres of the Agency for Healthcare Research and Quality (AHRQ) [12].
Various measures have been proposed in the context of model complexity, each adopting different information criterion statistics. Some of the early ones are: Akaike Information Criterion (AIC) and the Bayesian Information Criterion (BIC); recently Minimum Description Length (MDL) and Occam’s razor from information theory have become popular. In general, statistical validity requires tight constraints on a model in terms of variation of parameters, less constraint and more possible variation of parameter values implies lower validity of the model. This implies that models with higher statistical validity are more likely to be replicated with small variation in their parameters.
Computational (model) complexity in the context of machine learning can be simply viewed in terms of resources –the number of required examples, elementary components of a hypothesis etc. In general, a model aims to achieve the best possible data description performance (e.g. classification in the context of making inclusion/exclusion decisions as part of an SR), however at the same time its complexity should be kept as low as possible. Often, in the case of multi-component models, it is difficult to establish confidence intervals for the model predictions due to the complicated and non-trivial joint effects of the multiple components. However, in such cases the model complexity combined with the model’s data description performance provide a proxy for the estimation of the model’s statistical validity. In general, following the Occam’s razor principle, if two models have comparable data description performance the one that is more complex is assumed to be statistically less valid. Thus, assessing model complexity for multi-component models is critical for the estimation of the statistical validity of the model. Information regarding statistical validity and complexity is generally missing from computational studies in the context of machine learning applications for text classification in SRs.
Viewing complexity as above, what translates to complexity in each model differs. In this study, we illustrate with SVM models where complexity is characterised by the number of
support vectors involved in the SVM classifier and is controlled through its hyper-parameters – C, gamma and kernel type.
In the rest of the paper, section 2 presents a brief introduction to the Occam’s razor principle for choosing a less complex model and a review of the studies that have proposed SVM models in CS automation. The conduct of our experiment is the subject of section 3. Section 4 presents the results and discussion, while section 5 discusses some threats to validity. The conclusions are presented in section 6.
2 BACKGROUND 2.1 Model Complexity
The option of selecting the best model in machine learning is not usually a straightforward one. The rule of thumb is to select a model with the least generalization error. According to Nannen, a good model is the one with low generalization error and low tendency to overfit [26]. However, given two possible representations or models of data, Occam’s razor dictates that other things being equal, the simpler or less complex of the two should be preferred [13, 14]. Though, the understanding of this principle has generated a few controversies based on different interpretations and drawing of unsupported conclusions between simplicity and accuracy [13]. Simplicity in this context refers to the representation generated from a less complex hypothesis [6, 14], which may be easier to understand, and/or to explain.
There are a number of ways to determine the complexity of a model, such as minimum description length (MDL) [16, 17] and Kolmogorov complexity [7, 22, 31, 32]. The MDL seeks a model that yields a suitable balance between model accuracy and complexity given the sample size and data complexity [4]. Kolmogorov complexity is the length of the shortest program a finite string can be computed from [16]. Originally used in information theory, it is lately becoming more popular in computational studies. In essence, applied to computational models it implies the preference for the simplest hypothesis that represents or approximates the data. In the case of models with multiple components, the often adopted measure of complexity is the measure of structural complexity, which is given by the number of components of the model. This approach is valid in particular, when each component of the model can be expected to have the same level of complexity as any other component of the model.
2.2 Citation Screening
The CS (or study selection) process is a key activity in SR where the relevant documents are separated from the irrelevant ones. This phase is one of the most time consuming activity of the SR process. It is therefore not surprising that it has attracted the most attention in terms of automating an individual phase of the SR process [24]. Most of the research on automating CS has centered on text
mining techniques. These are explored in the context of developing models based on machine learning algorithms to ease the task of selecting the relevant studies from the results of the study search [28].
2.3 SVM Based Citation Screening Studies
In the field of automation of CS, the SVM approach has been widely used since it was proposed by Aphinyanaphongs and Alferis [1]. Cohen et al. have since published a number of studies based on different TREC and other datasets, which show that the SVMs record acceptable performances, usually a recall performance of 95% and over [8–10, 12]; and are used also to track newly published articles relevant to the same study [11]. Wallace et al. have also published a series of articles using different datasets, some of which show the ability of the SVM to separate well non-relevant articles from relevant ones [30, 33, 34]. They have since proposed a CS system – ABSTRACKR – using SVM and an active learning algorithm [33]. Other studies that have published SVM based classifiers within the CS context are [5, 15, 19, 20, 35]. A comprehensive review of these studies and more is presented in [27].
SVM has been widely used in text mining studies about screening citations automatically during SR but the studies are devoid of information about the complexity of the proposed models or about whether they are statistically better than other possible models. Though, all of the studies selected their best models through cross validation. Cross validation is another way to eliminate random performance and establish a reliable predictive performance of a model. In cross validation, the whole input is divided into equal sized subsets, the model will be trained on all but one subset and tested using the one left out [23]. This process is continued until each part has been used for testing. The results of the different runs are then averaged to get the mean performance of the model. We note that cross-validation by itself does not take into account the complexity of the model.
3 METHODS
We ran experiments to show the importance of providing details that characterise the complexity and statistical validity of computational models. We developed SVM models with word2vec (using average word vectors) representations, using the 15 reviews from [12].
The vector space model represents (embeds) words in a continuous vector space where words closer together are adjudged to share semantic meaning more than those farther away [3]. Word2vec is a predictive model for learning word embedding from raw text by first creating a vocabulary from the training text data and then learning the vector representation of words incorporating an understanding of when and how often words are used together in the
representation [25]. The average word2vec incorporates the average of each word over the given corpus.
We retrieved our version of the data directly from the TREC 2004 raw data from http://skynet.ohsu.edu/trec-gen/data/2004/ after unsuccessful attempts to get a copy of those used by earlier researchers. For unknown reasons we could not retrieve exact counts for each of the reviews as reported in [12]. The studies and the number of documents retrieved for each is presented in Table 1.
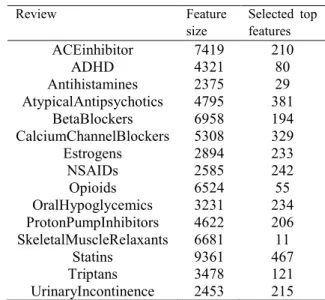
To generate the word2vec representation, we tokenized the corpus and removed stopwords with the Stanford’s nltk package. We then trained a word to vectors model with the aid of the Word2Vec method in the genism package. This model is used to transform the corpus to ‘average word feature’. There was no stemming in the feature preparations. We reduce the dimensionality of the resulting sparse vectors using the Chi2 method in the sklearn’s model selection routine to select top features that were found to be significant at 0.05 alpha level as reported in [12]. The number of total features and of the top features retained is shown in Table 2. We split each review corpus into training and testing datasets in the ratio 70:30 respectively using the train_test_split method with seed value of 37 (the seed values were chosen randomly to ensure reproduction. None of the previous studies reported their seed values). This ratio was changed to 80:20 in order to increase the training set in corpus where the data size was deemed small – usually below 1000. Table 4 shows the values used for the individual review training and testing sets.
Information necessary for the reproducibility of this experiment is provided below; software environment information is shown in Table 3.
Initial dataset shuffle seed: {29}
Train-test split seed: {37, 71, 21, 61, 55} SVM parameters:
o Gamma: auto
o C: {1, 10, 100, 1000, 10000} o Kernel: { Linear}
o Model random state: {37, 71, 21, 61, 55} o Sample weight: {1:4}
o Class weight: balanced Word2Vec model
o Features: as in Table 2. o minimum word count: 10 o context window: 15
We trained a battery of 15 SVM models with different parameter settings (as above). The model(s) with the best recall was then selected and re-run five times with different partitioning of the dataset. The dataset is split the same way as before but with different seed values on each run. The recall, precision, accuracy and number of support vectors were accumulated and averaged.
4
Table 1: Number of retrieved documents per review
Review Retrieved corpus
size
Negative
samples Positive samples
ACEinhibitor 2498 2459 39 ADHD 835 819 26 Antihistamines 308 278 30 AtypicalAntipsychotics 1115 748 367 BetaBlockers 2043 1897 146 CalciumChannelBlockers 1190 987 203 Estrogens 362 283 79 NSAIDs 389 298 91 Opioids 1883 1867 16 OralHypoglycemics 493 359 134 ProtonPumpInhibitors 1314 1260 54 SkeletalMuscleRelaxants 1610 1601 9 Statins 3402 3234 168 Triptans 657 622 35 UrinaryIncontinence 322 262 60
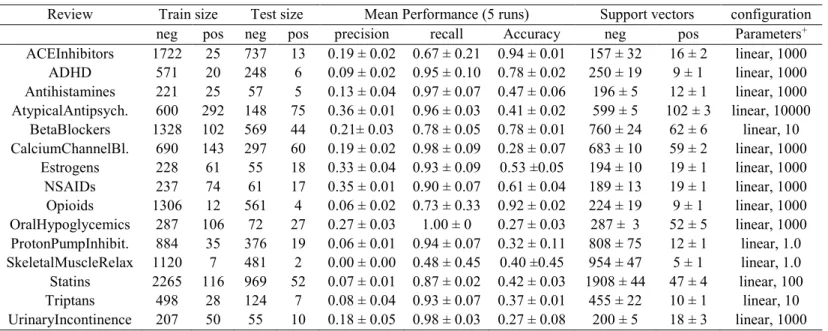
In CS for SR, full recall of all relevant studies is the primary target. Thus, we chose the models with highest recall for the positive class. The results for the models given for the 15 reviews are shown in Table 4. The training and testing data sizes presented in the tables are the average over five runs. Similarly, the performance metrics – recall, accuracy and precision, are also the mean and standard deviation values over the five runs.
Similarly, the performance metrics – recall, accuracy and precision, are also the mean and standard deviation values over the five runs. Apart from the usual recall and precision metrics we also show the mean and standard deviation of the number of support vectors that each of the models used in making its classification judgements
Table 2: Top selected features
Review Feature size Selected top features ACEinhibitor 7419 210 ADHD 4321 80 Antihistamines 2375 29 AtypicalAntipsychotics 4795 381 BetaBlockers 6958 194 CalciumChannelBlockers 5308 329 Estrogens 2894 233 NSAIDs 2585 242 Opioids 6524 55 OralHypoglycemics 3231 234 ProtonPumpInhibitors 4622 206 SkeletalMuscleRelaxants 6681 11 Statins 9361 467 Triptans 3478 121 UrinaryIncontinence 2453 215
Table 3: Software information
S/N Software Version 1 Python 2.7.12 64bit 2 IPython 5.1.0 3 scipy 0.18.1 4 numpy 1.11.2 5 sklearn 0.18.1 6 pandas 0.19.1 7 nltk 3.2.1 8 gensim 0.12.4 9 matplotlib 1.5.3
– this characterises the complexity of the SVM classifiers.
4 RESULTS AND DISCUSSION
We chose to experiment with the linear kernel because it is simpler than the non-linear kernels. We also experimented with the binary, term frequency (tf), term frequency-inverse document frequency (tfidf) and word2vec features. The word2vec features showed better performance with the linear kernel to other feature representations.
Table 4 shows that the linear kernel SVM models have relatively high recall performance but the number of support vectors is generally high, above 80% of the negative examples of the training dataset in 11 of the studies and 30% to 75% of the positive examples in all the reviews. In support vector models, the number of support vectors is indicative of the statistical validity and complexity of the models. We note that the number of support vectors reduces as the value of ‘C’ increases (i.e. this is the weight of the complexity penalty in the optimisation of the SVM) in the models.
The statistical theory of the SVM is based on the assumption that the algorithm uses as few support vectors as possible to make its decision. This is the underlying reason for the reported advantage of the SVM algorithm - it is robust to small sample sizes or situations where the number of features is more than the number of samples because it needs only a few of the samples as support vectors [2, 18, 29]. Ideally, we would expect a well optimized SVM model to use at most between 2%-5% of its total training data vectors (and preferably much less than 2% in the case of large volumes of data) as support vectors.
The fact that we find typically many more support vectors in our SVM classifiers may mean that in our case, the SVM optimisation is complicated and slow, which eventually leads to an early stop of the optimisers before achieving any significant optimisation.
Consequently, the statistical validity of these results is likely to be relatively limited, or in other words the likely error bounds are large and the likelihood of wrong classifications is also relatively high.
In the course of this study, we conducted similar experiment for the term frequency (tf), binary and the term
frequency-Table 4: Results of the average word to vector feature based SVM model
Review Train size Test size Mean Performance (5 runs) Support vectors configuration neg pos neg pos precision recall Accuracy neg pos Parameters+
ACEInhibitors 1722 25 737 13 0.19 ± 0.02 0.67 ± 0.21 0.94 ± 0.01 157 ± 32 16 ± 2 linear, 1000 ADHD 571 20 248 6 0.09 ± 0.02 0.95 ± 0.10 0.78 ± 0.02 250 ± 19 9 ± 1 linear, 1000 Antihistamines 221 25 57 5 0.13 ± 0.04 0.97 ± 0.07 0.47 ± 0.06 196 ± 5 12 ± 1 linear, 1000 AtypicalAntipsych. 600 292 148 75 0.36 ± 0.01 0.96 ± 0.03 0.41 ± 0.02 599 ± 5 102 ± 3 linear, 10000 BetaBlockers 1328 102 569 44 0.21± 0.03 0.78 ± 0.05 0.78 ± 0.01 760 ± 24 62 ± 6 linear, 10 CalciumChannelBl. 690 143 297 60 0.19 ± 0.02 0.98 ± 0.09 0.28 ± 0.07 683 ± 10 59 ± 2 linear, 1000 Estrogens 228 61 55 18 0.33 ± 0.04 0.93 ± 0.09 0.53 ±0.05 194 ± 10 19 ± 1 linear, 1000 NSAIDs 237 74 61 17 0.35 ± 0.01 0.90 ± 0.07 0.61 ± 0.04 189 ± 13 19 ± 1 linear, 1000 Opioids 1306 12 561 4 0.06 ± 0.02 0.73 ± 0.33 0.92 ± 0.02 224 ± 19 9 ± 1 linear, 1000 OralHypoglycemics 287 106 72 27 0.27 ± 0.03 1.00 ± 0 0.27 ± 0.03 287 ± 3 52 ± 5 linear, 1000 ProtonPumpInhibit. 884 35 376 19 0.06 ± 0.01 0.94 ± 0.07 0.32 ± 0.11 808 ± 75 12 ± 1 linear, 1.0 SkeletalMuscleRelax 1120 7 481 2 0.00 ± 0.00 0.48 ± 0.45 0.40 ±0.45 954 ± 47 5 ± 1 linear, 1.0 Statins 2265 116 969 52 0.07 ± 0.01 0.87 ± 0.02 0.42 ± 0.03 1908 ± 44 47 ± 4 linear, 100 Triptans 498 28 124 7 0.08 ± 0.04 0.93 ± 0.07 0.37 ± 0.01 455 ± 22 10 ± 1 linear, 10 UrinaryIncontinence 207 50 55 10 0.18 ± 0.05 0.98 ± 0.03 0.27 ± 0.08 200 ± 5 18 ± 3 linear, 1000 + Parameters – kernel, C
inverse document frequency (tfidf) feature representations as well. However, we found that the average word vector based SVM classification lead to better performance results without requiring further pre-processing of the data and we chose these simpler approaches for the work presented in this paper. Also, we did not optimize the models beyond choosing a set of C values and a set of kernel options since this was sufficient to explore the issue of statistical validity and complexity of data models that we address in this paper. Ordinarily, only one parameter of the machine learning model is reported in most studies. Here we explore the potential of models considering several parameters before optimizing the result of the best. We used average word vector for feature representation modelled by the linear kernel SVMs for each review topic. Taking statistical validity into account and the principles of model selection - Occam’s razor, MDL and Kolmogorov complexity – the linear kernel models should be preferred.
In SVM, the higher the number of support vectors, the more complex the model is, the higher the possibility of misclassification error and over-fitting. According to [4], learning in models is a function of the hypothesis, representation and optimization. There is hardly any optimization done by the model, when (almost) all the dataset acts as support vectors in an SVM model. Such models are almost equivalent of a nearest neighbour classifier using all available training data. Consequently, the statistical validity of SVM models, where a large fraction of the training data constitute support vectors, is comparable to the statistical validity of nearest neighbour classifiers based on the full training data.
5 VALIDITY THREAT
We present here, only the result of the linear kernel SVM, we have not considered the result of the nonlinear kernel SVMs in this study. The performance of the SVMs reported in this study is particular to the models generated by the datasets used. It should be noted that the sample sizes used are quite small with considerably imbalanced classes. We did not make any extra attempt to improve the performance of the SVM models beyond the feature types used and tuning of the parameters. Additional tuning may have changed the outcome of the study.
6 CONCLUSIONS
In this study, we developed SVM models with linear kernels based on 15 DERP SR dataset. Apart from reporting the performance – recall, precision and accuracy – results over five runs, we also explore the number of support vectors for each model. The models show relatively acceptable recall performance which is the target in SR but the support vectors are relatively high. This may raise suspicion about the statistical validity and complexity of the models.
This work has shown that, in addition to performance results, information that reflects how well a model complies with the principles of its underlying theory and complexity should be provided in study reports. This will give the reader a better understanding of the model and more grounds for comparability and improvement. The specific complexity or statistical validity details differ from model to model, we only illustrate this with SVMs in this paper.
6
ACKNOWLEDGMENTS
B.K. Olorisade thank National Information Technology Development Agency (NITDA) for providing funds to sponsor his PhD research.
REFERENCES
[1] Aphinyanaphongs, Y., Tsamardinos, I., Statnikov, A., Hardin, D. and Aliferis, C.F. 2005. Text categorization models for high-quality article retrieval in internal medicine. Journal of the American Medical Informatics Association. 12, 2 (2005), 207– 216.
[2] Baharudin, B., Lee, L.H. and Khan, K. 2010. A Review of Machine Learning Algorithms for Text-Documents
Classification. Journal of Advances in Information Technology. 1, 1 (2010), 4–20.
[3] Baroni, M., Dinu, G. and Kruszewski, G. 2014. Don’t count, predict ! A systematic comparison of counting vs. context-predicting semantic vectors. Proceedings of the 52nd Annual Meeting of the Association for Computational Linguistics. (2014), 238–247.
[4] Barron, A., Rissanen, J. and Yu, B. 1998. Principle in Coding and Modeling. IEEE Transactions on Information Theory. 44, 6 (1998), 2743–2760.
[5] Bekhuis, T. and Demner-Fushman, D. 2010. Towards automating the initial screening phase of a systematic review. Studies in Health Technology and Informatics. 160, PART 1 (2010), 146–150. [6] Blumer, A., Ehrenfeucht, A., Haussler, D. and Warmuth, M.K.
1990. Occam’s razor. Readings in machine learning.
[7] Chaitin, G.J. 1969. On the Length of Programs for Computing Finite Binary Sequences: Statistical Considerations. Journal of the ACM. 16, 1 (Jan. 1969), 145–159.
[8] Cohen, A.M. 2006. An effective general purpose approach for automated biomedical document classification. AMIA ... Annual Symposium proceedings / AMIA Symposium. AMIA Symposium (2006), 161–165.
[9] Cohen, A.M. 2008. Optimizing feature representation for automated systematic review work prioritization. AMIA ... Annual Symposium proceedings / AMIA Symposium. AMIA Symposium (2008), 121–125.
[10] Cohen, A.M., Ambert, K. and McDonagh, M. 2009. Cross-Topic Learning for Work Prioritization in Systematic Review Creation and Update. Journal of the American Medical Informatics Association. 16, 5 (2009), 690–704.
[11] Cohen, A.M., Ambert, K. and McDonagh, M. 2012. Studying the potential impact of automated document classification on scheduling a systematic review update. BMC Medical Informatics and Decision Making. 12, 1 (2012), 33.
[12] Cohen, A.M., Hersh, W.R., Peterson, K. and Yen, P.Y. 2006. Reducing workload in systematic review preparation using automated citation classification. Journal of the American Medical Informatics Association. 13, 2 (2006), 206–219.
[13] Domingos, P. 2014. A Few Useful Things to Know about Machine Learning. Communications of the ACM. 55, 10 (2014), 78–87. [14] Domingos, P. 1999. The role of Occam’s Razor in knowledge
discovery. Data Mining and Knowledge Discovery. 3, (1999), 409–425.
[15] García Adeva, J.J., Pikatza Atxa, J.M., Ubeda Carrillo, M. and Ansuategi Zengotitabengoa, E. 2014. Automatic text classification to support systematic reviews in medicine. Expert Systems with Applications. 41, 4 PART 1 (2014), 1498–1508.
[16] Grünwald, P. 2000. Model Selection Based on Minimum Description Length. Journal of mathematical psychology. 44, 1 (2000), 133–152.
[17] Hansen, M.H. and Yu, B. 2001. Model Selection and the Principle of Minimum Description Length. Journal of the American Statistical Association. 96, 454 (2001), 746–774.
[18] Ikonomakis, M., Kotsiantis, S. and Tampakas, V. 2005. Text classification using machine learning techniques. WSEAS Transactions on Computers. 4, 8 (2005), 966–974.
[19] Kim, S. and Choi, J. 2014. An SVM-based high-quality article classifier for systematic reviews. Journal of Biomedical Informatics. 47, (2014).
[20] Kim, S. and Choi, J. 2012. Improving the performance of text categorization models used for the selection of high quality articles. Healthcare Informatics Research. 18, 1 (2012), 18–28. [21] Kitchenham, B.A., Dyba, T. and Jorgensen, M. 2004.
Evidence-Based Software Engineering. Proceedings of the 26th International Conference on Software Engineering (Washington, DC, USA, 2004), 273–281.
[22] Kolmogorov, A.N. 1965. Three approaches to the quantitative definition of information. Problems of information transmission. 1, 1 (1965), 1–7.
[23] Kotsiantis, S.B., Zaharakis, I.D. and Pintelas, P.E. 2006. Machine learning: a review of classification and combining techniques. Artificial Intelligence Review. 26, 3 (2006), 159–190.
[24] Marshall, C. and Brereton, P. 2013. Tools to Support Systematic Literature Reviews in Software Engineering: A Mapping Study. 2013 ACM / IEEE International Symposium on Empirical Software Engineering and Measurement (2013), 296–299.
[25] Mikolov, T., Chen, K., Corrado, G. and Dean, J. 2013. Distributed Representations of Words and Phrases and their Compositionality. Nips. (2013), 1–9.
[26] Nannen, V. 2010. A Short Introduction to Model Selection, Kolmogorov Complexity and Minimum Description Length (MDL). arXiv preprint arXiv:1005.2364. Mdl (2010), 1–23. [27] O Mara-Eves, A., Thomas, J., McNaught, J., Miwa, M. and
Ananiadou, S. 2015. Using text mining for study identification in systematic reviews: a systematic review of current approaches. Systematic reviews. 4, 1 (2015), 1–22.
[28] Olorisade, B.K., de Quincey, E., Brereton, P. and Andras, P. 2016. A critical analysis of studies that address the use of text mining for CS in systematic reviews. Proceedings of the 20th International Conference on Evaluation and Assessment in Software Engineering (2016), 14.
[29] Sechidis, K. Comparison of different preprocessing techniques and feature selection algorithms in cancer datasets. 1–6.
[30] Small, K., Wallace, B.C., Brodley, C.E. and Trikalinos, T. 2011. The Constrained Weight Space SVM: Learning with Ranked Features. Proceedings of the 28th International Conference on Machine Learning (ICML-11). (2011), 865–872.
[31] Solomonoff, R.J. 1964. A formal theory of inductive inference. Part I. Information and Control. 7, 1 (1964), 1–22.
[32] Solomonoff, R.J. 1964. A formal theory of inductive inference. Part II. Information and Control. 7, 2 (1964), 224–254.
[33] Wallace, B.C., Small, K., Brodley, C.E., Lau, J. and Trikalinos, T.A. 2012. Deploying an interactive machine learning system in an evidence-based practice center. Proceedings of the 2nd ACM SIGHIT symposium on International health informatics - IHI ’12 (2012), 819.
[34] Wallace, B.C., Small, K., Brodley, C.E., Lau, J. and Trikalinos, T.A. 2010. Modeling Annotation Time to Reduce Workload in Comparative Effectiveness Reviews Categories and Subject Descriptors Active Learning to Mitigate Workload. Proceedings of the 1st ACM International Health InformaticsSymposium. ACM, (2010), 28–35.
[35] Yu, W., Clyne, M., Dolan, S.M., Yesupriya, A., Wulf, A., Liu, T., Khoury, M.J. and Gwinn, M. 2008. GAPscreener: an automatic tool for screening human genetic association literature in PubMed using the support vector machine technique. BMC bioinformatics. 9, (2008), 205.