Bayesian Models for Tourism Demand Forecasting
Kevin K.F. Wong
School of Hotel and Tourism Management Hong Kong Polytechnic University
Hung Hom, Kowloon Hong Kong SAR, P.R. China
Haiyan Song*
School of Hotel and Tourism Management Hong Kong Polytechnic University
Hung Hom, Kowloon Hong Kong SAR, P.R. China
Tel: +852 2766 6372 Fax: +852 2362 9362
Kaye S. Chon
School of Hotel and Tourism Management Hong Kong Polytechnic University
Hung Hom, Kowloon Hong Kong SAR, P.R. China
* Corresponding author.
ACKNOWLEDGMENT: The research was funded by the Competitive Earmarked Research Grant (Project Account: B-Q718) from the Hong Kong Polytechnic University for which the
Bayesian Models for Tourism Demand Forecasting
Abstract
This study extends the existing forecasting accuracy debate in the tourism literature by examining the forecasting performance of various vector autoregressive (VAR) models. In particular, this study seeks to ascertain whether the introduction of the Bayesian restrictions (priors) to the unrestricted VAR process would lead to an improvement in forecasting performance in terms of achieving a higher degree of accuracy. The empirical results based on a data set on the demand for Hong Kong tourism show that the Bayesian VAR (BVAR) models invariably outperform their unrestricted VAR counterparts. It is noteworthy that the univariate BVAR was found to be the best performing model among all the competing models examined.
Keywords: forecasting performance; vector autoregressive process; over parameterization; Bayesian approach
1. Introduction
A large number of published studies have appeared in the tourism forecasting literature over the last three decades with a majority of them focusing on the
econometric and time series modeling techniques (for detailed reviews of the tourism forecasting literature, see, for example, Li, et al, 2005, Crouch, 1994a and 1994b, Lim, 1997 and 1999 and Witt and Witt, 1995). Over the last few years, a small number of publications that deal with such niche areas as the neural networks (Law and Au 1999), structural modeling (Turner and Witt, 2001a, 2001b), time varying parameter method (TVP) (Song and Witt, 2000, Song and Wong, 2003) and the binomial model with Bayesian priors (Stroud, Sykes and Witt, 1998) have also attracted the attention and interest of researchers in tourism forecasting. One of the main objectives of the tourism forecasting literature has been to examine the forecasting performance of various modeling techniques and to provide useful guidelines for the selection of forecasting models in practice. However, the findings of the empirical studies have been inconclusive.
Martin and Witt (1989) and Witt and Witt (1991) showed that no single forecasting method can be consistently ranked as best across different situations
(origin-destination country pairs, forecasting horizons, accuracy measures) and the relative performance of different tourism forecasting techniques is also highly dependent on the choice of accuracy measure. They recommended that different tourism forecasting requirements in terms of forecasting horizons and the use of accuracy measures must be considered carefully before deciding on a forecasting method. For example, for some decisions it may be more important to minimise the size of the forecast error
while for others it may be more important to forecast correctly the direction of movement of tourism demand. Evaluated from the viewpoint of the forecasting error magnitude, the empirical evidence provided by Martin and Witt (1989), Kulendran and Witt (2001) and Sheldon (1993) suggests that no change (or random walk) model tends to generate more accurate short-term tourism forecasts than simple univariate time series and traditional econometric models while the autoregressive and moving average (ARMA) model generates more accurate medium-term tourism forecasts than the no change model. In terms of the directional change error measures, Witt and Witt (1989) and Witt, Song and Louviris (2004) demonstrate that econometric models tend to generate more accurate forecasts than the no change and simple univariate time series models.
Published studies on tourism forecasting before 1990s focused mainly on traditional regression methods while the recent studies have concentrated increasingly on the more advanced econometric techniques including cointegration analysis, error correction model (ECM), vector autoregressive (VAR) process and time varying parameter approach. A recent paper by Song, Witt and Jensen (2003) examined the forecasting performance of these modern econometric techniques compared with that of traditional regression and time series approaches. They found that the univariate time series model is likely to generate more accurate short-term tourism forecasts than the ECM, and the no-change model generates more accurate short- and medium-term forecasts than the VAR model. The TVP model often produced the most accurate short-term tourism forecasts outperforming both univariate time series models and other causal models including the ECM.
Some of the evidence regarding the accuracy of recent forecasting approaches is, however, mixed. For example, González and Moral (1996) found that the basic
structural model outperforms the ARIMA model, whereas Kulendran and King (1997), Turner and Witt (2001a, 2001b) discovered the converse to be true. Song, Witt and Jensen (2003) and Kulendran and Witt (2001) found that the ECM is outperformed by the no-change model, while Kim and Song (1998) and Song, Romilly and Liu (2000) found that the ECM generates more accurate tourism forecasts than the no change model. Clearly, further research is required to establish the relative accuracy of some of the more recent forecasting approaches in the context of international tourism demand and this study is therefore a useful addition to the existing literature on the tourism forecasting competition.
The models examined in this paper relate to the various VAR specifications. Although the VAR approach developed by Sims (1980) has been used successfully in
forecasting other macroeconomic activities, its application to tourism forecasting has been very limited. Exceptions are Song and Witt (2000), Song, Witt and Jensen (2003) and Witt, Song and Wanhill (2003) who used traditional VAR models in forecasting tourism demand and tourism related employment. However, more concerted efforts are still needed to examine the forecasting performance of different VAR
specifications, particularly when the VARs are estimated using the Bayesian technique. It is hoped that this study will provide a useful guidance for tourism forecasting practitioners in selecting the best specification model when the VAR technique is used.
The rest of the paper is organized as follows. The next section provides a brief introduction to VAR models. Section 3 discusses the rationale of introducing the Bayesian priors to traditional VAR models. Section 4 presents the results of the forecasting performance based on three forecasting error measures and the last section concludes the paper.
2. Forecasting Tourism Demand Using Unrestricted VAR
The VAR modeling approach is an alternative to single equation econometric techniques, which have been widely used in tourism demand forecasting in the past. Previous studies (Witt, et al, 2003, and Song and Witt, 2005) suggest that the VAR models are superior to the single equation modeling approach for the following reasons. First, VAR models do not require an implicit theoretical framework in the construction and estimation of the forecasting models, which traditional econometric methods have assumed. The specification and estimation of the VAR models are flexible in the sense that it is neither necessary to specify the variables included in each of the equation nor to incorporate restrictions derived from economic theory. Secondly, traditional econometric models have been criticized for their poor
forecasting performance in the tourism context (Witt and Witt, 1995). Song, Witt and Jensen (2003) and Witt, Song and Wanhill (2003) use VAR models to forecast tourism demand and tourism generated employment in Denmark and the empirical results of their studies show that the VAR model can improve the forecasting
accuracy compared with that of the single equation approach. Thirdly, the forecasting process is not difficult to follow, as it involves a purely mechanical process that minimizes the costs of model construction and estimation. If one is constrained by
resources and time, this modeling technique can yield a high return with limited inputs. Last, but not the least, in order to forecast the dependent variable in a single equation econometric model, the forecasts of the explanatory variables need to be generated first and this requires the estimation of additional models, which can be difficult given the fact that the tourism forecasting process is normally restricted by data unavailability and costs.
Given these advantages of the VAR model over its single equation counterpart, a key step involved in VAR modeling is to choose the appropriate variables and the order of the autoregressive process. Obviously, it is not appropriate to include all the available data in order to maximize the number of relationships under study. The number of lags in a VAR model should be reasonably selected. Caution has to be exercised in the selection of the number of lags as the inclusion of too few lags may obscure or hide true relationships while the adding too many lags may use up the degrees of freedom in model estimation. In tourism forecasting, the sample information is often limited and the risk of having too few degrees of freedom to estimate parameters becomes considerable. Therefore, careful consideration has to be given to the decision on the appropriate variables and number of lags in the VAR model.
The forecasting exercise in this study is based on the analysis of demand for Hong Kong tourism by a number of key origin countries undertaken in recent related studies by Song and Wong (2003) and Song, Wong and Chon (2003). The demand model is simple and takes the following form:
where Qit is the tourism demand variable measured by tourist arrivals in Hong Kong
from country i at time t; Yit is the income level of origin country i at time t measured
by the index of domestic product (GDP, 1995=100); Pit is the relative cost of living in
Hong Kong to that in the origin country i and is defined as
Pit=[(CPIHK/EXHK)/(CPIi/EXi)] (2)
where CPIHK and CPIi are the consumer price indexes for Hong Kong and the origin
country i, respectively; EXHK and EXiare the exchange rate indexes (1995=100) for
Hong Kong and origin country i, respectively. The exchange rate is the annual average market rate of the local currency against the US dollar.
The Substitute Price variable is defined as a weighted index of selected countries/regions. Both geographic and cultural characteristics are considered when selecting the substitute destinations. Initially, China, Taiwan, Singapore, Thailand, Korea and Japan were considered to be substitute destinations for Hong Kong. However, the data required to calculate the index were unavailable for China for the whole sample period. Therefore, China was excluded as one of the substitute destinations. The substitute price index was calculated by weighing the consumer price index of each of the five substitute destinations according to its share of the international tourism arrivals, and it is given as:
st P ∑ = × = 5 1 ) / ( j j j j st CPI EX w P (3)
where j = 1,2,3,4 and 5 representing Singapore, Taiwan, Thailand, Korea and Japan, respectively; is the share of international tourism arrivals for country/region j,
which is calculated from , and is the total international
tourist arrivals in country/region j.
j w ] / [ 5 1 ∑ = = j j j j TTA TTA w TTAj
The tourism arrivals data are collected from the Visitor Arrivals Statistics published by the Hong Kong Tourism Board (previously the Hong Kong Tourism Association). The GDP index, the CPIs and exchange rates were obtained from the International Financial Statistics Yearbook published by the International Monetary Fund. The data used are annual figures and cover the period between 1973 and 2000.
In accordance with the main aim of this study - which is to examine the forecasting performance of this simple demand model specified as VAR and BVAR - our study begins with an unrestricted VAR model with p lags:
t t p it p it it it A X A X A X CD u X = ln − + ln − +...+ ln − + + ln 1 1 2 2 (4)
where Xit is a vector of endogenous variables ( Qit, Yit, Pit, Pst)’, Dt is a vector of
deterministic components including the intercept and dummy variables; p is the order of the autoregression and Ai and C are matrixes of the coefficients that needs to be
estimated. Following standard practice in demand analysis, we specified the VAR model in logarithm.
As discussed above the main reason to use VAR model is because of its simplicity in estimation, as it can be guaranteed that all equations within the VAR system share the same number of right hand side variables. As a result the VAR model can be
consistently and efficiently estimated equation-by-equation using ordinary least squares (OLS). However, the use of VAR models in forecasting has been criticized by researchers for the following reasons. First, because of its lack of theoretical
foundation, the VAR modeling technique cannot be used for policy evaluation
purposes. The examination of the determinants of tourism demand through evaluating the demand elasticities often forms an important part of tourism demand analysis and this cannot be achieved using VAR models. Secondly, another major problem
associated with VAR models is over parameterisation. If a VAR model has m
equations with p lags, the number of parameter need to be estimated would be m+pm2. In our case, given 4 equations and two lags for each variable in the VAR model, the minimum parameters to be estimated would be at least 36 parameters (excluding the intercept and coefficients of the dummy variables), which amounts to a minimum of 9 parameters for each equation within the VAR system. If the sample is restricted due to data unavailability, the forecasts may become erratic and poor in terms of accuracy. In many cases the VAR system also exhibits an explosive behavior due to the problem of over-parameterization (Litterman, 1986). If our main objective is to basically forecast tourism demand, the first problem may be tolerated. However, the over-parameterization problem needs to be resolved if the ultimate aim is to obtain accurate forecasts. There are essentially two ways to eliminate this over fitting problem. The first is to employ structural VARs by imposing theory based restrictions on the VAR parameters in order to reduce the number of parameters in the system. This solution, however, is more appropriate in the simulation context, where the main issue is to
determine how the economic variables will respond to certain types of shocks than in forecasting. The second solution is to employ alternative estimators in order to improve efficiency of the estimation and the forecasting accuracy. One of such methods would be to use the Bayesian approach in the model estimation.
3. Bayesian Approach to Tourism Forecasting
Although quite a few publications on BVAR models have appeared in the literature relating to macroeconomic forecasting (For example, Riberio Ramos, 2003), no known study has been undertaken in modeling and forecasting tourism demand. BVAR models are estimated based on Bayesian statistical theory, which combines priors with sample information in model estimation. BVAR reduces the risk of over parameterization by imposing certain restrictions on the VAR parameters, which in turn are based upon their prior probability distribution functions. These prior probability distribution functions incorporate the priors introduced by the modeler about the model parameters, which include the mean of the distribution and the variance of the distribution. The mean of the distribution refers to the prior about the value of the coefficient while its variance represents the degree of confidence of the modeler with regards to the prior mean. Prior probability distribution functions for the parameters represent the range of uncertainty around a prior mean and can be updated by sample information if its underlying distribution is sufficiently different from the prior. Using the Bayesian rule, the posterior distributions functions for model parameters can be achieved from the prior distribution functions together with the distributions functions of the sample data.
The specification of coefficient priors in a VAR model is the most important step in BVAR modeling. Informative priors can reduce the risks of over parameterization and unreliable forecasts, while diffused priors will distort the true data generating process without any gain in forecasting performance. The procedure of specifying the priors in this study is based on the Minnesota prior of Doan, Litterman and Sims (1984). The Minnesota prior assumes that most of the economic series can be described by a process known as random walk with drift (RWD). That is the variable, Xit in Equation
(3) can be written as
Xit = A1+Xit-1+ et (5)
According to this specification, the mean of the prior distributions for the first lag of the variable is fixed to unity while the means of the prior distributions for all other lags are assumed to be zeros. However, if the lags other than the first lag, have played important roles in the determination of the current value of Xit, this should be
reflected in the parameter matrix estimates based on the sample data. The priors for the deterministic variables, Dt in each equation are non-informative (flat). In addition
the prior distributions of all matrices A1,….,Ap are assumed to be independent normal.
Because of these assumptions, the only information required for the specification of the priors is the mean of the prior distribution for the first own lag in each equation and the standard deviation of the prior distribution for lag p of variable i in equation j. This standard deviation of the prior distribution can be written as
where f(j,j)= 1.0, sjis the standard error of a univariate auto-regression of equation j.
[γ p-df (j,i)] is called the tightness of the prior on coefficient, j,i,p and it is a
combination of three elements: the overall tightness γ; the decay parameter, d, which specifies that the prior standard deviations to decline in a harmonic manner, and the tightness of variable i in equation j relative to variable j, f(j,i).
Once the priors, γ, d and f (j,i) are specified, the Theil’s (1971) mixed-estimation technique that involves supplementing data with prior information on the distributions of the coefficient can be used to estimate Equation 3. For each restriction (prior) on the parameter estimates, the number of observations and degrees of freedom are increased by one in a systematic way. The loss of degrees of freedom due to
overparameterisation associated with traditional unrestricted VAR models is therefore no longer a problem with BVAR models (for further details of the Theil’s estimation method, see, Theil, 1971).
4. Forecasting Performance of BVAR Models
Specification of the VAR
The forecasting performance of the BVAR model is evaluated using the data on the demand for Hong Kong tourism by 6 major long haul markets, Australia, Canada, France, Germany, UK and USA. The VAR system includes the following variables as discussed in Section 2: the tourist arrivals from origin country i (Qit), income of origin
country, i (Yit), the relative CPI of Hong Kong to that of the origin country i adjusted
dummy variables which include a ‘oil crisis’ dummy in 1974, the 1992 gulf war dummy and the financial crisis dummy of 1997. For a detailed explanation of these variables, see Song, Wong and Chon (2003). Although there are four equations in each of the six VAR systems, our primary interest is the tourism demand equations, that is, the equations with the tourist arrivals as the dependent variables. Therefore, the forecasting performance will be assessed based on the six tourism demand equations though the general conclusion also applies to other equations in the VAR systems.
The tourist arrivals from the six countries have grown significantly over the last 27 years although there were some down turns associated with the change in economic conditions in the origin countries. USA has been the market leader for Hong Kong tourism followed by the UK and Australia. Tourists from France form the smallest market segment among the six long haul markets. Hong Kong tourism has depended very much on the performance of the US markets as tourist arrivals from USA exceeded that of other six markets combined in the 1990s. Therefore, accurate forecasts of tourism arrivals from the big long haul markets such as USA, UK and Australia would be crucial for the long term planning and development of the Hong Kong tourism industry.
The starting point of the analysis is the unrestricted VAR. From this unrestricted VAR a number of restricted models (including the BVARs) can be derived. The likelihood ratio statistic (LR) is used to decide the optimal lag length of the unrestricted VAR models (Song and Witt, 2000, p93). Given the number of observations, the lag length
is initially set at four and subsequently tested downwards. The LR statistics suggested that a lag length of two is appropriate for all six VAR models.
The variables included in the VAR models are specified as natural logarithm of the levels, and the reason for measuring the variables in log levels is based on the argument presented in the study by Sims et al (1990), ‘….the Bayesian approach is entirely based on the likelihood function, which has the same Gaussian shape
regardless of the presence of nostationarity, [hence] Bayesian inference need take no special account of nonstationarity’. In fact, an added advantage of BVAR models is that its estimation is not restricted by the integration order of the variables involved in the system.
Specification of the Priors
Five models are estimated based on the different choices of priors. These five models are a univariate autoregressive (AR) model, an unrestricted VAR, a univariate
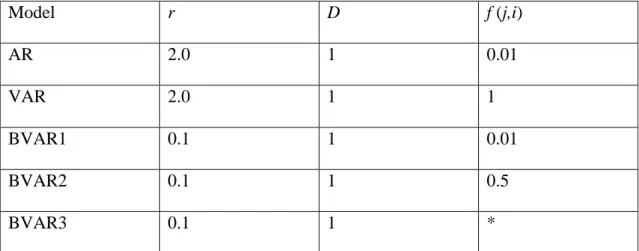
Bayesian VAR (BVAR1), a standard Bayesian VAR (BVAR2) and a general Bayesian VAR (BVAR3). The priors associated with each model are presented in
Insert Table 1 here
When the overall tightness, r, is set to a high value, such as a 2 in our case, the restriction on the coefficient of own lag is said to be very ‘loose’ and if at the same time a very low value is assigned to f (j,i), 0.01, for example, the VAR model is reduced to a simple autoregressive (AR) model. On the other hand if a high value, such as 1, is assigned to f (j,i), this means that there is no restriction being imposed on
the parameters in the VAR. In terms of the three BVAR models, the overall tightness,
r,is set to be 0.1 for all three models following the recommendation of the literature for small VAR systems. The decay parameter is set to be 1 according to the
recommendation by Doan, Litterman and Sims (1984). The three BVAR models are only differentiated by the specification of f(j,i). BVAR1 gives a very small value to f
(j,i) suggesting that the model is reduced to a univariate Bayesian autoregressive model, while BVAR2 assigns a value of 0.5 (weight) to f (j,i) to reflect the symmetric characteristic of the BVAR model. BVAR3 is a general Bayesian with the f (j,i) being specified individually. The definition of the individual elements in f (j,i) is decided by the minimization of the ex post forecasting errors.
The models are estimated using the data from 1973 to 1996 and the accuracy of the ex post forecasts are assessed by the mean absolute forecasting errors (MAFE), the root mean square forecasting errors (RMSFE) and the Theil U statistics for one-to three ahead forecasts. These statistics can be calculated from
MAFE=
∑
= + + − k i k t k t X n X 1 / | ˆ | RMSFE =∑
= + + − k i k t k t X n X 1 / ) ˆ (where and are k-periods-ahead actual and forecast values of X and n is the number of total forecasting periods,
k t
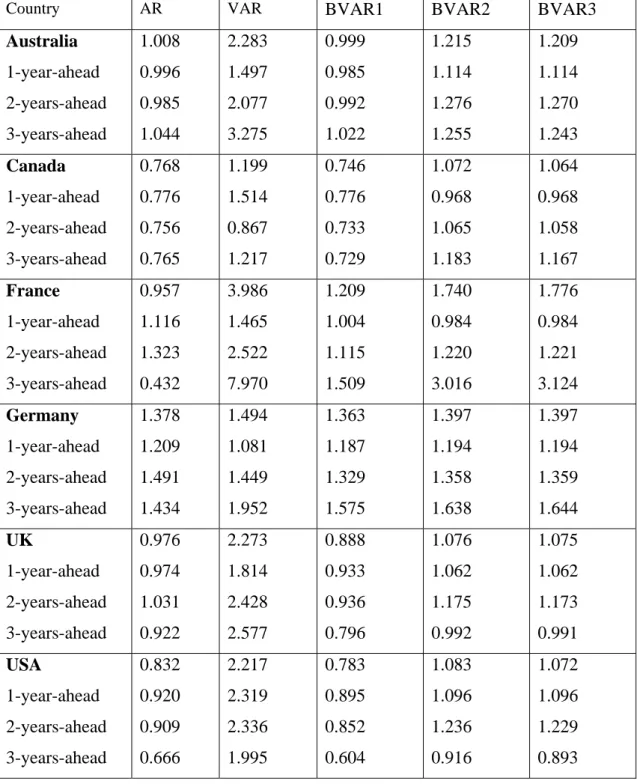
The Theil’s U statistic is calculated by dividing the RMSFE of the forecasting model by the RMSFE of the random walk (or no change model). If U <1, the forecasting model is said to be superior to the random walk models while U > 1 indicates that the random walk outperforms the forecasting model under consideration. The error measures (MAFE, RMSFE and U) are calculated using the Kalman filter algorithm which is incorporated in the Computing Software in RATS. The three forecasting error measures for one, two and three-periods-ahead and overall forecasts (the average of one-three-periods ahead forecasts) for the various tourism demand models are included in Tables 2-4.
(Insert Tables 2-4 here)
The results in Tables 2-4 suggest the following. First, the forecasts of tourism demand generated by the various BVAR models are far more accurate than the unrestricted VAR models, as measured by the MAFE, RMSFE and Theil’s U statistics for all the six origin countries considered. For example, the forecasting accuracy of all three BVAR models as measured by RMSFE and MAFE over that of the unrestricted VAR models have improved significantly. Especially, in the cases of models for Australia, France, and UK and USA models, the improvement of the forecasting accuracy of the BVAR1 model over the unrestricted VAR has been more than 100% (see Tables 2 and 3). This confirms our earlier argument that the Bayesian approach can improve the estimation efficiency of the VAR models, which then leads to more accurate forecasts.
Secondly, in terms of the three BVAR models, the best performing model is BVAR1, which is a univariate Bayesian VAR model. Since this model restricts the off diagonal elements of the coefficient matrix to be zero, the implication is that the lagged
economic variables (lagged income and price variables) do not contribute to the forecasting accuracy improvement. This, however, does not necessarily mean that these economic variables do not have any role to play in determining the demand for tourism. The reason why the lagged explanatory variables failed to improve the forecasting accuracy is that they enter the VAR system as leading indicators while many previous study suggest that the influence of the explanatory variables are often instantaneous (see, for example, Hiemstra and Wong, 2002, Song and Wong, 2003 and Tan et al, 2002). The BVAR models with influencing factors are still relevant in the analysis of tourism demand, although the findings in this study suggests that it maybe beneficial to use the univariate BVAR if the main objective of the research is related to forecasting.
Thirdly, it is not surprising that the results of the forecasting exercise suggest that the univariate time series approach performs better compared with not only the
unrestricted VAR model but also two of the BVAR models based on the three
forecasting accuracy measures. Some of the previous studies, such as Martin and Witt (1989), Sheldon (1993), Kulendran and King (1997) and Kluendran and Witt (2001), also found that the simple time series models often outperform the more sophisticated econometric approaches. This finding, however, does not mean that the univariate time series models always outperform the econometric models in all forecasting situations. Witt and Witt (1992) and Witt, Song and Louvieris (2004), however,
suggest that the econometric models are more accurate in forecasting the directional changes of tourism demand than simple time series models.
Fourthly, although the simple time series model (AR model) is superior to some of the complicated models, the forecasting performance of the simple time series model can still be further improved once the Bayesian priors are imposed on the parameters of the autoregressive processes. This suggests that the use of Bayesian approach can generally improve the forecasting accuracy compared to models which do not incorporate such priors.
Finally, according to the Theil U statistics one can see that only the autoregressive and the BVAR1 model outperform the random walk model (no-change model) while all the other VAR specifications generate much larger forecasting errors than the random walk forecasts. This again indicates that the simple time series models with or without the Bayesian priors should be used in tourism forecasting if the focus of the study is not policy related. For policy evaluation purpose, the econometric model should still be used.
5. Concluding Remarks
Past studies suggest that VAR models perform well in terms of error magnitude in tourism forecasting (Witt, Song and Louvieris, 2004 and Witt, Song and Wanhill, 2003). This research represents an extension of these studies by examining whether the forecasting performance of the VAR models can be further improved when they are estimated using the Bayesian approach. The initial hypothesis is that the Bayesian
method should improve the forecasting performance of unrestricted VAR models in the tourism context, as evident in the empirical studies of other economic forecasting exercises (Artis and Zhang, 1990 and Dua and Ray, 1996). The reason why Bayesian approach tend to improve the forecasting performance of the unrestricted VAR model may be attributed to the introduction of the Bayesian priors. These priors serve to improve the estimation efficiency through increasing the degrees of freedom and controlling for over-parameterization associated with the unrestricted VAR models.
The data set used to test this hypothesis relates to the demand for Hong Kong tourism by residents from six major origin countries – Australia, Canada, France, Germany, UK and USA. The forecasting demand models examined are based on those specified in Song, Wong and Chon (2003) and Song and Wong (2003). Different priors are imposed on the parameters within the VAR system, which leads to three different Bayesian models. These models are then estimated using the annual data from 1973 to 1996 and the observations from 1997 to 2002 are used to assess the accuracy of the forecasting performance. The empirical results show that the forecasting performance of the VAR model measured by MAFE and RMSFE has been greatly improved once the Bayesian priors are imposed on the VAR parameters. The results also suggest that the simplest BVAR model outperforms all other specifications including an AR model, an unrestricted VAR, two BVARs with lagged exogenous variables. The implication for tourism forecasters is that greater efficiency can be achieved in
tourism forecasting when the Bayesian modeling approach is used. Another important finding of this study is that the simple time series models tend to outperform the more sophisticated specifications, which corroborates similar findings by other researchers in the tourism forecasting literature. However, this result does not necessarily imply
that the indiscriminate use of the simple series approaches in all forms of tourism forecasting. In instances where policy evaluation and/or prediction of the directional changes in tourism demand is/are required, econometric models are still more relevant and useful.
One of the criticisms faced by the BVAR model is that it does not take into account possible long-run or cointegration relationships between the variables included in the forecasting system. Engle and Yoo (1987) suggested that in the presence of
cointegration, the VAR models with vector error correction mechanisms (VECM) tend to outperform traditional VAR and BVARs over longer forecasting horizons. A possible extension of this study is to incorporate the VECM in the BVAR
specification and compare the long-term forecasting performance of the VECM with that of the traditional VAR and BVARs. Another suggested direction for further research is to modify the hyperparameterisation scheme based on the Minnesota prior.
The values assumed by the hyperparameters are crucial in BVAR models, as these determine how far the BVAR coefficients are allowed to deviate from their prior
means and the extent to which the model is allowed to approach an unrestruicted VAR model. A simulation of the BVAR models different priors should enhance the reliability of the research findings.
References
Artis, M. J. and W. Zhang (1990). BVAR Forecasts for the G-7. International Journal of Forecasting 6, 349-362.
Crouch, G. I. (1994a). The Study of International Tourism Demand: A Review of Findings. Journal of Travel Research 33(1), 12-23.
Crouch, G. I. (1994b). The Study of International Tourism Demand: A Survey of Practice. Journal of Travel Research 32(4), 41-57.
Doan, T. A., R. B. Litterman and C. A. Sims (1984). Forecasting and Conditional Projections Using Realistic Prior Distributions. Econometric Reviews 1 (1), 1-100. Dua, P and S. C. Ray (1995). A BVAR model for the Connecticut Economy. Journal of Forecasting 14 (3), 167-180.
Engle, R. F. and B. S. Yoo (1987). Forecasting and Testing in Cointegrated System. Journal of Econometrics 35, 143-159.
González, P. and P. Moral (1996). Analysis of tourism trends in Spain. Annals of Tourism Research 23, 739-754
Hiemstra, S. and Wong, K.F. (2002). Factors Affecting Demand for Hong Kong Tourism in Hong Kong. Journal of Travel and Tourism Marketing 13 (1/2), 43-62. Kim, S. and H. Song (1998). An Empirical Analysis of Demand for Korean Tourism:
A Cointegration and Error Correction Approach. Tourism Analysis 3, 25-40. Kulendran, N. and M. L. King (1997). Forecasting International Quarterly Tourism Flows Using Error Correction and Time Series Models. International Journal of Forecasting 13, 319-327.
Kulendran, N. and S. F. Witt (2001). Cointegration versus Least Squares Regression.
Annals of Tourism Research 28, 291-311.
Forecasting Models. Journal of Travel Research (in Press).
Law, R. and N. Au. (1999). A Neural Network Model to Forecast Demand for Japanese Tourists in Hong Kong. Tourism Management 20(1), 89-97
Lim, C. (1997). Review of International Tourism Demand Models. Annals of Tourism Research 24(4) 835-849.
Lim, C. (1999). A Meta-Analytic Review of International Tourism Demand. Journal of Travel Research 37, 273-284.
Litterman, R. B. (1986). Forecasting with Bayesian Vector Autoregressions – Five Years of Experience. Journal of Business and Economic Statistics 4 (1) 25-38. Martin, C. A. and S. F. Witt (1989). Forecasting Tourism Demand: A Comparison of the Accuracy of Several Quantitative Methods. International Journal of
Forecasting 5, 5-17.
Riberio Ramos, F. F. (2003). Forecasts of Market Shares from VAR and BVAR Models: A Comparison of Their Accuracy. International Journal of Forecasting, 19, 95-110.
Sheldon, P. (1993). Forecasting Tourism: Expenditure versus Arrivals. Journal of Travel Research 32(1), 13-20.
Sims, C. (1980). Macroeconomics and Reality. Econometrica 48, 1-48.
Sims, C. et al (1990). Inference in Linear Time Series Models with some Unit Roots. Econometrica, 58, 113-144
Song, H., P. Romilly and X. Liu (2000). An Empirical Study of UK Outbound Tourism Demand. Applied Economics 32, 611-624.
Song, H., and S. F. Witt (2000). Tourism Demand Modelling and Forecasting: Modern Econometric Approaches. Pergamon: Oxford.
Alternative Econometric Models. International Journal of Forecasting 19, 123-141. Song, H., and Wong, K.F. (2003). Tourism Demand Modeling: A Time Varying Parameter Approach. Journal of Travel Research 42 (3), 57-64.
Song, H., Wong, K.F. and Chon, K.S. (2003). Forecasting Demand for Hong Kong Tourism. International Journal of Hospitality Management (forthcoming). Song, H. and S. F. Witt (2003) Tourism Forecasting: The General-to-Specific Approach. Journal of Travel Research 42 (3), 65-74.
Song, H., and S. F. Witt (2005). Forecasting Tourist Flows to Macau. Tourism Management (in Press)
Stroud, T. W. F., Sykes, A. M. and S. F. Witt (1998). Forecasting A Collection of Binomial Proportions in the Presence of Covariates. International Journal of Forecasting 14 (1), 5-15.
Tan, A. F., C. McCahon and J. Miller (2002). Modeling Tourist Flows to Indonesia and Malaysia. Journal of Travel and Tourism Marketing 13 (1/2), 63-84.
Theil, H. (1971). Principles of Econometrics. Wiley: New York.
Turner, L. W. and S.F. Witt (2001). Factors Influencing Demand for International Tourism: Tourism Demand Analysis Using Structural Equation Modelling, Revisited. Tourism Economics 7(1) , 21-38.
Turner, L. W. and S.F. Witt, Forecasting Tourism Using Univariate and Multivariate Structural Time Series Models. Tourism Economics 7 (2), 135-147.
Witt, S. F. and C.A. Witt (1991). Tourism Forecasting: Error Magnitude, Direction of Change Error and Trend Change Error. Journal of Travel Research 30 (2), 26-33. Witt, S. F. and C. A. Witt (1995). Forecasting Tourism Demand: A Review of Empirical Research. International Journal of Forecasting 11, 447-475.
Selection. Journal of Travel Research 43 (2).
Witt, S. F., H. Song and S. Wanhill (2003). Forecasting Tourism Generated Employment in Denmark. Tourism Economics, 10, 167-176.
Wong, K.F. (1997a). An Investigation of the Time-Series Behaviour of International Tourist Arrivals, Tourism Economics, Vol. 3, No.2, June, 1997, p. 185-199. Wong, K.F. (1997b). The Relevance of Business Cycles in Forecasting International Tourist Arrivals, Tourism Management, Vol. 18, No.8, December 1997, p. 581-586. Wong, K.F., and Song, H. (2003). Tourism Forecasting and Marketing.. Haworth
Table 1 Priors Assigned to Each of the Models Model r D f (j,i) AR 2.0 1 0.01 VAR 2.0 1 1 BVAR1 0.1 1 0.01 BVAR2 0.1 1 0.5 BVAR3 0.1 1 *
Table 2 Mean Absolute Errors (MAFE)
Country AR VAR BVAR1 BVAR2 BVAR3
Australia 1-year-ahead 2-years-ahead 3-years-ahead 0.123 0.095 0.135 0.138 0.276 0.136 0.284 0.407 0.127 0.096 0.142 0.142 0.196 0.117 0.188 0.283 0.162 0.117 0.187 0.182 Canada 1-year-ahead 2-years-ahead 3-years-ahead 0.150 0.078 0.147 0.225 0.203 0.132 0.125 0.350 0.143 0.076 0.141 0.212 0.225 0.104 0.215 0.355 0.223 0.104 0.213 0.351 France 1-year-ahead 2-years-ahead 3-years-ahead 0.102 0.119 0.164 0.022 0.285 0.116 0.345 0.394 0.104 0.096 0.157 0.061 0.131 0.078 0.167 0.148 0.131 0.078 0.167 0.148 Germany 1-year-ahead 2-years-ahead 3-years-ahead 0.378 0.219 0.479 0.436 0.446 0.192 0.444 0.701 0.369 0.184 0.396 0.528 0.380 0.181 0.400 0.558 0.380 0.181 0.401 0.559 UK 1-year-ahead 2-years-ahead 3-years-ahead 0.147 0.104 0.155 0.183 0.306 0.191 0.353 0.373 0.134 0.097 0.146 0.158 0.165 0.115 0.181 0.199 0.164 0.115 0.180 0.198 USA 1-year-ahead 2-years-ahead 3-years-ahead 0.077 0.076 0.081 0.075 0.208 0.180 0.194 0.252 0.071 0.071 0.082 0.061 0.097 0.089 0.097 0.105 0.095 0.089 0.097 0.099
Table 3 Root Mean Square Forecasting Errors (RMSFE)
Country AR VAR1 BVAR1 BVAR2 BVAR3
Australia 1-year-ahead 2-years-ahead 3-years-ahead 0.147 0.123 0.166 0.153 0.338 0.185 0.351 0.479 0.146 0.122 0.167 0.150 0.179 0.137 0.215 0.184 0.178 0.137 0.214 0.182 Canada 1-year-ahead 2-years-ahead 3-years-ahead 0.158 0.089 0.153 0.231 0.239 0.174 0.176 0.367 0.152 0.089 0.149 0.219 0.228 0.111 0.216 0.356 0.226 0.111 0.215 0.351 France 1-year-ahead 2-years-ahead 3-years-ahead 0.111 0.124 0.188 0.020 0.307 0.163 0.357 0.401 0.115 0.112 0.158 0.076 0.145 0.110 0.173 0.152 0.145 0.110 0.173 0.152 Germany 1-year-ahead 2-years-ahead 3-years-ahead 0.366 0.228 0.504 0.516 0.347 0.203 0.490 0.703 0.337 0.224 0.450 0.567 0.342 0.225 0.459 0.590 0.343 0.225 0.460 0.592 UK 1-year-ahead 2-years-ahead 3-years-ahead 0.165 0.126 0.186 0.184 0.396 0.234 0.439 0.515 0.149 0.120 0.169 0.159 0.182 0.137 0.212 0.198 0.182 0.137 0.212 0.198 USA 1-year-ahead 2-years-ahead 3-years-ahead 0.102 0.093 0.118 0.094 0.272 0.234 0.302 0.281 0.095 0.091 0.110 0.085 0.123 0.110 0.160 0.129 0.132 0.111 0.159 0.126
Table 4 Theil Coefficients
Country AR VAR BVAR1 BVAR2 BVAR3
Australia 1-year-ahead 2-years-ahead 3-years-ahead 1.008 0.996 0.985 1.044 2.283 1.497 2.077 3.275 0.999 0.985 0.992 1.022 1.215 1.114 1.276 1.255 1.209 1.114 1.270 1.243 Canada 1-year-ahead 2-years-ahead 3-years-ahead 0.768 0.776 0.756 0.765 1.199 1.514 0.867 1.217 0.746 0.776 0.733 0.729 1.072 0.968 1.065 1.183 1.064 0.968 1.058 1.167 France 1-year-ahead 2-years-ahead 3-years-ahead 0.957 1.116 1.323 0.432 3.986 1.465 2.522 7.970 1.209 1.004 1.115 1.509 1.740 0.984 1.220 3.016 1.776 0.984 1.221 3.124 Germany 1-year-ahead 2-years-ahead 3-years-ahead 1.378 1.209 1.491 1.434 1.494 1.081 1.449 1.952 1.363 1.187 1.329 1.575 1.397 1.194 1.358 1.638 1.397 1.194 1.359 1.644 UK 1-year-ahead 2-years-ahead 3-years-ahead 0.976 0.974 1.031 0.922 2.273 1.814 2.428 2.577 0.888 0.933 0.936 0.796 1.076 1.062 1.175 0.992 1.075 1.062 1.173 0.991 USA 1-year-ahead 2-years-ahead 3-years-ahead 0.832 0.920 0.909 0.666 2.217 2.319 2.336 1.995 0.783 0.895 0.852 0.604 1.083 1.096 1.236 0.916 1.072 1.096 1.229 0.893