Application of Self-Organizing Maps in Conformational Analysis of
Lipids
Marja T. Hyvo1nen,*,§,‡Yrjo1 Hiltunen,†,⊥Wael El-Deredy,| Timo Ojala,£ Juha Vaara,& Petri T. Kovanen,§and Mika Ala-Korpela§,⊥
Contribution from the Wihuri Research Institute, Kalliolinnantie 4, FIN-00140 Helsinki, Finland, NMR Research Group, Department of Physical Sciences, P.O. Box 3000, FIN-90014 UniVersity of Oulu, Oulu, Finland, The Raahe Institute of Computer Engineering, Pehr Brahe Laboratory, P.O. Box 82, FIN-92101 Raahe, Finland, Neuroproduction Ltd., Ratakatu 1 b A 3, FIN-00120 Helsinki, Finland, Institute of Neurology, Queen Square, London WC1N 3BG, UK, MediaTeam Oulu, P.O. Box 4500, FIN-90014, UniVersity of Oulu, Oulu, Finland, Department of Chemistry, P.O. Box 55
(A. I. Virtasen aukio 1), UniVersity of Helsinki, FIN-00014 Helsinki, Finland ReceiVed July 14, 2000. ReVised Manuscript ReceiVed October 30, 2000
Abstract: The characteristics of lipid assemblies are important for the functions of biological membranes. This has led to an increasing utilization of molecular dynamics simulations for the elucidation of the structural features of biomembranes. We have applied the self-organizing map (SOM) to the analysis of the complex conformational data from a 1-ns molecular dynamics simulation of PLPC phospholipids in a membrane assembly. Mapping of 1.44 million molecular conformations to a two-dimensional array of neurons revealed, without human intervention, the main conformational features in hours. Both the whole molecule and the characteristics of the unsaturated fatty acid chains were analyzed. All major structural features were easily distinguished, such as the orientational variability of the headgroup, the mainly trans state dihedral angles of the sn-1 chain, and both straight and bent conformations of the unsaturated sn-2 chain. Furthermore, presentation of the trajectory of an individual lipid molecule on the map provides information on conformational dynamics. The present results suggest that the SOM method provides a powerful tool for routinely gaining rapid insight to the main molecular conformations as well as to the conformational dynamics of any simulated molecular assembly without the requirement of a priori knowledge.
I. Introduction
Accumulating information implies the importance of the structural features of lipid assemblies in determining the functional properties of biological membranes.1Elucidating the structural characteristics of the variety of lipid assemblies is thus of fundamental importance. In addition to traditional experimental methods of structural biology, molecular dynamics (MD) simulations have lately been increasingly used in the studies of biological membranes.2-5Simulations produce a large amount of data that should be efficiently analyzed to gain insight to the structural and dynamic features of the system. A typical
procedure is to calculate a variety of structural parameters, to visualize the molecules frame-to-frame, and to analyze confor-mations by using clustering algorithms that assume the existence of clusters and may require advance selection of cutoffs for cluster size or number of clusters.6-9Especially in the case of large molecular assemblies such as lipid bilayers, these methods are tedious and not necessarily able to provide an all-inclusive view of the structural characteristics.
Neural network-based analyses have been extensively used to handle complex multidimensional data in many fields of science and technology.10-13This methodology has been proven efficient in cases where traditional analysis would be time-consuming or even incapable of extracting any comprehensive view.14-22 Although no a priori knowledge of main lipid * Address correspondence to this author. Telephone: +358-9-6814132.
Fax: +358-9-637476. E-mail: [email protected].
§Wihuri Research Institute.
‡NMR Research Group, University of Oulu. †The Raahe Institute of Computer Engineering. ⊥Neuroproduction Ltd.
|Institute of Neurology.
£MediaTeam Oulu.
&University of Helsinki. On leave from NMR Research Group,
University of Oulu.
(1) Mouritsen, O. G.; Kinnunen, P. K. J. In Biological Membranes, A Molecular PerspectiVe from Computation and Experiment; Merz, K. M., Jr., Roux, B., Eds.; Birkha¨user: Boston, 1996; pp 463-502.
(2) Merz, K. M., Jr.; Roux, B. Eds. Biological membranes, A molecular perspectiVe from computation and experiment; Birkha¨user: Boston, 1996. (3) Tieleman D. P.; Marrink, S. J.; Berendsen, H. J. C. Biochim. Biophys. Acta 1997, 1331, 235.
(4) Tobias, D. J.; Tu, K.; Klein, M. L. Curr. Opin. Colloid Interface Sci. 1997, 2, 15.
(5) Hyvo¨nen, M. T.; Rantala, T. T.; Ala-Korpela, M. Biophys. J. 1997, 73, 2907.
(6) Shenkin, P. S.; McDonald, D. Q. J. Comput. Chem. 1994, 15, 899. (7) Torda, A. E.; van Gunsteren, W. J. Comput. Chem. 1994, 15, 1331. (8) Troyer, J. M.; Cohen, F. E. Proteins: Struct., Funct., Genet. 1995, 23, 97.
(9) Bravi, G.; Gancia, E.; Zaliani, A.; Pegna, M. J. Comput. Chem. 1997, 18, 1295.
(10) Kangas, J.; Kohonen, T. Math. Comput. Simul. 1996, 41, 3. (11) Kohonen, T.; Oja, E.; Simula, O.; Visa, A.; Kangas, J. Proc.. IEEE 1996, 84, 1358.
(12) Kohonen, T.; Kaski, S.; Lagus, K. K.; Saloja¨rvi, J.; Paatero, V.; Saarela, A. IEEE Trans. Neural Networks 2000, 11, 574.
(13) Zhu, B.; Ramsey, M.; Chen, H. IEEE Trans. Image Proc. 2000, 9, 163.
(14) Usenius, J.-P.; Tuohimetsa¨, S.; Vainio, P.; Ala-Korpela, M.; Hiltunen, Y.; Kauppinen, R. A. NeuroReport 1996, 7, 1597.
(15) Haydon, G. H.; Jalan, R.; Ala-Korpela, M.; Hiltunen, Y.; Hanley, J.; Jarvis, L. M.; Ludlam, C. A.; Hayes, P. C. J. Viral Hepatitis 1998, 5, 255.
810 J. Am. Chem. Soc. 2001, 123, 810-816
10.1021/ja0025853 CCC: $20.00 © 2001 American Chemical Society
conformations is available from the biomembrane MD simula-tion trajectories, the self-organizing map (SOM) based analy-sis23,24can provide an efficient means to handle the data. The idea of SOM is to transform n-dimensional input data vectors consisting of, e.g., parameters that determine molecular con-formation into a two-dimensional discrete map. The input vectors that share common features are projected to the same or neighboring neurons on the map.23,24 The SOM-based approach could be routinely utilized in the analysis of MD data, as the SOM method implemented in free-ware software is available25and requires no extensive knowledge of neural nets. Furthermore, the analysis can be performed in an up-to-date workstation or personal computer in hours.
The potential uses of the information obtained from SOM-based analysis of lipid conformations include selecting relevant structures for electronic structure calculations of, e.g., specific interactions taking place at active sites, as well as using molecular assemblies of main conformations as good “pre-equilibrated” starting structures for further simulation studies. Moreover, the main conformations and their relative probabilities can offer a realistic basis for the construction of minimalistic, nonatomistic models26that rely on the prevailing conformational states of the constituent molecules. In the field of membrane biophysics, these models are able to address large-scale coop-erational structural and dynamic properties of lipid assemblies (e.g., phase transitions and domain formation), which are not reachable by MD simulations. Furthermore, SOM-based analysis of lipid conformations provides a sound basis for studies on various characteristics of membrane conformation, such as the degree of correlation between neighboring lipid molecules.
The SOM-based conformation analysis is also directly applicable to other kinds of molecular simulations of various molecular species. In fact, the simulation of a relatively simple five-amino acid peptide has been analyzed by using an automated approach based on neural nets.21Although that study was performed for a small peptide, it promoted the idea of using neural nets also in the analysis of far more complex molecular systems. In relation to molecular structure, SOM analysis has been used to classify protein-databank-based 3D structures of nine amino acid sequences.22
We have applied SOM in the analysis of the 1.44 million lipid conformations from a 1-ns MD simulation of a 1-palmitoyl-2-linoleoyl-sn-glycero-3-phosphatidylcholine (PLPC) phospho-lipid membrane (Figure 1), reported in ref 5. The PLPC membrane was simulated to gain information on the effects of double bonds of the sn-2 fatty acid chains. Despite their physiological importance, membranes of polyunsaturated phos-pholipids had not been considered earlier in MD simulation
studies. In the present work we demonstrate the possibilities of the SOM approach to aid in the analysis of a MD simulation trajectory by presenting the results for the main conformations of the whole lipid molecule as well as the sn-2 chains. We chose the sn-2 chain to demonstrate that, in addition to getting an overview of the main conformational features, the SOM-based analysis can also be used in zooming into more detailed small-(16) Kaartinen, J.; Hiltunen, Y.; Kovanen, P. T.; Ala-Korpela, M. NMR
Biomed. 1998, 11, 168.
(17) Tafeit, E.; Reibnegger, G. Clin. Chem. Lab. Med. 1999, 37, 845. (18) Rose, V. S.; Croall, I. F.; MacFie, H. J. H. Quant. Struct.-Act. Relat. 1991, 10, 6.
(19) Marabini, R.; Carazo, J. M. Biophys. J. 1994, 66, 1804. (20) Chastrette, M.; Cretin, D.; El Aidi, C. J. Chem. Inf. Comput. Sci. 1996, 36, 108.
(21) Karpen, M. E.; Tobias, D. J.; Brooks, C. L., III Biochemistry 1993, 32, 412.
(22) Schuchhardt, J.; Schneider, G.; Reichelt, J.; Schomburg, D.; Wrede, P. Protein Eng. 1996, 9, 833.
(23) Haykin, S. Neural Networks, A ComprehensiVe Foundation; Prentice Hall: New Jersey, 1999.
(24) Kohonen, T. Self-organizing Maps; Springer-Verlag: Heidelberg, 1995.
(25) Vesanto, J.; Alhoniemi, E.; Himberg, J.; Kiviluoto, K.; Parviainen, J. Simul. News Eur. 1999, 25, 54. http://www.cis.hut.fi/research/software. shtml.
(26) Mouritsen, O. G. Tenside Surf. Det. 1993, 30, 4.
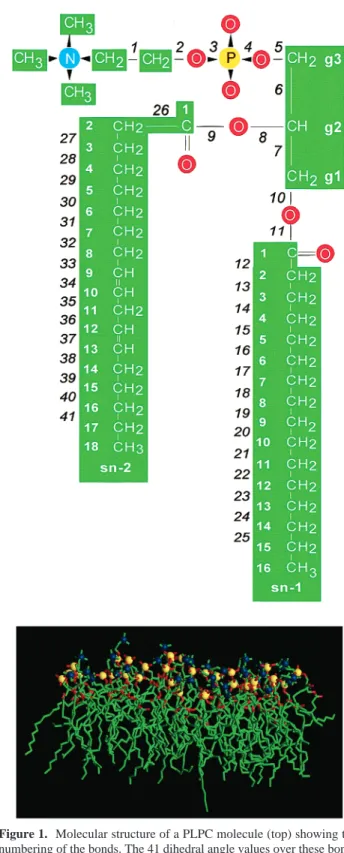
Figure 1. Molecular structure of a PLPC molecule (top) showing the numbering of the bonds. The 41 dihedral angle values over these bonds were used to describe the molecular conformation. Also a snapshot of the primary simulation box containing the replicated monolayer assembly from the molecular dynamics simulation is shown (bottom). For clarity, the hydrogens and water molecules are not shown. The simulation produced 1 440 000 lipid conformations that were used as input data for the self-organizing map (SOM).
scale characteristics. Additionally, we show the capability of this approach to address the conformational dynamics of individual molecules by determining a trajectory of a single lipid in the map.
II. Methods
A. Simulation and Data Preparation. The lipid molecule used in the simulated bilayer system is shown in Figure 1. The PLPC molecule consists of a glycerol backbone (Cg1-Cg3) to which the saturated palmitate chain (16:0), the diunsaturated linoleate chain (18:2∆9,12), and the PC headgroup are attached at the sn-1, sn-2, and sn-3 positions, respectively. The 36-molecule piece of the monolayer was used to model an infinite bilayer by applying rotation-reflection in the direction of the layer normal and conventional periodic boundary conditions in the plane of the layer.5 A 1-ns simulation was performed with the CHARMm software.27A snapshot from the end of the simulation is shown in Figure 1 for the monolayer assembly presenting the primary simulation box. We refer to our earlier paper5 for details of the simulation methodology and the results from a traditional trajectory analysis. The coordinates of the atoms were saved every 0.25 ps, and hence the data subjected to the present analysis consisted of 40000× 36 PLPC conformations, i.e., 1 440 000 in total.
The conformation of the PLPC molecule was described by the sequence of its 41 dihedral angle values (see numbering of the bonds in Figure 1). The values of the angles were given in the scale of-90° to 270°over the bonds 9, 11, 34, and 37, and in the scale of 0°to 360° over other bonds. This was due to the differences in the main conformations of the bonds; it was necessary to eliminate the possibility that jumps of nearly 360°would appear in the value of the angle. For instance, in the case of single bonds the scale could not be set from -180°to 180°as the fluctuations around the trans state ((180°) would cause the appearance of two clusters with negative or positive values. In addition to performing the analysis for the whole molecule, molecular parts also were treated separately. Here the analysis is reported for the whole molecule (angles 1-41) and its unsaturated sn-2 chain (angles 26-41). Visualization of molecular structures was carried out with the QUANTA software.28
B. SOM Analysis. The SOM can be used to map n-dimensional input vectors to the neurons in a two-dimensional array, where the input vectors sharing common features end up on the same or neighboring neurons.23,24This preserves the topological order of the original input data. Also, the map is able to reflect the variations in the statistics of the data and to select good features to approximate the distribution of the data. Each neuron is associated with an n-dimensional reference vector, which provides a link between the output and input spaces. The lattice type of the array of neurons, i.e. the map, can be taken as rectangular, hexagonal, or even irregular. However, hexagonal orga-nization is often suggested, as it best presents the connections to the neighboring neurons. The size of the map as defined by the number of neurons can be freely varied depending on the application; the more neurons the more details appear. Present SOM analysis software also provides tools to estimate the map size for each data set. The SOM analysis includes an unsupervized learning process. First, random values for the initial reference vectors are sampled from an even distribution, the limits of which are determined by the input data. During learning, the input data vector is mapped onto a particular neuron based on the minimal n-dimensional distance between the input vector and the reference vectors of the neurons. The neighbors of the central activated neuron are also activated according to a network-topology-dependent neighborhood function. For instance, the bubble neighborhood function, which is a squared step function around the central activated neuron, has been considered especially suitable for SOM.29 The common procedure is to use an initially large bubble function, which is then
reduced during the learning to the level of individual neurons. The reference vectors of the activated neurons are then updated. This procedure features a local smoothing effect on the reference vectors of the neurons in the neighborhood, leading eventually to a global ordering. In contrast to supervised learning strategies, where number and characteristics of the clusters need to be known beforehand, the SOM analysis, i.e., the mapping of input data into neurons representing characteristic features, does not require any a priori knowledge.23,24
In the present application, the sequence of dihedral angles pertaining to a PLPC molecule in a simulation snapshot is used as a 41-dimensional input vector. By varying the size of the map, the level of features affecting the organization can be varied. With a big map, small-scale features start to have an increasing effect. However, analysis of smaller scale features can also be performed with a small map by covering only certain parts of the molecule. Maps of 100 neurons in a 10×10 hexagonal arrangement were chosen for the final analysis since they provided a clear picture of the main conformational features while also allowing the visualization of some minor structural characteristics. The bubble neighborhood function was used. Every tenth conformation for each molecule was taken for the learning process after which all molecular conformations were assigned to the neurons of the trained map. To visualize the results, the reference vectors of each neuron were used to construct the corresponding molecular structures, reference conformations. To aid in the visual comparison of the molecular conformations, the glycerol backbone bond Cg2-Cg3 (bond number 6) was positioned in the same way in all the reference conformations. In the case of the sn-2 chain, the dihedral angles constituted a 16-dimensional input vector. The analysis of the conformations of the sn-2 chains was performed in an identical manner to the whole molecule. However, in the construction of the reference conformations, the first double bond C9-C10 (bond number 34) was aligned to aid the comparison. It should be kept in mind that the reference conformations do not necessarily occur in the actual simulation, but should be considered as an abstraction of the common features of the real conformations that share this reference vector.
To introduce this novel methodology, we have here performed the SOM analysis with basic procedures according to the instructions of the software. However, the procedure can be optimized for certain molecular systems, for instance, by adding extra conformational parameters (such as intramolecular distances) to the input vector, and by coupling certain dihedral angle sequences, presenting similar shape, together to end up in the same neuron. Also, if the minimum image convention would be incorporated to the software, the adjustment performed here for the dihedral angle scales would be unnecessary.
III. Results and Discussion
A. Main Conformations. (i) Whole Molecule. The map for the whole molecule presenting the total number of hits (number of assigned input vectors) for each reference vector is shown in Figure 2, together with the reference conformations of the most representative neurons. Generally, the headgroups and sn-1 chains are straight continuations of the glycerol backbone, whereas the sn-2 chain begins perpendicularly to the glycerol backbone. However, the reference conformations of, for in-stance, neurons 61 and 81 show structures where also the sn-1 chain is initially perpendicularly oriented. The reference con-formations of the molecule are visually very distinct if major torsional differences occur near the glycerol backbone.
A general feature of the headgroup structures is that mostly the phosphorus atom is approximately in-line with the glycerol backbone. This is followed by a tilt that is responsible for the calculated average tilt angle of 14° of the P-N vector with respect to the membrane surface.5However, neuron 96 shows an example of the choline group pointing upward as an almost straight continuation of a glycerol backbone. Bending of the choline groups toward the chains is also possible, as shown by neurons 20 and 61.
(27) CHARMm, Molecular Simulations Inc., an updated version of the original software: Brooks, B. R.; Bruccoleri, R. E.; Olafson, B. D.; States, D. J.; Swaminathan, S.; Karplus, M. J. Comput. Chem. 1983, 4, 187.
(28) QUANTA, Molecular Simulations Inc.
(29) Erwin, E.; Obermayer, K.; Schulten, K. Biol. Cybern. 1992, 67, 35.
The sn-1 chains (the chains on the right-hand side) in the depicted lipids present rather straight conformations, which is in accordance with the result that about 80% of their dihedral angles are in the trans state.5The sn-2 chain appears in bent conformations, where the tilt occurs most frequently in the region of the first carbons due to the perpendicular orientation of the chain beginning, and in the middle due to the unsaturation. The analysis of the sn-2 chains is presented in more detail below. In all, the map demonstrates the conformational flexibility of the phospholipids and indicates that no well-defined structural clusters exist. However, the knowledge of the most popular conformations helps in getting a realistic view of the lipid structures. The map demonstrates the wide variety occurring in the chain orientations. The degree of disorder due to the entanglement of the chains is high and, due to the extended conformations, the molecules may interact also with other than the nearest neighbors only. The many different characteristic lipid conformations and their flexibility should be kept in mind when considering, e.g., the possible interaction with lipases.
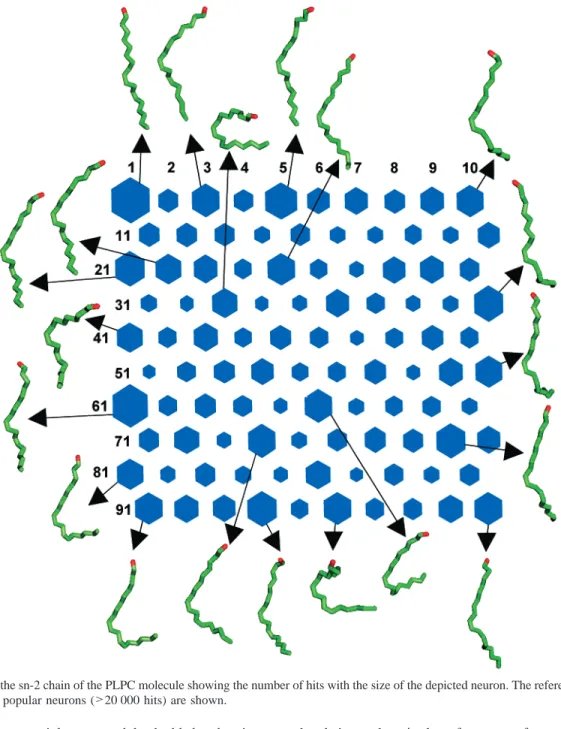
(ii) sn-2 Chain. The map for the sn-2 chain of the PLPC molecule presenting the number of hits per neuron is shown in Figure 3, together with the most popular reference conforma-tions. The unsaturation of the sn-2 chain is often thought to cause the appearance of heavily tilted conformations due to the cis state of the double bonds. However, in the case of two or more cis double bonds, the conformation of the double bond region is dominated by the dihedral angles over the single bonds located between the double bonds, i.e. the single bonds 35 and 36 in the case of PLPC. The dihedral angles over these bonds have values of approximately (120°. With the combinations of+120°/+120°(PP) and-120°/-120°(MM), the orientation of the double bonds with respect to the bilayer normal remains almost the same, whereas with the +120°/-120° (PM) or -120°/+120°(MP) combinations, the orientations of the double bonds differ by some 90°. Thus, diunsaturation may result both in straight and tilted conformations in the double bond region. From the reference conformations shown here, neuron 1 shows an example of a straight conformation. There the single Figure 2. SOM of the PLPC molecule showing the number of hits with the size of the depicted neuron. The reference conformations related to the most popular neurons (>25 000 hits) are shown.
bonds of the chain are mainly trans, and the double bond region is in the MM state, thus not forming a tilt in the chain. An utterly tilted conformation is displayed by neuron 33 where the MP state of the double bond region together with some gauche states of the single bonds cause a heavy tilt to the chain. Overall, this conformation is U-shaped and demonstrates a possibility of the methyl end of the chain to occasionally reside at the level of the glycerol backbone in the membrane. This kind of conformation is also visible in the reference conformation of neuron 94 in the map of the whole molecule (Figure 2). We have speculated a role for these tilted conformations in the experimentally observed increased permeability due to unsat-uration.5Such a conformation might also serve as a preceding stage for the appearance of extended conformations where the sn-2 chain penetrates to the water phase. These structures have been suggested to have a role in the interaction with peripheral proteins and in the early stage of membrane fusion.1,30Naturally, the overall tilt can be caused also by the single bond regions of
the chains such as in the reference conformation 41 in Figure 3.
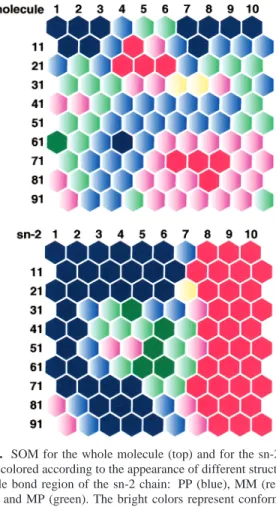
The appearance of local conformations in the maps of larger molecular fragments is illustrated in Figure 4. In an earlier paper we discussed the different internal structures of the double bond region in the PLPC membrane.5The PP, MM, PM, and MP structures constituted 32.1%, 39.0%, 9.3%, and 19.0% of the conformations, respectively, as calculated directly from the simulation. The maps of the whole molecule and the sn-2 chain clearly display these distinct regimes for the conformations of the double bond region. As the double bond region has a smaller effect on the conformation of the whole molecule, the color-coded mapping of the main conformations of the double bond region appears more diffuse in the SOM of the whole molecule than in the SOM of the sn-2 chain. However, the appearance of clusters for the distinct double bond region conformations emphasizes the strength of SOM to take into account important molecular features: although in this kind of approach the lack of a priori knowledge makes the validation of the training difficult, the analysis clearly gives meaningful results. (30) Holopainen, J. M.; Lehtonen, J. Y. A.; Kinnunen, P. K. J. Biophys.
J. 1999, 76, 2111.
Figure 3. SOM of the sn-2 chain of the PLPC molecule showing the number of hits with the size of the depicted neuron. The reference conformations related to the most popular neurons (>20 000 hits) are shown.
B. Conformational Dynamics. Conformational dynamics of individual molecules can be studied by determining the trajec-tories of lipids in the map, as illustrated for one molecule in Figure 5. These transition paths also aid in distinguishing larger conformational changes from the small-scale oscillations. The average number of nodes visited by one lipid molecule during the 1 ns trajectory was 23.5 in the map of the whole molecule and 64.8 in the map of the sn-2 chain. Thus, if the map in both cases presents the whole conformational space, the trajectory is clearly not long enough for one molecule to visit all possible conformations. The average time for one visit in each neuron is mostly relatively small, on the order of picoseconds. Especially for the sn-2 chain the average times are even shorter than a picosecond. The large number of quick transitions between closely related neurons dominates these average values. The conformational mobility of the chosen molecule is close to the average in the sense that it visits 25 neurons in the map of the whole molecule and 65 neurons in the map of the sn-2 chain. The neuron 41 of the map of the whole molecule is important for this lipid molecule due to both the number of hits (∼18500) and the average time for one visit (Figure 5). Of the other neurons that are important for characterizing the whole lipid assembly, this molecule visited neurons 6 and 21. Neuron 6 is the more important of these and together the conformations belonging to neurons 6 and 41 comprise 75% of the total simulation time for this particular lipid. The main conformational transitions occur between the conformations presented by neurons 6 and 41 but, in fact, never directly. Instead, the other
neurons are briefly visited on the way. This is most likely due to the several ways these popular conformations differ, and all changes are not likely to occur at once. Despite the actually rather similar dihedral angle sequences between the conforma-tions, the sn-2 chain looks very different due to the change in a state of the single bond 27. Also a change in the state of the glycerol backbone bond Cg2-Cg3 (bond number 6) changes the orientation of the whole headgroup and, additionally, there are several local changes in the headgroup conformation. A good example of smaller scale structural variations is the movement between neurons 5 and 6. This transition occurs often and requires mostly only minor changes (<10°) in the dihedral angle values. Only the angles 3, 27, and 35 show more remarkable changes of approximately 40°, 30°, and 20°, respectively.
In the map of the sn-2 chain the most important neurons for the chosen molecule are 61 and 100 with the greatest number of hits (∼5200 and∼9500 hits, respectively) and longest average time for one visit in these neurons (Figure 5). However, there are several other neurons where the lipid resides for relatively long times, most importantly 26 and 81. Roughly, there seem to be three main features in the transitions that take place: first, diagonally across the map between the neighborhoods of neurons 1 and 100; second, between the neighborhoods of neurons 61 and 60; and third , between the neighbourhoods of neurons 28 and 100. These main transitions occur via both several intermediate conformations and directly.
Conclusions
Efficient methods of analyzing main conformations and conformational dynamics from molecular dynamics simulations Figure 4. SOM for the whole molecule (top) and for the sn-2 chain
(bottom) colored according to the appearance of different structures of the double bond region of the sn-2 chain: PP (blue), MM (red), PM (yellow), and MP (green). The bright colors represent conformations that have the dihedral angle values of either +80°...+160° or -160°...-80°in the single bonds between the double bonds. The shaded colors represent reference conformations that are out of this range but are classified to the nearest conformations.
Figure 5. SOM for the PLPC molecule (top) and its sn-2 chain (bottom) showing with the size of the neuron the average time for one visit in each neuron by one of the 36 lipids. The transitions between the neurons are represented with lines.
of large lipid assemblies have been lacking. We have applied free-ware self-organizing map (SOM) software to obtain information on the main conformations during a 1-ns simulation of a PLPC bilayer. All main structural features can be easily distinguished, such as the orientational variability of the headgroup, the mainly trans state dihedral angles of the sn-1 chain, and both the straight and bent conformations of the unsaturated sn-2 chain. The map was chosen big enough to show also the less frequent conformations, which may, however, present functionally important features. Also the appearance of local conformations in the double bond region was demonstrated in the maps of both the whole molecule and the sn-2 chain. Moreover, to exemplify the possibility for investigation of conformational dynamics, the trajectory of an individual lipid molecule was mapped to the neurons. This way the main transitions can be distinguished from the minor conformational changes.
The SOM method appears to be a powerful tool that could be routinely utilized in the analysis of simulation trajectories. Not only lipids but also other molecules possessing substantial conformational freedom can be analyzed. Conformations of the whole molecule or distinct molecular parts can be studied and additional conformational parameters, such as specific intramo-lecular distances, may also be used for the needs of specific applications. However, the SOM-based analysis presented here does not exclude the need for traditional analysis, i.e., the examination of quantitative structural and dynamic parameters. Its merit is in providing, first, a possibility of gaining quick
insight to the molecular features of a complex molecular assembly without requirements for a priori knowledge. Second, it offers a sound basis for future studies on membrane characteristics, such as the determination of the degree of conformational correlation between neighboring lipids.
Acknowledgment. The Wihuri Research Institute is main-tained by the Jenny and Antti Wihuri Foundation. This work was supported by grants from the Federation of Finnish Insurance Companies (P. T. Kovanen, M. Ala-Korpela), the A. I. Virtanen Institute for Molecular Sciences, the Finnish Cultural Foundation, the Research Foundation of Orion Corporation, the University of Oulu (M. T. Hyvo¨nen), the Academy of Finland (T. Ojala, P. T. Kovanen, M. Ala-Korpela), and the Juselius Foundation (P. T. Kovanen, M. Ala-Korpela), as well as the Vilho, Yrjo¨, and Kalle Va¨isa¨la¨ Foundation (J. Vaara). We thank the Center for Scientific Computing (Espoo, Finland) for the computer resources. We also acknowledge Dr. Henrik Konschin for a critical reading of the manuscript.
Supporting Information Available: Tables of dihedral angle data for the reference conformations and the number of hits for the most representative neurons shown in Figures 2 and 3 and the number of hits and the average time for one visit for each neuron for the chosen individual lipid (PDF). This material is available free of charge via the Internet at http://pubs.acs.org.
JA0025853