METHODICAL EVALUATION OF QUALITY OF
SERVICE FOR HETEROGENEOUS NETWORKS
by
Farnaz Farid
A thesis submitted in fulfilment
for the degree of
Doctor of Philosophy
School of Computing, Engineering and Mathematics
Western Sydney University
ii I declare that to the best of my knowledge the work described in this thesis is, except where otherwise stated, entirely my own work and has not been submitted for a degree at this or any other university.
Farnaz Farid March, 2015
iii I would like to thank my supervisor Dr. Seyed Shahrestani for his guidance, suggestions, help, encouragement, and support throughout my entire thesis. He has motivated and inspired me throughout the research. Without his continuous help and support, it would not have possible for me to complete this thesis. I am deeply indebted to him for all his help and support.
I also would like to thank my co-supervisor Dr. Chun Ruan for her continuous help in completing this thesis. She has always checked my work and provided me valuable feedback to improve my work. I appreciate all her help and support.
I would like to thank all my colleagues in the Networking, Security, and Cloud Research Lab for their support throughout my study. I also appreciate the help and support of other colleagues from the School of Computing, Engineering and Mathematics.
I would like to thank my father, parents-in-laws, my husband, my sisters, brother, sister-in-law, my daughter, son and other family members and friends for all their support. My father has always tried his best to inspire throughout my research whenever I felt demotivated.
iv Heterogeneous wireless networks expand the network capacity and coverage by leveraging the network architecture and resources in a dynamic fashion. However, due to the presence of different communication technologies, the Quality of Service (QoS) evaluation, management, and monitoring of these networks are very challenging tasks. Each communication technology has its own characteristics while the applications utilising them have their own QoS requirements. Most current methods are based on analysing the QoS of each application or access network separately. However, these methods do not combine the performance of all the applications and the radio access networks while reporting the QoS of the overall configuration. Therefore, it is hard to get any aggregate performance results using these methods.
To fill this gap, in this thesis, a methodical approach is adapted for the QoS analysis of these types of networks. At first, the approach uses a simple fixed weight-based method, and then moves to a more complex dynamic weight-based method and in the end integrates the concepts of fuzzy logic. The proposed methods consider the significance of QoS-related parameters, the available network-based applications, and the available Radio Access Networks (RANs) to characterise the network performance with a set of three integrated QoS metrics. The first metric denotes the performance of each available application on the network, the second one represents the performance of each active RAN on the network, and the third one characterises the QoS level of the entire network configuration.
Using the fixed weight-based method, the weights for the QoS-related parameters, applications, and RANs are defined based on their significance relevant to a given situation. Then, the dynamic weight-based method determines the weights of these entities dynamically by incorporating the changing circumstances of the network. Although, the dynamic weight-based method can account for the active changes of the network, it has some limitations. For instance, it cannot capture the underlying uncertainty of network dynamics. To overcome these limitations, the concepts of fuzzy logic are adapted for further enhancement of the QoS evaluations.
v and monitoring of complex networks, consisting of different configuration settings, various network technologies supporting different applications. Therefore, it can quantify the performance of heterogeneous network-based service models by a unified QoS metric. This approach is also useful when some specific network-based service models are re-deployed from one region to another region. Each area has its own service requirements and technology availability. As a result, the service model, which demonstrates better performance in one context, is not necessarily going to have the same outcomes in another region. In such circumstances, it is possible to compare the resultant QoS level of any network-based service model with the expected QoS level by applying this approach.
To investigate the efficiency of the designed approach, a diverse range of simulation studies utilising different heterogeneous network-based service models are carried out. The simulation results indicate that the approach in this work facilitates better management and monitoring of heterogeneous network configurations and applications utilising them. The simulation studies also show that using the unified metrics, it is possible to choose a suitable network configuration for a particular application or service from among the range of available network configurations under investigation and classify them for their suitability to provide some specific services. Overall, the outcomes from the simulation results analysis clearly demonstrate that the proposed methods can significantly improve the QoS analysis of the heterogeneous networks.
vi Declaration ... ii Acknowledgements ... iii Abstract ... iv TABLE OF CONTENTS ... vi LIST OF FIGURES ... ix
LIST OF TABLES ... xiii
Acronyms ... xvi
Chapter 1: 1 Introduction ... 1
1.1 Problem Statement ... 2
1.2 Proposed Solutions ... 5
1.3 Thesis Outline ... 8
Chapter 2: 2 Background and Motivations ... 11
2.1 Wireless Communication Technologies ... 11
2.1.1 Wireless Local Area Networks (WLANs) ... 11
2.1.2 WiMAX... 14
2.1.3 Wireless Wide Area Network Technologies (WWANs) ... 18
2.2 Interworking Architectures in Heterogeneous Networks ... 28
2.3 QoS Model ... 31
2.4 QoS Analysis of Heterogeneous Networks ... 37
2.5 Applications of Fuzzy Logic ... 41
2.5.1 Fuzzy Logic Principles ... 42
2.6 Multi-criteria/Multi-Attribute Decision Making Algorithms... 51
2.7 E-model ... 58
2.8 Simulation Tools ... 60
2.9 Summary ... 63
Chapter 3: 3 Application-based QoS Evaluation ... 65
3.1 Introduction ... 65
3.2 Unified QoS Metric ... 66
3.3 Application-based QoS Requirement Analysis ... 68
3.4 Simulation Studies ... 74
3.5 Simulation Result Analysis ... 82
vii
3.5.3 Simulation Results and the Benchmark Values ... 98
3.6 Summary ... 100
Chapter 4: 4 Fixed Weight-based QoS Analysis ... 103
4.1 Introduction ... 104
4.2 The Fixed Weight-based QoS Analysis ... 108
4.2.1 QoS-related Parameter Weights ... 111
4.2.2 The Performance Metric ... 112
4.2.3 The Application QoS Metric ... 114
4.2.4 The RAN QoS Metric ... 114
4.2.5 The Network Configuration QoS Metric ... 115
4.3 Simulation Scenarios ... 116
4.3.1 UMTS-WiMAX-based Heterogeneous Network Scenarios ... 116
4.3.2 LTE-UMTS-based Heterogeneous Network Scenarios ... 119
4.3.3 Other Heterogeneous Network-based Scenarios ... 121
4.4 Simulation Result Analysis ... 124
4.4.1 UMTS/UMTS-WiMAX-based Networks ... 124
4.4.2 LTE/LTE-UMTS-based Networks... 126
4.4.3 Other Heterogeneous Networks ... 128
4.5 QoS Analysis ... 134
4.5.1 UMTS/UMTS-WiMAX-based Scenarios ... 135
4.5.2 LTE/LTE-UMTS-based Scenarios... 144
4.5.3 Other Heterogeneous Network-based Scenarios ... 146
4.6 Summary ... 154
Chapter 5: 5 Dynamic Weight-based QoS Evaluation ... 156
5.1 Introduction ... 157
5.2 Dynamic Weight-based QoS Evaluation ... 159
5.2.1 Dynamic Weight Calculation Details... 162
5.3 Simulation Scenarios ... 176
5.3.1 WLAN-UMTS-WiMAX Integration ... 176
5.3.2 LTE-UMTS-Ethernet Integration... 179
5.4 Impact of Application Significance ... 180
viii
5.7 Summary ... 195
Chapter 6: 6 QoS Evaluation through Fuzzy Logic ... 197
6.1 Introduction ... 198
6.2 The Proposed Evaluation Method ... 198
6.3 Fuzzy Modelling of Application QoS Evaluation Subsystem ... 201
6.3.1 Variables ... 202
6.3.2 Membership Functions ... 204
6.3.3 Rules ... 210
6.4 Fuzzy Modelling of Profiled Application QoS Subsystem ... 215
6.4.1 Variables ... 216
6.4.2 Membership Functions ... 217
6.4.3 Rules ... 218
6.5 Fuzzy Modelling of Radio Access Network QoS Subsystem ... 220
6.5.1 Variables ... 220
6.5.2 Membership Functions ... 221
6.5.3 Rules ... 222
6.6 Fuzzy Modelling of Network Configuration QoS Subsystem ... 224
6.6.1 Variables ... 224
6.6.2 Membership Functions ... 225
6.6.3 Rules ... 226
6.7 Defuzzification ... 227
6.8 Case Study ... 227
6.9 Comparison with Other Methods ... 233
6.10 Summary ... 235
Chapter 7: 7 Conclusions... 238
References ... 244
Publications arising from the work reported in the Thesis ... 257
Appendix A ... 259
ix
Figure 2.1 Frequencies and Data Rates for different Wireless LAN Standards ... 14
Figure 2.2 WiMAX Reference Model ... 16
Figure 2.3 WiMAX Characteristics ... 18
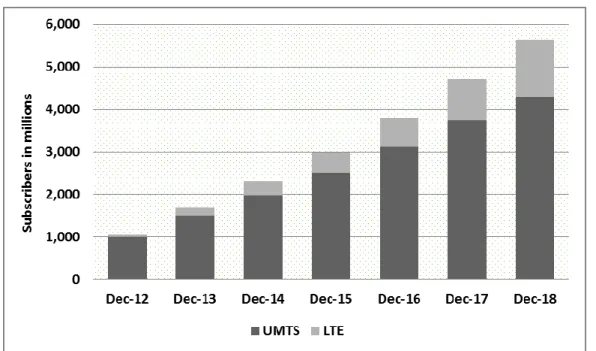
Figure 2.4 Global Growth of UMTS and LTE ... 22
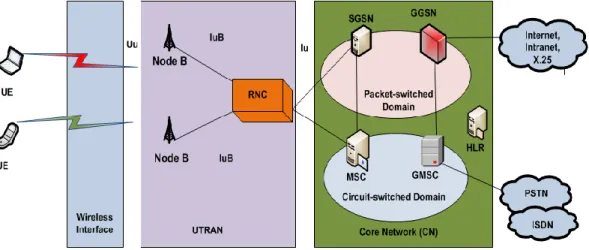
Figure 2.5 UMTS Reference Architecture ... 23
Figure 2.6 LTE High-level Architecture ... 25
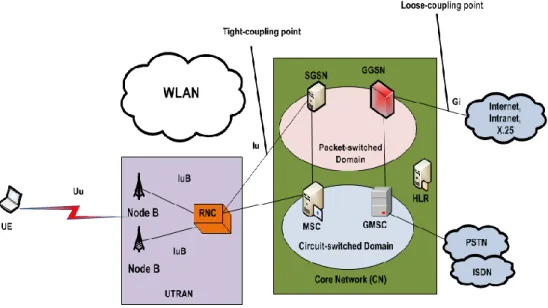
Figure 2.7 Loose-coupling and Tight-coupling Architecture ... 29
Figure 2.8 QoS Model ... 32
Figure 2.9 Proactive CAC Scheme ... 34
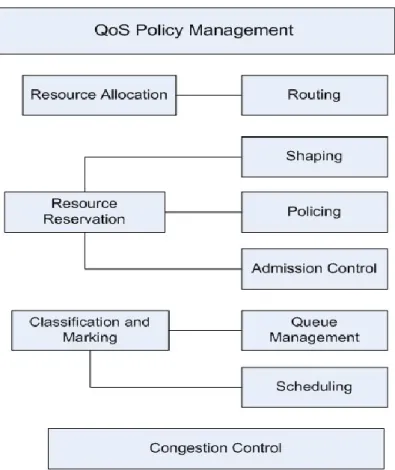
Figure 2.10 QoS Building Blocks ... 35
Figure 2.11 Relationship between QoS and QoE... 36
Figure 2.12 Tight-couple-based Energy-efficient VHO ... 40
Figure 2.13 Context-aware VHO Algorithm ... 41
Figure 2.14 Example of Triangular and Trapezoidal Function ... 45
Figure 2.15 Example of Gaussian Function ... 46
Figure 2.16 Example of Bell-shaped Function ... 46
Figure 3.1 Workflow of the Proposed Approaches ... 67
Figure 3.2 Comparison of End-to-end Delay ... 71
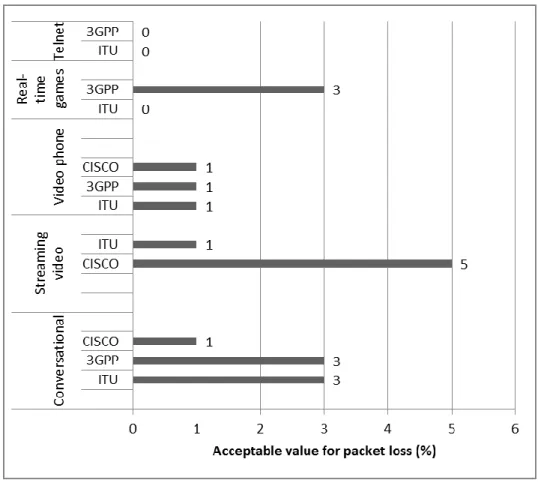
Figure 3.3 Comparison of Acceptable Packet loss in different Applications ... 72
Figure 3.4 Average Packet loss for 12 Voice Calls in the UMTS Network ... 83
Figure 3.5 Call-by-call Analysis of Packet loss ... 83
Figure 3.6 Average End-to-end delay for 12 Voice Calls in the UMTS Network.... 84
Figure 3.7 Average Packet loss for 20 Voice Calls in the UMTS Network ... 84
Figure 3.8 Average E2Edelay for 20 Voice Calls in the UMTS Network ... 86
Figure 3.9 Average Packet loss for 20 Simultaneous Calls in Urban Environments . 86 Figure 3.10 Packet loss for VS Clients in the UMTS-WiMAX Network ... 87
Figure 3.11 Packet loss for VS Clients in the UMTS Network ... 89
Figure 3.12 Average E2Edelay for VS Clients in the UMTS Network ... 90
Figure 3.13 E2Edelay for VC in the LTE Network .. Error! Bookmark not defined. Figure 3.14 Packet loss for VC in the LTE Network ... 91
Figure 3.15 Packet loss for VS client in the LTE Network ... 91
x
Environments ... 92
Figure 3.18 Impact of Number of Users on Average Packet loss ... 93
Figure 3.19 Packet loss of Voice Application after adding a VS Client ... 94
Figure 3.20 Average Packet loss for VS Clients in various RANs ... 96
Figure 3.21 Packet loss for Video Transmissions ... 98
Figure 3.22 Performance of Voice Calls based on Packet loss ... 99
Figure 3.23 Performance of Voice Calls based on E2Edelay ... 99
Figure 4.1 A typical Heterogeneous Network Scenario... 104
Figure 4.2 Deploying the Network-based Service Model of a Developed Country in a Developing Country ... 105
Figure 4.3 Deploying a New Network ... 106
Figure 4.4 Access Network Selection ... 107
Figure 4.5 QoS Analysis: Entities of a Network ... 109
Figure 4.6 Workflow for the Proposed QoS Evaluation Method... 110
Figure 4.7 UMTS-based Network Scenario ... 119
Figure 4.8 Heterogeneous Network Scenario ... 121
Figure 4.9 VC Architecture ... 123
Figure 4.10 End-to-end Delay of Voice Application after adding a VS Session .... 124
Figure 4.11 Packet loss for Voice Clients in the Presence of Streaming Client .... 125
Figure 4.12 Comparison of Packet loss for different Technologies... 127
Figure 4.13 Comparison of End-to-end Delay for different Technologies ... 128
Figure 4.14 Packet loss for UMTS Clients ... 130
Figure 4.15 Packet loss for WLAN Clients ... 130
Figure 4.16 Successful Received Packets for WLAN Clients in Voice Transmissions ... 131
Figure 4.17 Successful Received Packets for UMTS Clients in Voice Transmissions ... 132
Figure 4.18 Effects of VS Application on the Performance of Voice Calls ... 143
Figure 4.19 Effects of VS Codec on the Performance of Network ... 144
Figure 4.20 Comparisons of RAN QoS Metric for LTE and UMTS Network ... 146
Figure 4.21 The Performance Comparisons of different Access Networks... 148
xi
Applications ... 150
Figure 4.24 The Performance Analysis of Ethernet-Ethernet RAN for different Applications ... 151
Figure 4.25 The Performance Analysis of WLAN-Ethernet RAN for different Applications ... 151
Figure 4.26 Performance of WLAN-WiMAX RAN for different Applications ... 152
Figure 5.1 Workflow for the Proposed QoS Evaluation Method... 160
Figure 5.2 Application Weight Calculation using Dynamic Weight-based Method ... 162
Figure 5.3 Application Weights ... 176
Figure 5.4 UMTS-WLAN-WiMAX Integration ... 177
Figure 5.5 LTE-UMTS-Ethernet Simulation Scenario ... 180
Figure 5.6 The Effect of Application Significance on Network QoS ... 181
Figure 5.7 The Effect of different Application Significance on the Network Performance ... 182
Figure 5.8 The Performance Analysis with different Application Significance ... 182
Figure 5.9 UMTS-WiMAX-based Network Performance Analysis with different Application Significance ... 183
Figure 5.10 The Network Configuration QoS Metric for the Rural Area ... 187
Figure 5.11 Comparisons of Network Performance for different Configurations . 189 Figure 5.12 Performance Comparisons of Loose-coupling vs Tight-coupling Architecture ... 189
Figure 5.13 Performance Comparisons of LTE and UMTS Network ... 190
Figure 5.14 Performance Analysis of LTE network compared to the UMTS network ... 191
Figure 5.15 Comparison of Fixed and Dynamic Method for RAN QoS Metric ... 193
Figure 5.16 Detail Comparison of Fixed and Dynamic Weight-based Method .... 194
Figure 6.1 The Proposed Model ... 201
Figure 6.2 Membership Function for E2EDelay (Rural Area) ... 209
Figure 6.3 Membership Function for Jitter (Rural Area) ... 209
Figure 6.4 Membership Function for Packet loss (Rural Area) ... 209
xii
E2Edelay ... 214
Figure 6.7 Variation of Voice Application QoS Metric in relation to E2Edelay and Packet loss ... 214
Figure 6.8 Variation of Voice Application QoS Metric in relation to Packet loss and Jitter ... 214
Figure 6.9 VC Application QoS Metric ... 218
Figure 6.10 VS Application QoS Metric... 218
Figure 6.11 Application Significance ... 218
Figure 6.12 Profiled Application QoS Metric ... 218
Figure 6.13 Membership Functions for RAN QoS Metric ... 222
Figure 6.14 Membership Function for the Network Configuration QoS Metric .... 225
Figure 6.15 Performance Evaluation of Network Configuration ... 230
Figure 6.16 Performance Comparison ... 232
Figure 6.17 Performance Comparison of different Settings ... 232
Figure 6.18 Comparison of QoS and QoE Value ... 233
Figure 6.19 Comparison of DWQEM and FLQEM Metric Values with QoE Values ... 235
xiii
LIST OF TABLES
Table 2.1 Development of 2G Technologies ... 20
Table 2.2 CDMA2000 EV-DO Specifications... 24
Table 2.3 LTE UE Categories ... 28
Table 2.4 Network Ranking using Fuzzy TOPSIS Method ... 53
Table 2.5 E-model Details... 60
Table 3.1 ITU-T REC. Y.541 QoS Values ... 73
Table 3.2 Packet loss in different Cellular Networks ... 74
Table 3.3 Mean Delay Variation in different Cellular Networks... 74
Table 3.4 UMTS RLC Layer Parameter Details ... 77
Table 3.5 QoS Class Configuration for different Applications... 78
Table 3.6 Uplink and Downlink Configuration ... 79
Table 3.7 DCH Channel Factors ... 80
Table 3.8 WIMAX Service Class Parameters ... 80
Table 3.9 WiMAX Profile Configuration ... 81
Table 3.10 WLAN Parameters ... 81
Table 3.11 LTE Profile Configuration ... 81
Table 3.12 QoS Parameters for VS Clients ... 88
Table 3.13 Impact of Increased Users on Packet loss ... 92
Table 3.14 Impact of VS Clients on the Performance of Voice Clients ... 94
Table 3.15 Packet loss for VS Client in the Presence of different Number of Voice Clients ... 94
Table 3.16 Effect of different Voice Codec on the QoS Parameters ... 96
Table 3.17 Video and Voice Application Configuration ... 97
Table 3.18 MOS and R Factor Analysis for Voice Calls in the UMTS Network ... 100
Table 3.19 Call-by-call Analysis in the UMTS Network ... 100
Table 3.20 Context-based Ranges for each Application ... 101
Table 4.1 Weights for different QoS Parameters ... 112
Table 4.2 Context-based Ranges ... 113
Table 4.3 Simulation Parameters for the UMTS Network ... 117
Table 4.4 Streaming Trace Specification of H.263 and MPEG-4... 118
xiv
Table 4.6 VC Specifications ... 123
Table 4.7 Packet loss for Streaming Client in the Presence of different Number of Voice Clients ... 126
Table 4.8 Packet loss for different Applications ... 126
Table 4.9 Data Analysis for LTE Network ... 127
Table 4.10 Simulation Results for RAS Clusters – UAS Cluster (Ethernet) Conference ... 129
Table 4.11 Voice Conferencing Data Analysis ... 134
Table 4.12 Interpretation of QoS Metric Values ... 135
Table 4.13 QoS Metrics from Analysis of Voice Conferencing ... 136
Table 4.14 QoS-related Parameter Values for Mixed Traffic ... 140
Table 4.15 QoS Metric Values for Mixed Traffic... 140
Table 4.16 QoS Metrics for LTE Traffic ... 145
Table 4.17 Comparisons of QoS Metrics for LTE and UMTS Network ... 145
Table 4.18 QoS Analysis of VC Performance ... 147
Table 4.19 QoS Analysis of Voice Conferencing ... 149
Table 4.20 QoS Analysis of different RANs ... 153
Table 5.1 Example of Application Weight Calculation ... 158
Table 5.2 A FAHP-based Pair-wise Comparison Importance Scale... 164
Table 5.3 Pair-wise Comparisons for QoS-related Parameters of Voice Application ... 165
Table 5.4 Pair-wise Comparisons for QoS-related Parameters of VC Application ... 166
Table 5.5 Pair-wise Comparisons for QoS-related parameters of VS Application 167 Table 5.6 Pair-wise Comparison Matrix for different Applications ... 168
Table 5.7 FAHP-based Weights for QoS-related Parameters ... 174
Table 5.8 VC Application Parameters ... 178
Table 5.9 Voice Application Parameters ... 178
Table 5.10 Voice Application Data for the First Phase of Simulations ... 185
Table 5.11 QoS Metrics for Voice Application in the First Phase of Simulations ... 185
Table 5.12 Data Analysis of VC Application in the First Phase of Simulations .. 186
xv
Table 5.14 Voice Application Data for the Second Phase of Simulations... 187
Table 5.15 QoS Metrics for Voice Application in the Second Phase of Simulations ... 187
Table 5.16 Data Analysis of VC Application in the Second Phase of Simulations188 Table 5.17 QoS Metrics for VC Application in the Second Phase of Simulations ... 188
Table 5.18 QoS Analysis of different RANs ... 192
Table 5.19 QoS Metrics for Mixed Traffic ... 195
Table 6.1 Universe of Discourse for VC Application ... 203
Table 6.2 Universe of Discourse for Voice Application ... 203
Table 6.3 Universe of Discourse for VS Application ... 203
Table 6.4 Membership Functions for Application QoS Metric ... 205
Table 6.5 Membership Functions for Voice Application ... 206
Table 6.6 Membership Functions for VC ... 207
Table 6.7 Membership Functions for VS Application ... 208
Table 6.8 R Factor, Mean Opinion Score and Satisfaction ... 212
Table 6.9 Conditions for Voice Application QoS Level ... 213
TABLE 6.10 Conditions for VS Application QoS Level ... 215
Table 6.11 Membership Functions for Application Significance Parameter ... 217
Table 6.12 Conditions for Profiled Application QoS Level ... 219
Table 6.13 Membership Functions for Network RAN QoS Metric ... 221
Table 6.14 Conditions for RAN QoS Level ... 223
Table 6.15 Membership Functions for Network Configuration QoS Metric ... 225
Table 6.16 Conditions for Network Configuration QoS Level ... 226
Table 6.17 Network Settings ... 228
Table 6.18 QoS Analysis of Voice Application ... 228
Table 6.19 QoS Analysis of VC Application ... 229
Table 6.20 QoS Analysis of VS Application ... 229
Table 6.21 Performance Evaluation with the Newly-planned Settings ... 231
Table 6.22 QoS Metrics for Mixed Traffic ... 234
xvi
Acronyms
3GPP Third Generation Partnership Programme
1G First generation
2G Second generation
3G Third Generation
4G Fourth Generation
AHP Analytical Hierarchy Process ANS Access Network Selection ASN Access Service Network
ASN-GW ASN Gateway
AMPS Advanced Mobile Phone System AMR Adaptive Multi-Rate
APN Access Point Name
AM Acknowledged Mode
BS Base Station
BAS Basic Access Signal
BE Best Effort
CA Carrier Aggregation
CoS Class of Service
CDMA Code Division Multiple Access CDMA2000 Code Division Multiple Access 2000
CCN Common Core Network
CPC Continuous Packet Connectivity CFM Context Fusion Module
CS Circuit-Switched
CPC Continuous Packet Connectivity CSN Connectivity Service Network
CN Core network
DC-HSPA+ DCF
DIFS
Dual Carrier HSPA Evolved Distributed Coordination Function DCF Interframe Space
xvii DS3 Digital Signal 3
DSSS Direct-Sequence Spread Spectrum DSL Digital subscriber line
DFS Dynamic Frequency Selection DHCP Dynamic Host Control Protocol DFTS Discrete Fourier Transform Spread
DFTS-OFDM
DFTS Orthogonal Frequency Division Multiplexing DWQEM Dynamic Weight based QoS Evaluation Method ELECTRE Elimination and Choice Translating Reality EDGE Enhanced Data rates for GSM Evolution
EPC Evolved Packet Core
EPS Evolved Packet System EV-DO Evolution-Data Optimized EV-DV Evolution- Data and Voice
E-UTRAN Evolved UMTS Terrestrial Radio Access Network ertPS extended real-time Polling Service
EAP Extensible Authentication Protocol E2Edelay End-to-End Delay
FAHP Fuzzy Analytical Hierarchy Process FDD Frequency Division Duplex
FLC Fuzzy Logic Controller FIS Fuzzy Inference System FTP File Transfer Protocol
FL Fuzzy Logic
FWQEM Fixed Weight QoS Evaluation Method
FR Frame Rate
GBR Guaranteed Bit Rate
GGSNs Gateway GPRS Support Nodes GMSK Gaussian Minimum Shift Keying GPRS General Packet Radio Service
GAs Genetic Algorithms
xviii GSM Global System for Mobile Communications
GSM FER GSM Frame Erasure Rate
GoS Grade of Service
GoP Group of Pictures
GRA Grey Relational Analysis
HSDPA High-Speed Downlink Packet Access HWNs Heterogeneous Wireless Networks HSUPA High-Speed Uplink Packet Access HDMI High-Definition Multimedia Interface
HA Home Agent
HRM Handover and Resource Manager
HSPA+ HSPA Evolved
HSS Home Subscriber Server
iDEN Integrated Digital Enhanced Network ITU International Telecommunication Union
IEEE The Institute of Electrical and Electronics Engineers
IP Internet Protocol
IPTV Internet Protocol Television IMS IP Multimedia Subsystem
JTACS Japanese Total Access Communication System JAC Joint Admission Control
JSC Joint Scheduling Control LANs Local Area Networks
LTE Long Term Evolution
MATLAB Matrix Laboratory MAC Media Access Control
ME Mobile Equipment
MOS Mean Opinion Score
msec Milliseconds
MIP Mobile Internet Protocol MMR Mobile Multi-hop Relay MSCs Mobile Switching Centers
xix MME Mobility Management Entity
MRW Move Receiving Window
MADM Multi-attribute Decision Making MCDM Multi-criteria Decision Making MMS Multimedia Messaging Service MIMO Multiple-Input Multiple-Output NDM Network Discovery Module nrtPS non-real-time Polling Service NMT Nordic Mobile Telephone NLoS Non-Line of Sight
non-GBR non-Guaranteed Bit Rate
PS Packet-Switched
PDN Packet Data Network
PDG Packet Data Gateway
PingER Ping End-to-end Reporting
PCRF Policy Control and Charging Rules Function PLMN Public Land Mobile Network
PoC Push-to-Talk over Cellular PDN-GW Packet Data Network Gateway PHY Physical Characteristics
OFDM Orthogonal Frequency-Division Multiplexing OPNET Optimized Network Engineering Tool
QoE Quality of Experience QoS Quality of Service
QAM Quadrature Amplitude Modulation RABs Radio Access Bearers
RNC Radio Network Controller
RF Radio Frequency
rtPS real-time Polling Service RAN Radio Access Network
RTT Radio Transmission Technology
RAS Rural Area Segment
xx
RLC Radio Link Layer
RSS Received Signal Strength
RM Resource Manager
RTMM Real-time Monitoring Module RTP Real-time Protocol
RNS Radio Network Subsystem
S-GW Serving Gateway
SIP Session Initiation Protocol
SS Subscriber Station
TDD Time Division Duplex
TDMA Time Division Multiple Access TACS Total Access Communication System
TOPSIS Total Order Preference by Similarity to the Ideal Solution
TFN Triangular Fuzzy Numbers
TD-SCDMA Time Division - Synchronous Code Division Multiple Access
TPC Transmission Power Control TCP Transmission Control Protocol TTI Transfer Time Interval
TM Transparent Mode
USIM UMTS Service Identity Module
UM Unacknowledged Mode
UMTS Universal Mobile Telecommunications System UTRAN UMTS Terrestrial Access Network
USB Universal Serial Bus UGS Unsolicited Grant Service
UE User Equipment
UAS Urban Area Segment
VC Video conferencing
VHO Vertical Handover
VDC Virtual Domain Controller VoIP Voice over Internet Protocol
xxi
VS Video streaming
WCDMA Wideband Code Division Multiple Access WiFi Wireless Fidelity
WiMAX Worldwide Interoperability for Microwave Access WLAN Wireless Local Area Network
WMAN Wireless Metropolitan Area Neatwork WWAN Wireless Wide Area Network
WG Working Group
1
1
Introduction
The advancement and proliferation of modern wireless and cellular technologies have changed the way people work and communicate. By 2018, the mobile data traffic is expected to reach 15.9 exabytes per month, and 69 percent of this will consist of video traffic. There will be over 10 billion mobile-connected devices by 2018, which will exceed the world’s expected population at that time [1]. To deal with this growing number of devices and this massive increase of traffic, the wireless networks are moving towards an all-heterogeneous architecture.
A heterogeneous communication network provides transparent and self-configurable services across Wireless Local Area Networks (WLANs), Wireless Metropolitan Area Networks (WMANs), and Wireless Wide Area Networks (WWANs). Primarily, heterogeneous networks were anticipated as an integration of IEEE 802.11 WLANs and various cellular technologies, with mobile WiMAX as the major player in the middle. However, LTE-advance has added one more new technology to the picture, which would play a crucial role in this integrated architecture, forming the 4th Generation (4G) or next-generation of wireless networks. The heterogeneous wireless access, the exclusive all IP-based architecture and the advanced mobility support are the key drivers of this Generation [2].
All the technologies in a heterogeneous network pose the characteristics that complement each other [3]. 3G and 2G-based cellular communication technologies are well-known for their wide area coverage, complete mobility and roaming ability. However, traditionally these technologies offer low- bandwidth and expensive data traffic solutions [4]. In response to overcome the limitations of the conventional cellular technologies, LTE has been developed. On the other hand, WLANs provide high data rate at low-cost, but with limited coverage, whereas WiMAX delivers last mile mobile broadband access and backhaul for WLANs [5].
2 The heterogeneous-based 4G wireless networks will offer a number of advantages for both users and network operators [6]. The users will benefit from the vibrant coverage and capacity, as well as an extensive number of available resources, will allow them to connect seamlessly to the best available access technology. On the other hand, the network operators will benefit from the lower cost and the efficient usage of the network resources.
1.1
Problem Statement
The communication technologies present in a heterogeneous network have different characteristics. These technologies have their offered bandwidths, coverage area, and operating frequencies. Their QoS characteristics, such as delay, throughput, and packet loss, as well as usage and implementation costs also differ from each other. As a result, the adaptation of heterogeneous network-based architecture for the provision of different applications especially multimedia applications faces significant challenges. Among these challenges, QoS-related issues such as the effective QoS evaluation, management, and monitoring still top the list [7].
Managing QoS for video or voice applications over heterogeneous networks is a challenging task. A research from Nemertes shows that the companies invest a significant amount of their budget to manage VoIP applications over these network architectures. For small enterprises, the annual costs range from $25,000, and for global enterprises this cost is around $2 million [8]. Therefore, the enterprises need to dedicate a lot of their effort to ensure service quality at every level of the network. System downtime is another challenge for businesses, which could often happen due to poor network management and monitoring. According to Gartner research, the hourly cost of system downtime for large enterprises was $42,000, with a typical business experiencing an average 87 hours of downtime a year [9]. As a result, the QoS of any service-based network should be monitored, managed, and evaluated on an ongoing basis.
The methods for QoS evaluation of heterogeneous wireless networks have been extensively studied. The motivations for these studies can be categorised as: Access Network Selection (ANS), Joint Admission Control (JAC), Joint Scheduling Control (JSC), and Vertical Handover (VHO) in heterogeneous networks. These studies mainly focus on two aspects. Firstly, the QoS evaluation of a single application or a
3 single radio access network in a heterogeneous environment to be able to handover to a better network. Secondly, the strategies to maintain the QoS of the current network while new call admission.
Most of these studies take into account the effects of a single access network on application performance rather than considering the impacts of the access networks on the other side of the connection. To measure the QoS in a heterogeneous environment, the conventional methods do not consider the performance of all the applications running on a network. For example, if there are voice and video conferencing applications running on a UMTS network, these methods do not include the performance analysis of both of these applications to quantify the network QoS. In addition, there is no unified metric to quantify the QoS of a network, which considers the performance of all the access networks present in it. For example, in a heterogeneous environment, there are three access networks, such as UMTS, WiMAX, and LTE. At present, no unified metric can represent the performance of this whole configuration using the QoS-related parameters of these access networks.
Many previous works in this context have also analysed traffic characteristics to recommend QoS evaluation processes for heterogeneous networks. However, precise evaluation of the overall characteristics of such network traffics is a challenging task. The presence of different types of communications technologies and a varying number of users, make that evaluation even more complex. The same user scenario can suggest varying performance results based on the measurement of packet loss and end-to-end delay. For example, with twenty voice clients and one streaming client, in some network, the end-to-end delay of voice calls shows an acceptable value. However, in terms of packet loss, the voice calls do not achieve an acceptable performance value for the same number of users [10]. Therefore, in some cases, even though, the end-to-end delay may be at an acceptable level for some applications, packet loss may simply be too high. In addition, the effects of different communication technologies on the performance of various applications, say, voice and video, must be accounted for in an efficient and methodical manner. In such situations, a unified QoS metric that would quantify the performance of the whole network configuration is helpful rather than analyse the resultant value of each QoS parameter separately.
4 The industrialised world has deployed several heterogeneous network-based socioeconomic service models such as ICTPD in New Zealand, Video conferencing (VC)-based distance education model in Alberta [11]. This type of network-oriented education and health service models can benefit the developing countries as they lack physical resources. For instance, the number of hospital beds in these countries is few in number, just fractionally more than two per one thousand people [12]. However, the QoS level of these models would vary between a developed and developing country. This is because the QoS parameters related to these models such as technological settings, numbers of users, the environmental settings, and user expectations are dynamic in nature. As a result, it is hard to assess the performance of such model prior to deployment [13]. The available studies in the literature in relation to QoS evaluation of such models have ignored this aspect. A unified QoS metric in this situation can help to measure the overall performance and facilitate better design and planning.
To evaluate the QoS of any heterogeneous network, the available studies have ranked each access network by combining different QoS metrics. The most common parameters, which are considered during this ranking process, are mainly service, network, and user related. For instance, Received Signal Strength (RSS), type of the service (e.g., conversational, streaming, interactive, background), minimum bandwidth, end-to-end delay, throughput, packet loss, bit error rate, cost, transmit power, traffic load, current battery status of the mobile terminal, and the user’s preferences. To combine these parameters into a single value, at first, a weight is assigned to each of these parameters according to its relative importance.
The weights are both subjective and objective in nature. For example, the importance of network-related parameters such as RSS and bandwidth are objective in nature. Application-related parameters such as end-to-end delay, packet loss, and jitter seems objective in nature, some studies reveal that they could be subjective in nature too. For example, a study conducted in Tanzania [14] shows that to evaluate the quality of a network, the users give moderate importance to end-to-end delay over packet loss. Another research study is conducted by the European Telecommunication Standards Institute (ETSI) [15], which reveals that the users give strong importance to end-to-end delay over packet loss. Therefore, the importance of
5 application parameters can vary based on the contexts, for example, between home and an industrial environment or between developed and developing countries. The primary issue with the conventional weight calculation methods is that the weights have been assigned to QoS-related parameters in each application according to separate objective functions, and the context-based importance of these parameters has been ignored. Additionally, the application significance is not considered in these methods. However, same as the QoS-related parameters, the importance of any application can also vary with the changing context. For instance, an application for the education service would have more significance than an application for the entertainment service. Without considering this information, the weights will not reflect the proper importance attached to the considered parameter, application, or network.
1.2
Proposed Solutions
The objective of this thesis is to improve the QoS evaluation, management, and monitoring approach of heterogeneous networks. Even though, there are various methods studied in the literature in these relations, a comprehensive method, which can conduct these tasks, is still an ongoing research issue [16]. Therefore, the primary goal of this thesis is to derive a unified metric that will quantify the end-to-end QoS of a heterogeneous network configuration. This unified metric can help the network operators to design fault-tolerant systems and improve network and service quality through proper investigation, monitoring, and management of the systems. For instance, if a network operator wants to deploy a health-service centric network in a certain rural area he needs to consider all the relevant factors such as the most suitable technologies, the expected user, and traffic load in pick and off pick hours etc. The proposed QoS monitoring and management method can help the operators in such cases by facilitating the QoS level assessment before the implementation of that particular system.
To achieve this goal, in this thesis, the concept of unified metric measurement function for network QoS evaluation is introduced. This function considers all the relevant performance-related parameters to quantify the network and application QoS with a single numerical value. To implement this function, a progressive approach is adopted. At first, this approach uses a simple fixed weight-based method, which is
6 suitable for comparatively simple networks, then moves to a more complex dynamic weight-based method, and finally makes use of the concepts arising from fuzzy logic to take the network performance uncertainty into picture. This methodical approach considers the significance of the QoS-related parameters, the available network-based applications, and the available Radio Access Networks (RANs) to characterise the network performance with a set of three integrated QoS metrics. The first metric denotes the performance of each available application in the network, the second one determines the performance of each radio access network present in the network, and the third one characterise the QoS level of the entire network configuration.
The fixed weight-based method uses a performance related significant-based policy for the weight assignment of QoS-related parameters and an equal weight-based policy for application and networks. This method is suitable for simple networks with relatively fixed applications and technologies. However, it is unable to gather the changing dynamics of a more complex network. For example, if one of the applications is not present in a certain network, the weights will be subject to change. As a result, using the fixed weight-based method, it would be difficult to recalculate these weights. To make the weight calculation method more sophisticated and bring the context-based information into the picture, the dynamic weight-based evaluation is applied, which uses Fuzzy Analytical Hierarchy Process (FAHP) with extent analysis approach. The advantage of using FAHP is that it can combine several policies together while assigning weights. For instance, to determine the weights for any application in the network, the significance of that application relevant to usage purpose and the number of users in that application, these two criteria can be combined. Although, the dynamic weight-based evaluation can consider the active changes of the network, it has some limitations. For instance, it cannot capture the underlying uncertainty of network dynamics. In this relation, the concepts of fuzzy logic are adapted for further enhancement of the analysis method. It is noticeable that the more comprehensive the method is the more accurate and efficient the results would be however, with a higher implementation cost.
To evaluate QoS of any application or network, it is crucial to determine benchmarks for the relevant parameters. However, these benchmarks could be subjective and diverse in nature as stated in the previous section. Most current methods use the objective benchmarks of these parameters. To fill this gap, in this thesis, a
context-7 based analysis is applied to determine a range of benchmarks for these parameters rather than choosing a fixed baseline. To define these ranges, various recommendations from the available literature have been analysed. For example, different benchmark ranges of packet loss for voice application have been chosen for an urban and a rural environment based on the recommendations from Cisco, ITU, and other available studies.
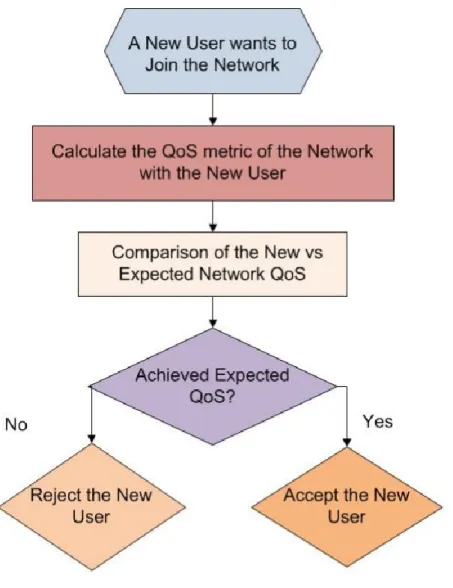
This unified metric can make the vertical handover process and call admission control algorithms to be more efficient as well. The VHO process has three phases; these are the system discovery phase, the decision phase, and the execution phase [17, 18]. In the system discovery phase, usually the available access networks are ranked according to a QoS value, which is calculated using several parameters. However, the conventional calculation methods do not calculate the QoS value based on the performance of all the applications present in a network. They are usually interested in the single application of use. In call admission control algorithms, a QoS value is calculated for the candidate network before entry of a new user to estimate the impact of the new load on the existing network QoS. However, this value is calculated based on the parameters of the application, which the new user is going to use, and its impact on the performance of other applications are overlooked. The RAN QoS metric, which are derived using the proposed methods in this thesis, can deal with such limitations as the metric is derived based on the performance of all the active applications in the network. Using the application and radio access network QoS metric, it is possible to classify networks for their suitability in providing specific services. As a result, any network can be categorised as education or health service-oriented network, and so on. In this way, the new users can be admitted into the networks according to their service requirement.
This methodical approach is particularly useful in order to combine different configuration settings, such as various technologies supporting several applications. Therefore, it can quantify the performance of heterogeneous network-based service models by a unified QoS metric. This approach is also useful when some specific network-based service models are re-deployed from one region to another. Each area has its unique service requirements and technology availability. As a result, the service model, which demonstrates better performance in one context, is not necessarily going to have the same outcomes in another region. In such
8 circumstances, by applying this approach, it is possible to compare the resultant QoS level of any network-based service model with the expected one.
The efficiency and effectiveness of the proposed approach are assessed through a diverse range of simulation studies. The simulation studies have been categorised in the following fashion throughout the thesis:
1. UMTS based scenarios with different applications and traffic load
2. UMTS-WiMAX-based scenarios with different applications and traffic load 3. UMTS-WiMAX-WLAN based scenarios with different applications and traffic load
4. LTE based scenarios with different applications and traffic load
5. UMTS-LTE-WLAN based scenarios with different applications and traffic load
The reason behind this categorisation is to facilitate the performance comparisons of different technology, application, and traffic situations. For example, a set of simulation results of UMTS network have been compared with the set of results from LTE network. The simulation results indicate that the designed methodology facilitates the QoS evaluation, management, and monitoring of network configuration and applications running on them in a more efficient manner. The simulation studies also show that using the unified metrics, it is possible to choose a suitable network configuration for a particular application or service from among the range of available network configurations under investigation and classify them for their suitability to provide some specific services.
1.3
Thesis Outline
The remaining of the thesis is organised as follows:
Chapter 2 outlines the background and motivations of this thesis. This chapter presents the related works relevant to the major components of this work. It first gives an overview of the current states of the art of wireless and cellular technologies followed by the QoS requirement analysis of various communication technologies in terms of different network-based applications. It then discusses the current solutions and their existing gaps for QoS evaluation in heterogeneous networks. Then it presents a detailed analysis of fuzzy logic in relation to QoS analysis. Later in this chapter, the multi-criteria decision-making algorithms are discussed, which are
9 applied in the proposed QoS evaluation methodology. The chapter also presents a detailed discussion on some QoS assessment tools such as E-model and illustrates the investigation results for selecting an appropriate simulation tool for this thesis.
Chapter 3 describes the idea of application-based QoS evaluation in heterogeneous networks. It also introduces the concepts of unified QoS metrics. Detailed simulation studies are carried out to investigate the impact of different environmental and technological factors on the performance of network-based applications. The simulations are conducted using OPNET software. The studies also take into account other factors such as the number of active users in the network and the presence of diverse traffics. Some analyses are also conducted to disclose the impact of dynamic QoS changes on the user perception or Quality of Experience (QoE). The results collected in this chapter are used to identify the crucial performance parameters for each application and define the acceptable context-based ranges for these parameters. These parameters and the ranges are used in the later chapters in designing the proposed application-based QoS evaluation approach.
Chapter 4 introduces a novel approach for QoS analysis of heterogeneous networks referred to as fixed weight-based QoS evaluation. In this method, fixed weights are assigned to the QoS-related parameters of a network-based application, based on their importance. A fixed weight is also attached to the applications and the radio access networks present in a network configuration using an equal importance policy. An equal importance policy means an equal weight is allocated to each of these entities. Then three sets of QoS metrics are calculated; these are the application QoS metric, the radio access network QoS metric, and the network configuration QoS metric. As the names suggest, the application QoS metric represents the performance of each application present in a network. The radio access network QoS metric or access network QoS metric characterises the performance metric for each access network present in the network. Finally, the network configuration metric or the configuration metric denotes the performance of the whole network configuration. Diverse ranges of heterogeneous network-based simulation scenarios are designed using the background case studies to evaluate the performance of the proposed method. The communication technologies, which are used in simulations, are IEEE 802.11 family, WiMAX, UMTS, and LTE. The detailed result analysis is also presented.
10
Chapter 5 designs a dynamic weight-based evaluation method for the further enhancement of the QoS analysis method. The idea behind this approach is to consider the context-based information while weight calculation. For instance, a health service-related video conferencing session would have a higher significance than an entertainment movie. This weight assignment is implemented using the fuzzy-based analytical hierarchy process. Detailed simulation studies are carried out to evaluate the performance of this method. A comprehensive result analysis is presented, and the performance is also compared to other available methods in the literature and the fixed weight-based method presented in Chapter 4.
Chapter 6 introduces an entirely new evaluation method based on the fuzzy logic concepts. The importance and the acceptable values of the key QoS-related parameters which are identified in Chapter 3 can change based on the user and network contexts. For instance, the acceptable values of these parameters may vary between a developing country and an industrialised one. In addition, the key QoS evaluation parameters can also differ from a multimedia to a non-multimedia network. To deal with these uncertainties, fuzzy logic offers several accepted solutions. The proposed QoS evaluation method is further enhanced by incorporating techniques motivated by such solutions. The results are analysed and compared with the previously proposed QoS assessment methods.
Chapter 7provides a summary of this thesis. This chapter mainly discusses the way this research has been developed throughout the end and highlights its contributions. Finally, the potential future directions for this research are illustrated.
11
2
Background and Motivations
This chapter presents the background and motivations of this thesis. The aims and objectives of this chapter are to find the existing gaps in the available research work relevant to QoS analysis in heterogeneous networks. This review will also help to set up the groundwork for designing a methodical approach for QoS evaluation in this context. The current states of the art of wireless and cellular technologies are analysed in Section 2.1. In Section 2.2, various interworking architectures in heterogeneous networks are analysed. The QoS requirements of various technologies in terms of different network-based applications are illustrated in Section 2.3. The current solutions, which are proposed for QoS analysis of heterogeneous networks, are evaluated in Section 2.4. In Section 2.5, a detailed analysis of fuzzy logic in relation to QoS analysis is presented. In Section 2.6, some multi-criteria decision-making algorithms are discussed, which are applied in the QoS evaluation methodology of this thesis. Section 2.7 presents the description of the available QoS and QoE measurement tools such as E-model. Section 2.8 presents a detailed investigation to choose an appropriate simulation tool for this thesis. Finally, Section 2.9 concludes this chapter.
2.1
Wireless Communication Technologies
In this Section, an overview of the current states of the art of wireless technologies is presented.
2.1.1
Wireless Local Area Networks (WLANs)
In 1997, the Institute of Electrical and Electronics Engineers (IEEE) released Wireless Local Area Network (WLAN) standard [19]. The common standards for WLANs are 802.11a, 802.11b, 802.11g, 802.11n, 802.11ac, and 802.11ad. The available spectrums for WLANs are the industrial, scientific, and medical bands, 2.4 GHz to 5 GHz [20]. The Medium Access Control (MAC) and physical characteristics (PHY) for WLANs are specified in 802.11 standards. The MAC layer is the same
12 for all the standards; however, the physical layer differs. The physical layer has three different specifications; these are Frequency Hopping Spread Spectrum (FHSS), Direct Sequence Spread Spectrum (DSSS) and Infrared (IR). 802.11 WLANs are suitable for forming a local wireless community and share resources within them. They can be useful in creating local sharing models in health, commerce, and education. However, they have a limitation in the case of wider communication. 802.11b is the most popular as it is the cheapest one, and it has the best signal range. The frequency range it uses is between 2.4 GHz-2.4835 GHz [21]. It can support data rates of 1, 2, 5.5, and 11 Mbps. 802.11b uses DSSS mechanism for the physical layer. IEEE 802.11a uses orthogonal frequency-division multiplexing (OFDM) modulation technique, which helps to reduce multipath interferences. It operates in the 5 GHz band with up to 54 Mbps data rate within a range of 10 meters.
802.11g is an extension of 802.11b that uses 2.4 GHz and supports a data rate up to 54 Mbps. [22]. These WLAN standards do not have QoS support. As a result, 802.11e has come to fill that gap. 802.11e applies the priority mechanism to support QoS. Each type of data traffic is assigned a priority based on their QoS requirements. 802.11n is proposed to achieve higher throughput [23]. The breakthrough technologies for higher data throughput in this standard are Multiple Input Multiple Output (MIMO), frame aggregation, and channel bonding [24]. MIMO splits the data over a number of data stream through separate antennas while sending, and the receiver receives data through corresponding multiple antennas. Frame aggregation is used to reduce the physical layer overhead by reassembling traditional frames into a “super” frame. In this case, the mandatory break between each of the traditional frame knows as DCF (Distributed Coordination Function) Interframe Space (DIFS) occurs between each “super” frame [25]. Thirdly, the channel bonding is applied to combine two standard 20 MHz channels to a wideband 40 MHz channel. As a result, 802.11n devices can use twice the channel width than other standards available in 802.11 standard family. IEEE 802.11n allows for up to four data streams. However, the maximum performance of IEEE 802.11n is only possible in an IEEE 802.11n only network. If the network is mixed with IEEE 802.11a/b/g devices, the performance will be significantly lower.
13 IEEE 802.11ac is an enhancement of 802.11n standard to support very high data throughput in the 5 GHz bands. It adds 80 MHz, 160 MHz and non-contiguous 160 MHz channel bandwidth [26]. The other features added for throughput enhancement is multi-user MIMO (MU-MIMO). A more enhanced data coding scheme (256-QAM) is another key feature of this technology. IEEE 802.11ac MIMO works with a maximum of eight data streams to a single user. IEEE 802.11ad is another Gigabit standard, which operates in the unlicensed 60 GHz band [27]. It supports very high throughput up to 7 Gbit/s. Poorer path loss is one of the challenges in this standard. It uses some new technologies such as directional antennas and beamforming in order to improve link quality. Chanel modification is also added to address directionality and spatial reuse [26]. The primary focus of IEEE 802.11ad is personal networking. It is mainly designed to deliver wireless connections between the computer and other devices in the network, e.g. a High-Definition Multimedia Interface (HDMI) video connection to a screen or a Universal Serial Bus (USB) connection to other terminal equipment. The main objective is of this standard is to replace cables to provide connectivity between devices. However, this standard will need to co-exist with other standards such as IEEE 802.11a/b/g/n/ac for the provisioning of TCP/IP connectivity within the network and to the Internet [28].
IEEE 802.11af is mainly a regulatory standard, which intends to operate WLAN in the TV white space [29]. To identify the usable white space, IEEE 802.11af will use cognitive radio technology. This cognitive technology will be based on an authorized geolocation database. This database will provide information on which frequency, at what time and under what conditions networks may operate. 802.11h standard has emerged to reduce interference and power consumption. It involves the extension of MAC and PHY layers for dynamic frequency selection (DFS) and Transmission Power Control (TPC) [30]. IEEE 802.11i enables the security feature in 802.11 family, which was previously missing. It combines IEEE 802.11, 802.1X, and Extensible Authentication Protocol (EAP) to provide security to Wireless LANs [31]. Figure 2.1 shows different wireless standards with their frequency and data rate.
14
Figure 2.1 Frequencies and Data Rates for different Wireless LAN Standards
2.1.2
WiMAX
Worldwide Interoperability for Microwave Access (WiMAX) is the commercialization of IEEE 802.16 standard, which is also known as Wireless Metropolitan Area Neatwork (WMAN) [32]. The IEEE 802.16 working group (WG) is responsible for developing WiMAX associated standards and its amendments. It is an OFDM-MIMO based high-performance technology [20]. As this technology is open Internet model-based, therefore it enables multiple device models. It can provide broadband wireless access in both fixed and mobile environments. Because of high bandwidth, it can reduce the transmission delay for quality images. The WG’s primary interest was to develop the standard in 10-66 GHz range, but later changed to 2-11 GHz. It can operate in both licensed and unlicensed bands. The
•5 GHz
15 operating frequencies of 2.5 and 3.5 GHz require a license; however, 5.86 GHz frequency is an unlicensed band.
The coverage area of WiMAX is 30 to 50 kilometres with a data transmission rate of 100Mb/s in 20 MHz bandwidth [33]. The IEEE 802.16 has developed a series of guidelines to standardize fix and mobile broadband wireless access. WiMAX addresses the requirements of those users who want to use a broadband connection regardless of location which are not covered by the Digital Subscriber Line (DSL) and cable technologies. As a result, it is widely deployed in the regions, which have more developing countries [34]. The highest coverage it achieved is in the Asia-Pacific.
The WiMAX network has three major elements; these are Mobile Stations (MS), Access Service Network (ASN) and Connectivity Service Network (CSN). The ASN constitutes of base stations and ASN gateways. The CSN WiMAX network provides the IP connectivity and other IP core network functions. The major elements in WiMAX network constitutes of the following entities [35]:
Subscriber station (SS) /Mobile Station (MS): The Subscriber station (SS) is also termed as the Customer Premises Equipment (CPE). There are two types of SS referred to as "indoor CPE" and "outdoor CPE". Users can install the indoor CPE. This could be in the form of a dongle for using on the laptop or a computer. The outdoor CPE has a better antenna setup.
Base Station (BS): The base station provides the air to the subscriber and mobile stations. It also provides services such as mobility management in terms of handover execution and tunnel establishment. It is responsible for radio resource management, QoS policy management, traffic classification, Dynamic Host Control Protocol (DHCP) proxy, key management, session management, and multicast group management.
ASN Gateway (ASN-GW): The Access Service Network Gateway (ASN-GW) is
responsible for a layer two traffic aggregation. It is mainly responsible for intra-ASN location management and paging, radio resource management and admission control, caching of subscriber profiles and encryption keys. The ASN-GW is also responsible for the Authentication, Authorisation, and Accounting (AAA) Server client functionality, establishment and management of mobility tunnel with base stations,
16 QoS policy management, foreign agent functionality management for mobile IP, and routing to the selected Connectivity Service Network (CSN).
Home Agent (HA): The HA is located inside the CSN. It works in conjunction with
the ASN Gateway, to provide an efficient end-to-end Mobile IP solution for WiMAX network. It is as a connectivity point to provide secure roaming ensuring QoS capabilities for subscribers.
Authentication, Authorisation and Accounting Server (AAA): AAA server is
located within CSN. As the name suggested, it is responsible for subscription services.
The standardized interfaces in the WiMAX are known as Reference Points (RPs)
termed from R1 to R8 [36]. Figure 2.2 shows the WiMAX network reference model. This WMAN technology standard was first approved as the IEEE 806.16-2001 standard and was published in 2002. The microwave signals in the frequency range of 10-66 GHz have poor penetrability and rain attenuation easily affects the signals. As a result, this technology is only suitable for open areas. To make this standard work in areas with buildings 806.11a standard was published in 2003 [34].
The frequency range for 806.11a is 2-11 GHz [37]. The coverage area is up to 50 kilometres. It can operate in Non-Line of Sight (NLoS) environment and get less affected by rain. Thus, the installation cost is reduced as it requires fewer antennas. It
17 also supports mesh topology and offers QoS guarantee. In 2004, the IEEE 802.16 WG integrated the IEEE 802.16-2001 and IEEE 802.16a standard together and issued the IEEE 802.16-2004 standard. In 2012, the latest amendment to this standard is published [38]. This 802.16-2004 is referred to fixed-WiMAX as well [39].
802.16-2012 operates within 2-11 GHz and in the fixed NLoS environment. The MAC architecture supports both point-to-multipoint and mesh. The data rate it achieves is between 1-75 Mbps. It employs three kinds of physical layer technologies, which are Single carrier (SC); OFDM 256 points in fixed wireless access and OFDMA 2048 points for long distance between operator point of presence and Wireless Local Area Network. In December 2005, an amendment to the existing 806.11-2004 was completed and approved which is known as 802.16e-2005. This standard forms the basis for the nomadic and mobile applications and known as mobile WiMAX. Although, it is referred to as Mobile WIMAX, it supports fixed application scenarios as well [40]. For fixed applications, it operates within the 2 GHz-11 GHz and for mobile applications, it operates within the 2 GHz-6 GHz. IEEE 802.16 is undergoing a continuous process of development, and the following 802.16 standards are still valid (May 2011) [37]:
IEEE Std 802.16-2009 [41] IEEE Std 802.16j-2009 [42] IEEE Std 802.16h-2010 [43] IEEE Std 802.16m-2011 [44] IEEE Std 802.16k-2007 [45] IEEE Std 802.16.2-2004 [46] IEEE Std 802.16/Conformance04-2006 [47]
802.16j supports relay mode operation for 802.16 standards [48]. It is a Mobile Multi-hop Relay (MMR) network topology to increase transmission rates at the cell edge. The other ongoing projects for this technology are 802.16n for higher reliability network and 802.16p for enhancement to support machine-to-machine communication. WiMAX has the ability to interwork with satellite and terrestrial wireless existing as well as emerging technologies. It can also serve as a backbone network for WLAN hotspots for connecting to the broadband Internet. The WiMAX
18 network architecture has flexible features like interworking, roaming, and cost effectiveness. Figure 2.3 outlines characteristics of different WiMAX technologies.
2.1.3
Wireless Wide Area Network Technologies (WWANs)
Over the past two decades, cellular and wireless communication technologies have affected the way people communicate and work. Globally the cellular penetration rate is 96%, 128% of which are in developed countries and 89% in developing countries [49]. Cellular networks have started with 1G and now it is evolving towards 5G. Cellular telephone networks are one of the most important types of WWANs. Initially starting with voice services, now they are able to provide quality data services.
2.1.3.1 First generation (1G)
The first generation of cellular technology, also known as 1G used analogue technology. It was mainly voice communication-based and did not allow roaming. It first started in Japan in 1979. The major 1G standards are Advanced Mobile Phone System (AMPS), Total Access Communication System (TACS), Japanese Total Access Communication System (JTACS), and Nordic Mobile Telephone (NMT). The speed was 2.4 Kbps.
19
2.1.3.2 Second generation (2G)
The second generation (2G) of cellular technology uses digital transmission and allows roaming between different operators. This technology was primarily designed in the late 1980s and early 1990s before the privatization of the Internet and the advent of World Wide Web (WWW) [50]. With the advent of 3G, although 2G is declining; however, the penetration of 2G is still noticeable. In 2013, the world had 56% penetration if 2G and in 2014, it had 52% penetration [51].
Global System for Mobile Communications (GSM) in Europe and Integrated Digital Enhanced Network (iDEN), IS-136 and IS-95 in North America are examples of 2G [20]. The iDEN is a proprietary technology, which is developed by Motorola. IS-136 is the technology compatible with 1G AMPS standard. This is Time Division Multiple Access (TDMA) based. IS-95 is commercialised as cdmaOne, which is developed by Qualcomm. The speciality of this technology is the use of Code Division Multiple Access (CDMA) based on direct-sequence spread spectrum (DSSS) technique instead of TDMA.
GSM has become the world’s fastest-growing communications technology of all time and the leading global mobile standard. The technical work for maintenance and development of GSM has been transferred to 3GPP in 2000. Terrestrial GSM networks now cover 90% of the world’s population in 219 different countries [52]. GSM operates with a number of frequency bands: 900 and 1800 MHz bands in Europe, Asia-Pacific, and Africa and North America and parts of Central and South America use the 850 and 1900 MHz. It uses TDMA along with Frequency Division Duplex (FDD) to distribute physical resources among multiple users. It is deployed as paired spectrum between uplink and downlink using FDD. Each Radio frequency (RF) is divided into eight TDMA time slots. In this way, eight full-rate traffic channels are multiplexed onto a single RF carrier [53]. GSM uses Gaussian Minimum Shift Keying (GMSK) modulation technique. It can support data rates and voice calls up to 9.6 Kbps. IS-136 uses TDMA and Time Division Duplex (TDD). It allows data rates up to 30 Kbps. IS-95 has two versions, which are known as IS-95A and IS-95B. IS-95A employs FDD with a channel bandwidth of 1.25-MHz for each direction and supports data speeds of up to 14.4 Kbps. IS-95B can support data speeds of up to 115 Kbps by bundling up to eight channels. Due to its data speeds,

![Figure 3.3 shows the recommended values of packet loss for different applications by three key studies [15, 154, 155]](https://thumb-us.123doks.com/thumbv2/123dok_us/10127339.2913489/92.893.194.764.176.602/figure-shows-recommended-values-packet-different-applications-studies.webp)