Calhoun: The NPS Institutional Archive
Theses and Dissertations Thesis Collection
2009-03
Remote detection of cloud base heights using
CloudSat and CALIPSO
Welliver, Elizabeth A.
Monterey, California: Naval Postgraduate School
NAVAL
POSTGRADUATE
SCHOOL
MONTEREY, CALIFORNIA
THESIS
Approved for public release; distribution is unlimited. REMOTE DETECTION OF CLOUD BASE HEIGHTS
USING CLOUDSAT AND CALIPSO
by
Elizabeth Welliver March 2009
Thesis Advisor: Philip A. Durkee
REPORT DOCUMENTATION PAGE Form Approved OMB No. 0704-0188
Public reporting burden for this collection of information is estimated to average 1 hour per response, including the time for reviewing instruction, searching existing data sources, gathering and maintaining the data needed, and completing and reviewing the collection of information. Send comments regarding this burden estimate or any other aspect of this collection of information, including suggestions for reducing this burden, to Washington headquarters Services, Directorate for Information Operations and Reports, 1215 Jefferson Davis Highway, Suite 1204, Arlington, VA 22202-4302, and to the Office of Management and Budget, Paperwork Reduction Project (0704-0188) Washington DC 20503.
1. AGENCY USE ONLY (Leave blank) 2. REPORT DATE March 2009
3. REPORT TYPE AND DATES COVERED Master’s Thesis
4. TITLE AND SUBTITLE Remote Detection of Cloud Base Heights Using CloudSat and CALIPSO
6. AUTHOR(S) Elizabeth A. Welliver
5. FUNDING NUMBERS
7. PERFORMING ORGANIZATION NAME(S) AND ADDRESS(ES) Naval Postgraduate School
Monterey, CA 93943-5000
8. PERFORMING ORGANIZATION REPORT NUMBER
9. SPONSORING /MONITORING AGENCY NAME(S) AND ADDRESS(ES) N/A
10. SPONSORING/MONITORING AGENCY REPORT NUMBER
11. SUPPLEMENTARY NOTES The views expressed in this thesis are those of the author and do not reflect the official policy or position of the Department of Defense or the U.S. Government.
12a. DISTRIBUTION / AVAILABILITY STATEMENT Approved for public release; distribution is unlimited.
12b. DISTRIBUTION CODE 13. ABSTRACT (maximum 200 words)
This thesis study focuses on the evaluation of cloud base height from a pair of space-based remote sensing systems. The first satellite, CloudSat, is a 94-GHz cloud profiling radar (CPR) utilizing a wavelength capable of penetrating thick hydrometeor layers. The second satellite, the Cloud-Aerosol Lidar and Infrared Pathfinder Satellite Observations (CALIPSO) satellite, is an active lidar designed to detect optically thin hydrometeor layers. The 2B-GEOPROF-Lidar product combines data from these two synergistic observing platforms to provide a complete profile of the vertical structure of clouds in the atmosphere. For this research, 2B-GEOPROF-Lidar cloud base height measurements were validated against cloud base height measurements from a combined suite of ground-based sensors at four Department of Energy (DOE) Atmospheric Radiation Measurement (ARM) sites. Cloud base height measurements validated within 480 meters, the vertical resolution of the CPR, were deemed accurate assessments. Differences in cloud base height exceeding 720 meters were labeled as significant outliers. Significant outliers were further investigated to find trends in radar reflectivity and cloud mask data from CloudSat and total attenuated backscatter from CALIPSO. The combined CloudSat / CALIPSO cloud base assessment proved accurate in 73% of the cases studied.
15. NUMBER OF PAGES
63 14. SUBJECT TERMS CloudSat, CALIPSO, cloud base height, remote sensing
16. PRICE CODE 17. SECURITY CLASSIFICATION OF REPORT Unclassified 18. SECURITY CLASSIFICATION OF THIS PAGE Unclassified 19. SECURITY CLASSIFICATION OF ABSTRACT Unclassified 20. LIMITATION OF ABSTRACT UU
NSN 7540-01-280-5500 Standard Form 298 (Rev. 2-89)
Approved for public release; distribution is unlimited.
REMOTE DETECTION OF CLOUD BASE HEIGHTS USING CLOUDSAT AND CALIPSO
Elizabeth A. Welliver Captain, United States Air Force B.S., United States Air Force Academy, 2002
Submitted in partial fulfillment of the requirements for the degree of
MASTER OF SCIENCE IN METEOROLOGY
from the
NAVAL POSTGRADUATE SCHOOL March 2009
Author: Elizabeth A. Welliver
Approved by: Philip A. Durkee
Thesis Advisor
Qing Wang Second Reader
Philip A. Durkee
ABSTRACT
This thesis study focuses on the evaluation of cloud base height from a pair of space-based remote sensing systems. The first satellite, CloudSat, is a 94-GHz cloud profiling radar (CPR) utilizing a wavelength capable of penetrating thick hydrometeor layers. The second satellite, the Cloud-Aerosol Lidar and Infrared Pathfinder Satellite Observations (CALIPSO) satellite, is an active lidar designed to detect optically thin hydrometeor layers. The 2B-GEOPROF-Lidar product combines data from these two synergistic observing platforms to provide a complete profile of the vertical structure of clouds in the atmosphere. For this research, 2B-GEOPROF-Lidar cloud base height measurements were validated against cloud base height measurements from a combined suite of ground-based sensors at four Department of Energy (DOE) Atmospheric Radiation Measurement (ARM) sites. Cloud base height measurements validated within 480 meters, the vertical resolution of the CPR, were deemed accurate assessments. Differences in cloud base height exceeding 720 meters were labeled as significant outliers. Significant outliers were further investigated to find trends in radar reflectivity and cloud mask data from CloudSat and total attenuated backscatter from CALIPSO. The combined CloudSat / CALIPSO cloud base assessment proved accurate in 73% of the cases studied.
TABLE OF CONTENTS
I. INTRODUCTION...1
A. THE CHALLENGE OF REMOTELY DETERMINING CLOUD BASE HEIGHT...1
B. PREVIOUS RESEARCH AND METHODS...2
C. SCOPE OF RESEARCH ...4
II. REMOTE SENSING SYSTEMS ...5
A. A-TRAIN ...5
B. CLOUDSAT ...7
1. 94-GHz Cloud Profiling Radar...7
2. Hydrometeor Detection Algorithm ...8
C. CALIPSO...9
1. CALIOP ...9
2. CALIOP Level 2 Algorithms ...10
3. Vertical Feature Mask...12
D. COMBINED CLOUDSAT / CALIPSO PRODUCT ...13
III. DATA COLLECTION AND ANALYSIS ...17
A. GROUND-TRUTH COMPARISON ...17
B. ADDITIONAL CLOUDSAT ANALYSIS ...19
C. ADDITIONAL CALIPSO ANALYSIS...22
IV. RESULTS AND FINDINGS ...25
A. OVERALL RESULTS...25
B. SOUTHERN GREAT PLAINS (SGP) RESULTS ...29
C. NORTH SLOPE ALASKA (NSA) RESULTS ...31
D. TROPICAL WEST PACIFIC - DARWIN RESULTS...33
E. TROPICAL WEST PACIFIC – MANUS RESULTS ...39
V. SUMMARY AND FUTURE RESEARCH...41
A. SUMMARY OF RESEARCH ...41
B. RECOMMENDATIONS FOR FUTURE RESEARCH...41
LIST OF REFERENCES ...43
LIST OF FIGURES
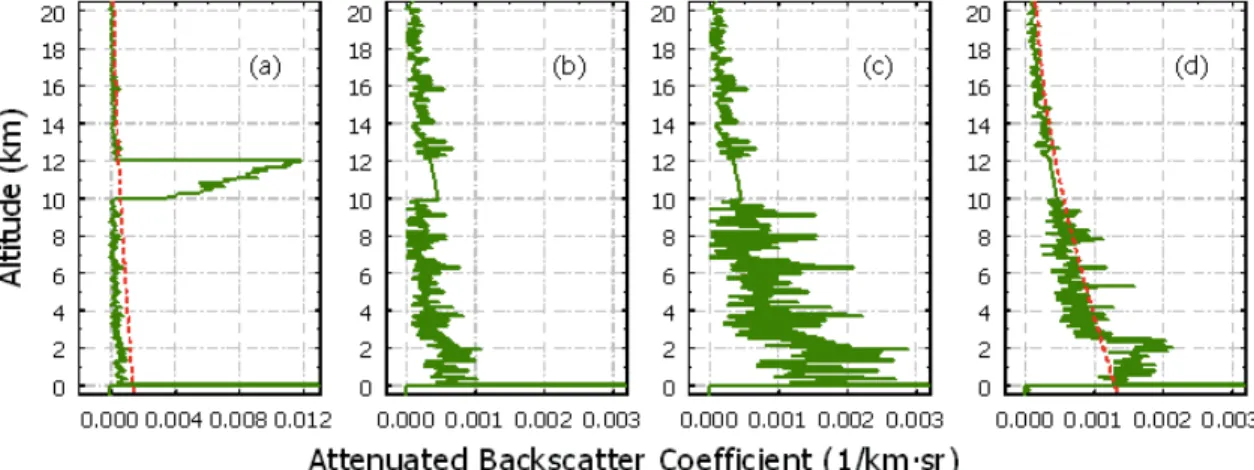
Figure 1. Conceptual drawing of A-Train satellite constellation. The Orbiting Carbon Observatory (OCO) is schedule for launch in late February 2009. Image credit: NASA (http://www.nasa.gov/images/content/112931main_a-train.jpg)...5 Figure 2. SIBYL Feature Clearing. Figure (a) shows a 5-km averaged profile with a
moderate cirrus layer overlying a weaker absorbing aerosol layer. Figure (b) and (c) show, respectively, the removal of the cirrus layer and the correction of the underlying data for the estimated cirrus attenuation. Averaging four consecutive feature cleared 5-km profiles results in the 20-km horizontal average depicted in (d). This 20-20-km average reveals the previously obscured aerosol layer. The dotted lines in (a) and (d) are the threshold lines used by SIBYL’s profile-scanning algorithm (Vaughan et al. 2002). ...11 Figure 3. Conceptual view of CPR-Lidar overlap. The diagram on the left is a plane
view of a radar footprint in blue and lidar footprint in red. The black (red) solid and dashed ellipses (circles) represent the 1 and 2 standard deviation pointing uncertainty of the radar (lidar). The diagram on the right is a vertical cross section of a radar range resolution volume. The squares represent potential lidar resolution volumes that contain hydrometeors as reported by the lidar Vertical Feature Mask (VFM) product (Mace et al. 2007b). ...14 Figure 4. Plot of 2B-GEOPROF-Lidar cloud base heights (blue ‘x’) and ARM Ground
Site cloud base heights (red squares) for SGP site on 10 October 2006. Magenta line denotes nadir of closest satellite overpass to ground site, with +/- 2 minutes of data plotted on either side of overpass. ...18 Figure 5. Plot of Radar Reflectivity from CloudSat CPR 2B-GEOPROF data, 8
October 2006 (Julian Date: 281). CloudSat’s nearest overpass to the SGP ARM site occurred at 0836 UTC (decimal hour: 8.6122). Color bar represents dBZ values. Data plotted +/- 5 minutes of overpass...20 Figure 6. Plot of the cloud mask from CloudSat CPR 2B-GEOPROF data, 8 October
2006 (Julian Date: 281). CloudSat’s nearest overpass to the SGP ARM site occurred at 0836 UTC (decimal hour: 8.6122). Increasing Cloud Mask values indicate increasing probability of cloud layer. Data plotted +/- 5 minutes of overpass...21 Figure 7. Plot of total attenuated backscatter at 532 nm detected by CALIPSO on 8
October 2006. CALIPSO’s nearest overpass to the SGP ARM site occurred at 0837 UTC (decimal hour: 8.6287). Data plotted +/- 5 minutes of overpass. ...23 Figure 8. Plot of CloudSat / CALIPSO-determined cloud base heights via the
2B-GEOPROF-Lidar product versus ground-based cloud base heights...26 Figure 9. Comparison of satellite-derived cloud base heights versus ground observation
2B-GEOPROF-Lidar product. ARM measurements from all fours sites are included in this figure. ...27 Figure 10. Comparison of CloudSat / CALIPSO 2B-GEOPROF-Lidar cloud base
heights versus ground-based assessment of cloud base height for the ARM SGP ground site. Red markers denote significant outliers (> 720 m difference). ...29 Figure 11. MODIS thermal composite image from 9 Sep 2007, 0835 UTC. Red cross
represents location of SGP ARM ground site...30 Figure 12. Comparison of CloudSat / CALIPSO 2B-GEOPROF-Lidar cloud base
heights versus ground-based assessment of cloud base height for the ARM NSA ground site. Red markers denote significant outliers (> 720 m difference). ...32 Figure 13. Initial comparison of CloudSat / CALIPSO 2B-GEOPROF-Lidar cloud base
heights versus ground-based assessment of cloud base height for the ARM TWP-Darwin ground site. Red markers denote significant outliers (> 720 m difference)...34 Figure 14. Initial comparison of CloudSat / CALIPSO 2B-GEOPROF-Lidar cloud base
heights versus ground-based assessment of cloud base height for the ARM TWP-Darwin ground site. Red markers denote significant outliers (> 720 m difference)...35 Figure 15. Total attenuated backscatter recorded by CALIPSO for precipitation event at
TWP-Darwin on 3 Mar 2007. CALIPSO’s nearest overpass to the ARM ground site occurred at 16.8952 UTC...37 Figure 16. Radar reflectivity recorded by CloudSat for precipitation event at
TWP-Darwin on 3 Mar 2007. CloudSat’s nearest overpass to the ARM ground site occurred at 16.8904 UTC. ...38 Figure 17. Comparison of CloudSat / CALIPSO 2B-GEOPROF-Lidar cloud base
heights versus ground-based assessment of cloud base height for the ARM TWP-Manus ground site. Red markers denote significant outliers (> 720 m difference)...40
LIST OF TABLES
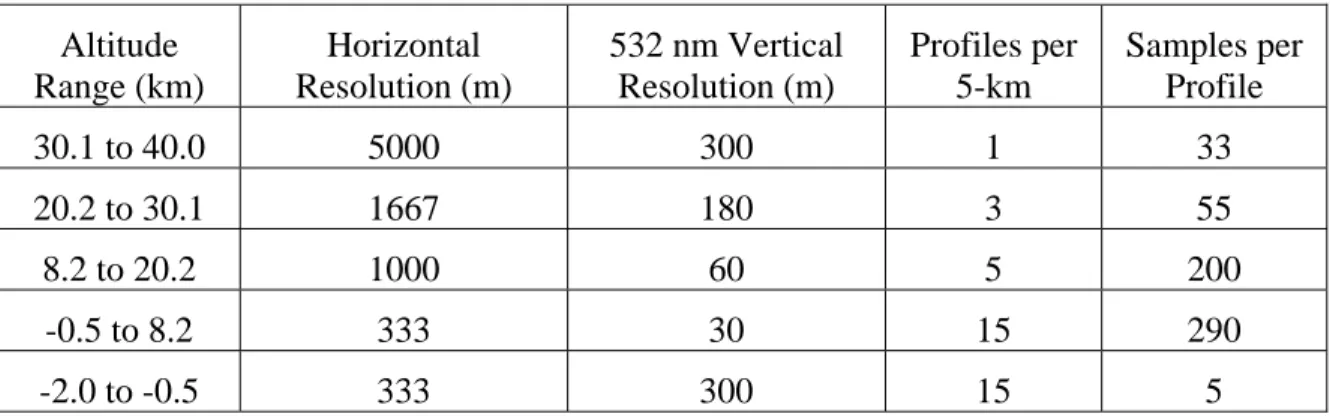
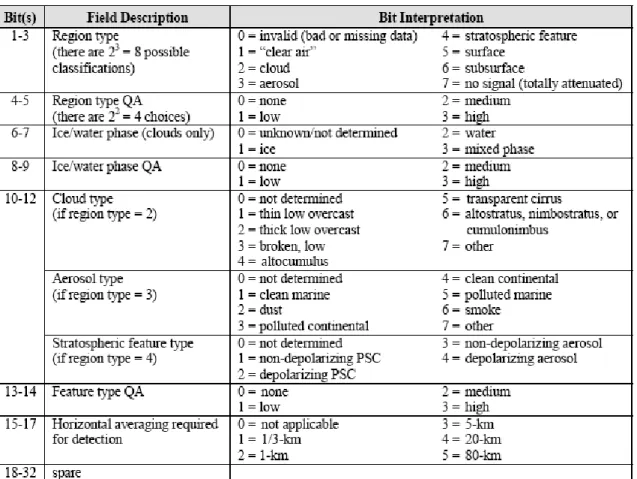
Table 1. Spatial resolution of downlinked data from CALIPSO’s CALIOP sensor (Winker et al. 2006). ...10 Table 2. Bit interpretation for the CALIPSO Vertical Feature Mask (Vaughan et al.
2004). ...12 Table 3. Supplemental observation points and distance from respective ARM ground
site. ...19 Table 4. Results of comparison of cloud base heights between the CloudSat /
THIS PAGE INTENTIONALLY LEFT BLANK
ACKNOWLEDGMENTS
I would like to thank my advisor, Dr. Philip Durkee, for his outstanding support and guidance throughout the development of this thesis. I would also like to thank Dr. Qing Wang for her support and insights as second reader. Special thanks to Lt Col Karl Pfeiffer for serving as my early sounding board and encouraging my ideas. This research could not have happened without the kind patience and support of Mary Jordan during the data collection and analysis processes. I would like to acknowledge my classmates for their support as well. Finally, and most importantly, I would like to thank my husband Terry for his unconditional love, support, and patience throughout the thesis process.
I. INTRODUCTION
A. THE CHALLENGE OF REMOTELY DETERMINING CLOUD BASE HEIGHT
The remote detection of cloud base heights is a critical topic of interest for the Department of Defense (DoD). While cloud base heights are freely available for points with a human observer present or equipped with automated observation sensors, these heights are virtually impossible to determine in remote locations. Low ceilings can severely impact operations ranging from aircraft take-off and landings to reconnaissance and surveillance missions to close air support and air assault missions. Due to the data sparseness in the highly remote, yet mission-critical operating areas of Afghanistan and Southeast Asia, accurate cloud base height analysis is necessary for both safe and successful operations. Even large areas of the United States lack consistently available and reliable ground observations, making training, weapons testing, and search and rescues missions a challenge. Accurate cloud base height assessment for these austere operating environments has the potential to drastically improve mission accomplishment.
Despite significant advances in recent years in cloud detection, identification, and modeling schemes, the correct assessment of cloud base heights remains a significant deficiency in global cloud analysis and forecasting, especially in remote areas. Previous research utilizing space-based remote sensing systems to obtain cloud base height failed to yield conclusive improvement in remote locations, primarily because the satellite sensors employed wavelengths that were not able to penetrate the entire depth of the cloud (Lhermitte 1988, Forsythe et al. 2000). However, with the April 2006 launch of the CloudSat 94-GHz Cloud Profiling Radar, and the Cloud-Aerosol Lidar and Infrared Pathfinder Observation (CALIPSO) satellite, the remote sensing of the vertical distribution and structure of hydrometeors in the atmosphere is now a reality. Specifically, accurate measurements of cloud base height are now possible from these space-based platforms, thus providing a realistic assessment of cloud base height in remote, unobserved locations.
B. PREVIOUS RESEARCH AND METHODS
Until recently, space-based cloud base height assessments have generally relied on the interpolation of available satellite imagery. For example, GOES-8 satellite-derived cloud classification combined with surface observations of cloud base height yielded positive results when surface observations reported broken or greater cloud decks (Forsythe et al. 2000). The horizontal interpolation of surface observations combined with the bispectral satellite imagery showed improvement over previous methods that relied solely on distance-weighted interpolation of surface cloud observations. However, this method struggled to accurately identify the height of mid- and high-level clouds, and fell victim to the tendency of human surface observers to report heights at “meteorologically significant” levels, thus failing to observe the exact height.
The development of millimeter wavelength radars significantly improved hydrometeor detection in clouds and precipitation over previously used centimeter wavelength radars (Lhermitte 1988). Lhermitte demonstrated that a vertically pointing 94-GHz radar provided improved observation of low-altitude, low-reflectivity clouds over the commonly used 35-GHz wavelengths. Attenuation of 94-GHz radiation is caused either by the absorption or scattering of radiative energy by hydrometeors. Through analysis of the backscattered energy by cloud particles within the Rayleigh scattering regime and the associated attenuation of radar reflectivity, accurate cloud layer detection is possible.
A cloud detection algorithm utilizing the 94-GHz frequency can provide objective estimates of cloud boundaries, both top and bottom, as well as multiple cloud layers (Clothiaux 1995). The algorithm focuses on detecting significant power signals received at the radar. The criterion for significant detection is:
Pr(mW)PPn 1.28Pn N1 2
where Pr(mW) is the power received by the radar antenna, P is the average total power,
Pn is the average noise power, and the term α(1.28Pn x N-1/2) is the minimum detectable signal based on the standard deviation of average N noise and α, the parameter adjusted
to change the criterion for cloud detection (Clothiaux 1995). The criterion for significant detection is used to create a “cloud binary mask image” from the initial radar reflectivity data. Then, in order to derive a final mask of significant hydrometeor detection, a series of filters are applied to the criterion. Although drizzle and precipitation can lead to errors in cloud base determination, the 94-GHz radar using the described detection algorithm successfully detected cloud boundaries, especially in boundary layer clouds and cirrus clouds.
The ground-based micropulse lidar (MPL) is an effective tool for the detection of hydrometeors within a column (Clouthiaux et al. 1998). A cloud detection algorithm developed for use by the MPL at the U.S. Department of Energy’s Atmospheric Radiation Measurement (ARM) Southern Great Plains (SGP) site attempted to identify all significant power returns in a vertical column of the atmosphere to determine hydrometeor distribution. This algorithm intended to accurately detect the cloud base height of optically thin clouds that frequently go undetected by the 94-GHz radar (Clothiaux et al. 1998). Power returned from clear days was used as the basis to calibrate the power returned when a cloud layer was present in the sampled column in order to optimize hydrometeor detection. The algorithm significantly improved previous methods of detecting high-level cirrus clouds.
In September 1994, NASA flew a three-wavelength backscatter lidar as part of the Lidar In-Space Technology Experiment (LITE) on board the Space Shuttle Discovery (Winker et al. 1996). LITE was the first lidar principally dedicated to atmospheric studies to fly in space. The primary objective of the LITE mission was to show that lidar technology serving as a space-based remote sensing tool could provide considerable knowledge about the vertical structure of clouds and aerosols in the atmosphere. LITE captured, for the first time, multi-layered clouds from space and detected optically thin high clouds generally blocked by low-level clouds detected by ground-based sensing systems. In fact, LITE demonstrated that despite the expected total attenuation by thick boundary layer clouds or deep convective clouds, the lidar profiles penetrated to an
altitude of 1 km or less in 70% of all cloud cases (Winker et al. 2003). This successful mission demonstrated the usefulness of lidar technology on space-based platforms and paved the way for future lidar-equipped satellite missions.
Numerous independent studies of radar and lidar remote sensing systems mention the potential advantage of combining the strengths of these two remote sensing methods to further improve hydrometeor detection and characterization (Baedi 2002; Clothiaux et al. 1995; Clothiaux et al. 2000; Lhermitte 1988). Cloud microphysical properties detected by one remote sensing method applied to another remote sensing data set can potentially resolve hydrometeor characteristics for an entire column. When spread over temporal and spatial domains, this information can provide comprehensive information about the current state of the atmosphere. The launch of the A-Train satellite constellation in 2006 presented the first opportunity for the synergistic collection of atmospheric data from a variety of space-based remote sensing systems. Specifically, the combination of the CloudSat 94-GHz radar and CALIPSO’s CALIOP lidar provides accurate detection of hydrometeors through an entire atmospheric column.
C. SCOPE OF RESEARCH
The objective of this research is to use combined CloudSat and CALIPSO data to remotely determine cloud base heights. Remotely determined cloud base heights are validated against ground-base lidar measurements from three of the U.S. Department of Energy’s Atmospheric Radiation Measurement (ARM) Program. Chapter II describes these the CloudSat and CALIPSO remote-sensing systems in detail, including the detection algorithms used by each system. In Chapter III the data collection and evaluation process is outlined. This chapter includes descriptions of the ARM locations as well as the detection algorithms used by the ground-based instruments. Chapter IV covers the results and findings of the validation process. Chapter V presents suggestions for future research.
II.
REMOTE SENSING SYSTEMS
A. A-TRAIN
The A-Train satellite constellation is a system of five satellites flying in formation. Formation flying provides a distinctive ability to collect information about a variety of Earth environment parameters in a synergistic manner (Goddard Space Flight Center 2003). These five satellites fly in close proximity to one another, allowing for nearly concurrent data collection from the different sensors. (Note: A sixth satellite, the Orbiting Carbon Observatory (OCO), was lost during launch in February 2009.) The A-Train is a sun-synchronous afternoon constellation, crossing the equator around 1330 local time each day. The constellation repeats its ground track roughly once every 16 days. While each remote sensing system in the constellation is individually valuable, the comprehensive atmospheric assessment provided by the constellation is unprecedented.
Figure 1. Conceptual drawing of A-Train satellite constellation. The Orbiting Carbon Observatory (OCO) is schedule for launch in late February 2009. Image credit: NASA (http://www.nasa.gov/images/content/112931main_a-train.jpg).
Each of the satellites flying in the A-Train constellation carries sensors collecting specific data. The Aqua satellite leads the formation and carries six sensors on board: the Atmospheric Infrared Sounder (AIRS), the Advanced Microwave Sound Unit (AMSU), the Humidity Sounder for Brazil (HSB), the Advanced Microwave Scanning Radiometer-EOS (AMSR-E), the Clouds and Earth’s Radiant Energy System (CERES), and the Moderate Resolution Imaging Spectroradiometer (MODIS). This sensor payload captures synergistic measurements of water in its various forms on Earth’s surface and in the atmosphere along with global climate data (Goddard Space Flight Center 2003).
CloudSat follows Aqua in the A-Train constellation. This satellite carries a 94-GHz Cloud Profiling Radar (CPR). Following just behind CloudSat is the Cloud-Aerosol Lidar and Infrared Pathfinder Satellite Observations (CALIPSO). CALIPSO carries a payload of three instruments: the Cloud Aerosol Lidar with Orthogonal Polarization (CALIOP), a three-channel Imaging Infrared Radiometer (IIR), and a single-channel high resolution Wide-Field Camera (WFC) (Goddard Space Flight Center 2003). More information regarding these two satellite systems is presented in later sections of this chapter.
The next satellite in the A-Train formation is PARASOL, short for Polarization and Anisotropy of Reflectances for Atmospheric Sciences couple with Observations from a Lidar. PARASOL carries a sensor that measures polarization of light at eight different wavelengths in order to characterize hydrometeors and aerosols in the atmosphere (Goddard Space Flight Center 2003). The final satellite in the constellation is Aura. Aura’s mission focuses on the monitoring of air quality, stratospheric ozone, and climate change (Goddard Space Flight Center 2003). This satellite carries a payload of four instruments: the High Resolution Dynamics Limb Sounder (HIRDLS), the Microwave Limb Sounder (MLS), the Tropospheric Emissions Spectrometer (TES), and the Ozone Monitoring Instrument (OMI). This combination of sensors measure distributions of greenhouse gases and pollutants and serve as a monitor of global climate change parameters (Goddard Space Flight Center 2003).
B. CLOUDSAT
1. 94-GHz Cloud Profiling Radar
CloudSat flies in a sun-synchronous orbit at an altitude of 705 km. The satellite carries a near-nadir pointing 94-GHz Cloud Profiling Radar (CPR) designed to record range-resolved profiles of backscattered power. The satellite travels at an along track velocity of seven km/sec and generates a vertical profile of the atmosphere every 1.1 km along track, resulting in a horizontal resolution of 1.4 km across track and 2.5 km along track (Mace et al. 2007a). The CPR emits a pulse every 3.3 microseconds, creating a vertical resolution of 480 meters. Each profile created by the CPR is divided into 125 vertical range bins. Rather than scanning the atmosphere, the CPR generates a two-dimensional cross-section of the atmosphere along its trajectory (Marchand et al. 2008). The minimum detectable signal of the radar is approximately -31 dBz.
To maintain the synergistic data collection relationship between the various A-Train sensors, CloudSat is burdened with maintaining a precise flying relationship with the EOS PM (Aqua) satellite flying 120 seconds ahead and with CALIPSO flying just 15 seconds behind. Mission requirements dictate that the CPR footprint must always fall within the central few kilometers of the Aqua MODIS swath while the CPR and CALIPSO ground footprints must overlap at least 50% of the time (Stephens et al. 2002). This tightly monitored synchronization allows for the fusion of data streams between the remote sensing systems that is central to the research presented here.
The CPR technology exploits the fact that clouds are weak scatterers of microwave radiation. Cloud reflectivity increases at higher frequencies, but so does atmospheric attenuation due to water vapor. The 94-GHz frequency optimizes sensitivity to weak scattering while minimizing significant atmospheric attenuation. In addition to water vapor attenuation, absorption by liquid water droplets and precipitation cause additional attenuation. While attenuation due to water vapor is automatically corrected in each profile, attenuation due to liquid water droplets and precipitation must be addressed in specific retrieval algorithms.
2. Hydrometeor Detection Algorithm
The purpose of CloudSat’s hydrometeor detection algorithm, called Geometrical Profile, or GEOPROF, is to use the data from the CPR to identify levels within the vertical column that contain a significant radar echo return due to the presence of hydrometeors. The echo return for each vertical volume in the column flagged with a significant echo is then translated into an estimated radar reflectivity factor (Stephens et al. 2002). This process starts by building a significant echo mask (SEM) to identify resolution volumes deemed to have a return significantly different from background noise and thus likely contain a hydrometeor. Following the same detection algorithms as described by Clothiaux et al. (1995, 2000), the measurement of power returned must account for the potential for false alarms (i.e., range volumes that returned a signal indicating the presence of hydrometeor when none actually exists). Power-returned from the vertical column combined with a Gaussian-like distribution of background noise added to the power returned reduces the likelihood of false alarms within the column. The initial criteria for a significant return based on this relationship is
P
r,jk
P
n,jk
(3
n)
where Pr is the sum of power returned from a resolution volume, Pn is the Gaussian-like
background system noise power, the subscripts j and k represent the along track dimension and the vertical dimension of the resolution volume, respectively, and σn is the
standard deviation of Pn,jk. If this criterion is met, the algorithm then calculates the radar
reflectivity in this range volume for the CPR cloud mask. If the criterion is not originally met, a probability function that considers the possibility of noise in the range volume and noise statistics of its neighbors known not to contain a significant echo is applied to ensure the cloud mask is applied properly (Mace 2007). The SEM output includes the radar reflectivity factor for 125 levels in each column calculated from the returned echo power (Pr).
The SEM is then compared to MODIS data from the EOS PM (Aqua) satellite flying just five seconds ahead of the CloudSat ground track. The comparison between the SEM and the MODIS cloud mask serves as a quality check of the GEOPROF output.
The MODIS cloud mask includes a detailed 48-bit cloud scene classification for every 1-km horizontal resolution pixel. Because the MODIS pixel is smaller than the 1.4-km across track by 2.5-km along track resolution of the CPR, a weighting scheme is applied to the MODIS pixels to ensure comparison to the correct CPR range volumes. The CPR then produces its own CPR Cloud Mask signaling whether or not a cloud is detected. The GEOPROF product also provides information about the variability of the scene via comparison of the fraction of MODIS pixels within the CloudSat footprint comprised of the same cloud type (Mace 2007). The comparison of the two data streams is an important quality check. If the correlation between MODIS and CloudSat cloud placement is high, then higher order algorithms, like 2B-GEOPROF-Lidar product that is the focus of this research, can be used with confidence.
C. CALIPSO
1. CALIOP
The Cloud-Aerosol Lidar with Orthogonal Polarization (CALIOP) is the primary instrument on board the CALIPSO satellite. The instrument measures total backscatter within an atmospheric profile at two wavelengths: 1064 nm and 532 nm. Two separate 532 nm channels measure the polarization of the backscattered signal; one measures the backscattered signal parallel to the outgoing beam while the other measures perpendicular to the outgoing beam. The collected backscattered returns provide vertical distributions of aerosols and clouds as well as information about cloud ice/water phase and classification of aerosol size (Winker 2006). The satellite carries two redundant Nd:YAG lasers that produce simultaneous pulses at 1064 nm and 532 nm at a pulse repetition frequency of 20.2 Hz, a pulse length of approximately 20 nsec, and each laser produces 110 mJ of energy. The sampling frequency of the backscattered signals is 10 MHz. The beam diameter at Earth’s surface is 70 m (Winker et al. 2003).
The fundamental vertical and horizontal sampling resolutions of the lidar are 30 m and 333 m, respectively, yielding a profile of 1400 30-m samples between 40 km and -2 km altitude (Winker et al. 2004). Initially the 532 nm channels are averaged to a 30 m
vertical resolution while the 1064 nm channel is averaged to 60 m. The column is sampled at the full 30-m resolution in the lower levels of the troposphere where spatially variable clouds and aerosols require the highest resolution to optimize detection. This resolution is not necessary in the upper troposphere and stratosphere where hydrometeors are neither as numerous nor as spatially-variable; thus, an on-board averaging scheme reduces the vertical resolution in the upper troposphere and again in the stratosphere. Table 1 outlines the CALIOP resolutions throughout the column.
Table 1. Spatial resolution of downlinked data from CALIPSO’s CALIOP sensor (Winker et al. 2006). Altitude Range (km) Horizontal Resolution (m) 532 nm Vertical Resolution (m) Profiles per 5-km Samples per Profile 30.1 to 40.0 5000 300 1 33 20.2 to 30.1 1667 180 3 55 8.2 to 20.2 1000 60 5 200 -0.5 to 8.2 333 30 15 290 -2.0 to -0.5 333 300 15 5
2. CALIOP Level 2 Algorithms
Most of the CALIOP Level 2 algorithms are based on the results of the LITE mission. The Level 2 algorithms use range-resolved profiles of attenuated backscatter coefficients for data processing (Vaughan et al. 2004). The objective of Level 2 processing for CALIPSO products is to determine layer heights and descriptive properties, perform layer identification and typing, and build profiles of cloud and aerosol backscatter and extinction coefficients. The Level 2 algorithms fall under three modules: the Selective Iterated BoundarY Locator (SIBYL) detects layers; the Scene Classification Algorithm (SCA) classifies these layers by type, and the Hybrid Extinction Retrieval Algorithms (HERA) performs extinction retrievals (Winker et al. 2006). For the purposes of this research, only the SIBYL and SCA algorithms are discussed here. The HERA algorithm is fully outlined in Part IV of the CALIOP Algorithm Theoretical Basis Document.
The SIBYL begins data processing by locating identifiable cloud and aerosol layers based on the strength of the backscatter signal. The algorithm then employs a multi-level averaging scheme. In a process called “feature clearing”, thick clouds are identified in high resolution, single-shot profiles of 532 nm backscatter data and removed from the profile. The removed feature is replaced with a model of clear air and the data below the removed boundary is corrected for the removed attenuation, leaving a backscatter profile that would have been measured if the removed feature had not been present (Vaughan et al. 2002). The profile is scanned again at a coarser resolution using the same technique. The process iterates over three horizontal averaging resolutions: 5 km, 20 km, and 80 km. Figure 2 provides a visual reference of the process. The algorithm provides the vertical location of all features within the profile as well as the vertical extent of these features.
Figure 2. SIBYL Feature Clearing. Figure (a) shows a 5-km averaged profile with a moderate cirrus layer overlying a weaker absorbing aerosol layer. Figure (b)
and (c) show, respectively, the removal of the cirrus layer and the correction of the underlying data for the estimated cirrus attenuation. Averaging four
consecutive feature cleared 5-km profiles results in the 20-km horizontal average depicted in (d). This 20-km average reveals the previously obscured
aerosol layer. The dotted lines in (a) and (d) are the threshold lines used by SIBYL’s profile-scanning algorithm (Vaughan et al. 2002).
The SCA processes the features detected by the SIBYL and classifies the feature as either cloud or aerosol. The determination between cloud and aerosol is primarily based on scattering strength and spectral dependence on backscatter (Winker et al. 2006).
The cloud layers are then classified by cloud phase, either ice or water, based on the 532 nm depolarization signal profiles. A full description of the SCA is available from Liu et al. (2005). Each classification parameter is stored for the use in the Vertical Feature Mask (VFM).
3. Vertical Feature Mask
The vertical feature mask (VFM) product provides the “where” and “what” information about the column. The VFM compiles outputs of the SIBYL and SCA to provide a spatial and morphological depiction of each lidar profile. The mask is an array of bit-mapped integers, with each integer containing a set of scene classification flags for each range resolution element (Vaughan et al. 2004). The classification flags define the feature presence and feature type at that level. Table 2 details the bit interpretation for the VFM.
D. COMBINED CLOUDSAT / CALIPSO PRODUCT
The 2B-GEOPROF-Lidar product combines the unique remote-sensing abilities of CloudSat’s CPR and CALIPSO’s CALIOP into a single product intended to provide a complete assessment of cloud and aerosol in the atmosphere. The combination of these two data sets allows for an estimate of cloud in each vertical radar bin and provides the heights of hydrometeor layer base and layer top for up to five different layers in each CPR vertical scan profile. The CPR is able to penetrate optically thick clouds, while the CALIOP can detect thin hydrometeor layers, such as thin high-level cirrus layers, below the CPR’s detection threshold. The CALIOP also has a higher vertical and horizontal resolution than the CPR (see previous sections for horizontal and vertical resolutions of each instrument).
The algorithm used in creating the 2B-GEOPROF-Lidar product pulls the spacecraft latitude and longitude from the CPR Level 2B-GEOPROF product, along with the height of each radar bin and the radar significant echo mask. The algorithm then pulls the latitude and longitude of the lidar profile along with the vertical feature mask from the CALIPSO Level 2 Vertical Feature Mask product. The difference in horizontal resolution between the two instruments introduces the potential for pointing uncertainty, as shown in Figure 3.
To counter the uncertainty within the spatial domain, a weighting scheme is applied, in which the degree of contribution from a lidar observation to a specific radar observation is calculated in terms of the degree to which that particular lidar observation potentially contributed to the spatial overlap in the radar observational domain. This weighting scheme is defined as
wi PrPlidy dx
y
x
where i counts the lidar profile in a particular radar observational domain, x and y define the spatial dimensions to form an area enclosing the radar spatial domain, Pr and Pl are
the spatial probability that a particular element in the area defined by x and y contributes to the observation of the radar and lidar, respectively. Using this weighting function, an
acceptable lidar cloud fraction at any level within the radar’s footprint can be expressed as a weighted combination of the lidar observations within the radar field, as shown by the following equation:
Cl wii i1 #oflidarobs
wi i1 #of lidarobs
Here Cl is the lidar cloud fraction, i is the number of lidar observations within a particular
radar resolution volume, and δi is the lidar hydrometeor occurrence which indicates
whether or not a hydrometeor exists at a given height within a given profile (Mace et al. 2007b). Essentially, Cl quantifies partial filling of a specific radar volume by
hydrometeors, and can therefore be used to correct errant radar reflectivity values due to partial beam filling.
Figure 3. Conceptual view of CPR-Lidar overlap. The diagram on the left is a plane view of a radar footprint in blue and lidar footprint in red. The black (red) solid and dashed ellipses (circles) represent the 1 and 2 standard deviation pointing uncertainty of the radar (lidar). The diagram on the right is a vertical
cross section of a radar range resolution volume. The squares represent potential lidar resolution volumes that contain hydrometeors as reported by
The 2B-GEOPROF-Lidar produces a layer product that uses the combined cloud masks from both the radar and lidar to define the base and top height of up to five hydrometeor layers within a column. The product identifies whether the layer is detected by the radar or the lidar. Due to the finer vertical resolution of the lidar (30 m versus 480 m), the lidar serves as the default instrument when reporting a layer boundary height. If the lidar identifies the layer boundary top but the signal fully attenuates before reaching a layer boundary base, the boundary top indicator will show detection by the lidar while the boundary base indicator will show detection by the radar. If the observed layer boundary falls within the same range bin for both the lidar and radar, the boundary height is defined by the lidar due to its finer resolution, while the instrument contribution flag would indicate that both instruments observed the boundary.
The final output of the CPR 2B-GEOPROF-Lidar Product provides cloud volume fraction and uncertainty of this fraction, the number of hydrometeor layers detected in the vertical column (up to five layers), the height of the cloud layer top and cloud layer base, and the instrument flag indicating which remote sensing instrument observed the cloud base and top. For the purposes of this research, the height of the cloud layer base and the instrument flag are the primary fields of interest.
III.
DATA COLLECTION AND ANALYSIS
A. GROUND-TRUTH COMPARISON
The initial research compared cloud based height assessments from the combined CloudSat / CALIPSO 2B-GEOPROF-Lidar product to data from four ARM sites: the Southern Great Plains (SGP) site near Lamont, Oklahoma; the North Slope of Alaska (NSA) site near Barrow, Alaska; and the Tropical West Pacific (TWP) sites of Manus Island, Papua New Guinea and Darwin, Australia. The 2B-GEOPROF-Lidar product is compared to the Active Remote Sensing of Clouds (ARSCL) value-added product (VAP) cloud base height product (arsclcbh1cloth, here after referred to as “ARM Cloud Base Height”) from each of these four sites. This product combines data from a co-located 35-GHz millimeter cloud radar (MMCR), a micropulse lidar, and Vaisala laser ceilometer (Clothiaux et al. 2000) to construct a best estimate of cloud-base height over the ARM site. The complete detection algorithm used in construction of the arsclcbh1cloth product is detailed in Clothiaux et al. (2000).
Due to the small ground footprint limiting spatial and temporal coverage of CloudSat and CALIPSO, all 2B-GEOPROF-Lidar data within a 20-km radius of each ARM location was pulled for the comparison. For the Manus Island site the radius was expanded to a 50-km radius of the ARM ground site in order to capture an adequate number of satellite overpasses for the dataset. The cloud base height reported by the ARM Cloud Base Height data was accepted as ground truth for the comparison. The difference in reported cloud base altitude between the 2B-GEOPROF-Lidar product and ARM Cloud Base Height product was calculated for a temporal window of two minutes on either side of the closest satellite nadir overpass to the ARM ground site, along with the distance from the nadir overpass point to the ground site. Figure 4 is a graphical representation of this data comparison. The two-minute buffer on either side of the nearest nadir overpass time was chosen for trend analysis purposes only. With the satellite constellation traveling at a relative ground speed of seven km/s, the satellite observations at the temporal extremes of the two-minute window are roughly 840 km
away from the ARM ground site, and therefore no correlation to the ARM Cloud Base Height assessment was expected at the extremes. Altitude differences greater than 720 m (1.5 times the vertical resolution of CloudSat) were labeled as significant outliers for further investigation.
Figure 4. Plot of 2B-GEOPROF-Lidar cloud base heights (blue ‘x’) and ARM Ground Site cloud base heights (red squares) for SGP site on 10 October 2006. Magenta line denotes nadir of closest satellite overpass to ground site, with +/-
2 minutes of data plotted on either side of overpass.
The first step in investigation of the outliers was a visual inspection of Aqua MODIS imagery. The likelihood of a direct satellite overpass of the ARM ground site is low given the small footprint of both CloudSat and CALIPSO. The MODIS imagery was used to ensure that the cloud element detected by ground site was similar to the cloud
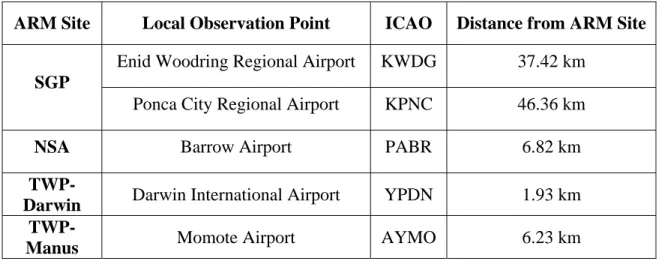
feature detected by CloudSat and CALIPSO. Local METAR observations were also compared to the cloud base data as a supplemental accuracy check. These local observation points and distances from the nearest ARM ground site are listed in Table 3. Any outliers of cloud base heights within 720 m of the locally observed cloud base were marked as acceptable measurements and removed from the significant outlier pool.
Table 3. Supplemental observation points and distance from respective ARM ground site.
ARM Site Local Observation Point ICAO Distance from ARM Site
Enid Woodring Regional Airport KWDG 37.42 km
SGP
Ponca City Regional Airport KPNC 46.36 km
NSA Barrow Airport PABR 6.82 km
TWP-Darwin Darwin International Airport YPDN 1.93 km
TWP-Manus Momote Airport AYMO 6.23 km
After narrowing the outlier pool based on the MODIS and local observations, the instrument responsible for the measurement—either CloudSat or CALIPSO—was noted. The outliers were then further investigated with additional products from each satellite system, with special interest placed on those products from the responsible remote sensing system, as outlined in the following sections.
B. ADDITIONAL CLOUDSAT ANALYSIS
The CloudSat 2B-GEOPROF product provides radar reflectivity (Ze) and a cloud
mask for each sampled column. The Ze data is calculated from the echo power
measurements recorded by CloudSat’s Level 1B science data. Ze values range from -40
to 50 dBZ. The cloud mask is created from the SEM outlined in Chapter II. The mask assigns a cloud probability to each significant echo return within the column, with values
between 20 and 40 indicating the detection of a cloud. Increasing values represent clouds with a lower chance of being a false detection (Marchand et al. 2007).
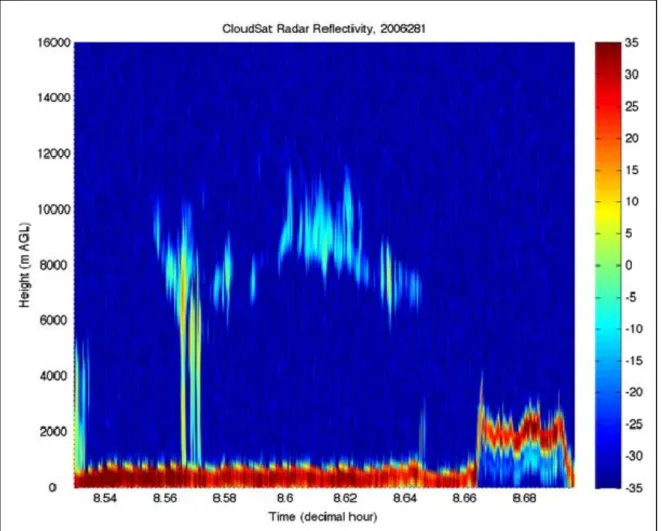
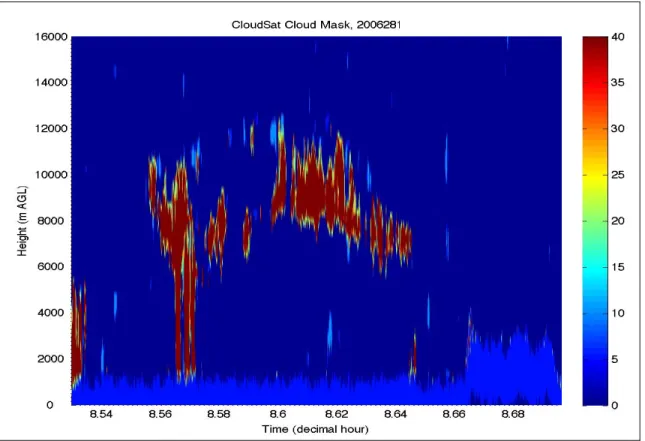
Figures 5 and 6 show an example of radar reflectivity and the cloud mask plots, respectively, for a five-minute window on either side of the closest satellite overpass of the ARM site. The 2B-GEOPROF product provides both Ze and the cloud mask for each
of the 125 layer bins in the vertical column sampled by CloudSat. The values of Ze and
the cloud mask corresponding to the layer containing the cloud base were compared, noting any discrepancies or trends. The results of this analysis are reported in Chapter IV.
Figure 5. Plot of Radar Reflectivity from CloudSat CPR 2B-GEOPROF data, 8 October 2006 (Julian Date: 281). CloudSat’s nearest overpass to the SGP ARM site
occurred at 0836 UTC (decimal hour: 8.6122). Color bar represents dBZ values. Data plotted +/- 5 minutes of overpass.
Figure 6. Plot of the cloud mask from CloudSat CPR 2B-GEOPROF data, 8 October 2006 (Julian Date: 281). CloudSat’s nearest overpass to the SGP ARM site occurred at 0836 UTC (decimal hour: 8.6122). Increasing Cloud Mask values
indicate increasing probability of cloud layer. Data plotted +/- 5 minutes of overpass.
In addition to providing Ze and cloud mask information, the 2B-GEOPROF
algorithm performs an comparison of MODIS data and the SEM. The inter-comparison includes four fields used for further investigation of the outliers. First, a MODIS cloud flag is set that defines the confidence of cloud cover within the column (cloudy, uncertain clear, probably clear, and confident clear). The second field is a MODIS pixel cloudiness characterization based on the MODIS cloud mask (clear, high cloud, very thin high cloud, thin high cloud, thick high cloud, non-high cloud, thick mid cloud, and low cloud). The third field of interest is a classification of CPR cloud echo tops based on MODIS cloud characterization within the CPR footprint (clear profile, high cloud, mid level cloud, low level cloud, and multilayer clouds). Finally, the fourth field of interest is a CloudSat scene variability parameter that describes the fraction of MODIS
pixels in the vicinity of the CloudSat footprint with the same cloud type (high uniform, uniform, weakly variable, variable, and highly variable) (Marchand et al. 2007). These fields were investigated for each outlier, specifically noting trends within certain cloud classifications that challenged accurate cloud base height identification. Again, these results are presented in Chapter IV.
The final CloudSat product used in the investigation of the outliers was the Cloud Scenario Classification (2B-CLDCLASS) product. This product classifies clouds using vertical and horizontal cloud properties derived from 2B-GEOPROF Ze and cloud mask
data, the presence or absence of precipitation, and upward radiance measurements from MODIS (Wang and Sassen 2007), along with temperature data from ECMWF. The algorithm classifies clouds as cirrus, altostratus, altocumulus, stratus, stratocumulus, cumulus, deep cumulonimbus, or nimbostratus. The outliers were compared to the cloud type identified by the 2B-CLDCLASS product. This comparison served two purposes: (1) the comparison served as a quality check of the CloudSat data collection algorithms since the cloud base height and cloud type should show a degree of correlation, and (2) any repetitive trends in uncorrelated cloud base heights and cloud type potentially highlight biases and weaknesses in the cloud base height detection algorithm.
C. ADDITIONAL CALIPSO ANALYSIS
CALIPSO Lidar Level 1B profile data provides total attenuated backscatter at 532 nm. The backscatter is reported at 583 levels in the vertical column. This fine vertical resolution was exploited in order to attempt to identify trends within the outlier pool. Furthermore, plots of the total attenuated backscatter data provided an additional visual reference for comparison with the CloudSat Ze and cloud mask data plots.
In addition to the cloud base and cloud top height assessments for the column used in the 2B-GEOPROF-lidar product, the CALIPSO Level 2 Cloud and Aerosol Layer product also provides the integrated attenuated backscatter at 532 nm. For each hydrometeor layer detected, the product calculates the backscatter between the determined cloud base and cloud top for the layer. This backscatter data was compared across the outliers with trends noted.
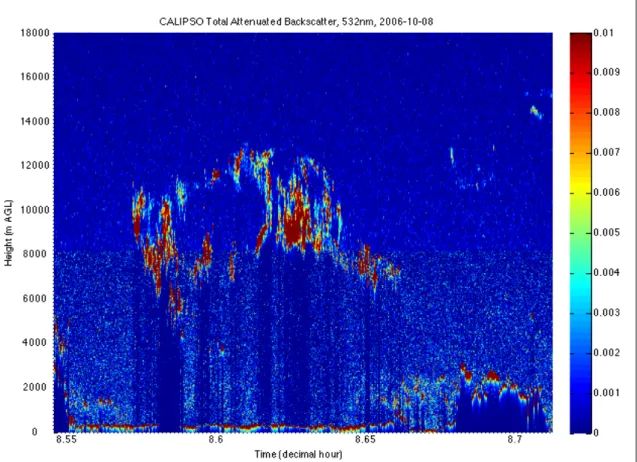
Figure 7. Plot of total attenuated backscatter at 532 nm detected by CALIPSO on 8 October 2006. CALIPSO’s nearest overpass to the SGP ARM site occurred at
0837 UTC (decimal hour: 8.6287). Data plotted +/- 5 minutes of overpass. CALIPSO’s Level 2 Cloud and Aerosol Layer product also provides a set of feature classification flags created by the Vertical Feature Mask (VFM) outlined in Chapter II. The product provides feature type (cloud, aerosol, or stratospheric layer), feature subtype (cloud type for the purposes of this research), and ice/water phase of the cloud. As was done with the CloudSat Cloud Scenario Classification data, the outliers were compared to the feature classification flags to find any correlation and/or trends in the falsely detected cloud base heights. Furthermore, since the primary product used for the initial cloud base height determination combines data from CloudSat and CALIPSO, the feature products from the two satellites were compared against each other for the outliers as a further check of accuracy. These results are reported in Chapter IV.
IV.
RESULTS AND FINDINGS
A. OVERALL RESULTS
The 2B-GEOPROF-Lidar product accurately identified the cloud base height in 73.22% of the cases examined. For the purposes of this research, an accurately identified cloud base height was defined as a cloud base reported by the 2B-GEOPROF-Lidar product that fell within 480 m of the ground-reported cloud base height. Table 4 summarizes the results for all four locations. Figure 8 provides a direct comparison of the 2B-GEOPROF-Lidar cloud base heights versus the ground site-detected cloud base heights. This figure highlights a few trends in the data. Any differences in cloud base height that exceeded 720 m (1.5 times the resolution of the CPR) were labeled as significant outliers and selected for further investigation. The four ARM locations represent drastically different climatic and geographic areas and the results reflect noticeably different trends for each location. While the independent results for each location are discussed in the later sections of this chapter, a few overarching trends are apparent in the combined analysis of all data points.
Table 4. Results of comparison of cloud base heights between the CloudSat / CALIPSO 2B-GEOPROF-Lidar product and ground observations.
Location Number of Samples Number of Correct Detections Percentage of Success Distance from Nadir Overpass to ARM Ground Site (km) SGP 35 26 .74 17.82 NSA 54 37 .69 20.37 TWP-Darwin 64 53 .83 7.46 TWP-Manus 30 18 .60 49.24 All Sites 183 134 .73 23.72
Figure 8. Plot of CloudSat / CALIPSO-determined cloud base heights via the 2B-GEOPROF-Lidar product versus ground-based cloud base heights. Since the 2B-GEOPROF-Lidar product indicates whether the reported cloud base height was determined by CloudSat or CALIPSO, this provided a focal point for the preliminary investigation of the outliers. For the complete data set, CALIPSO detected the cloud base in 82 of the 122 cases (67.21%) where a cloud was present in the column. Due to the higher resolution of the CALIOP and the nature of the 2B-GEOPROF-Lidar algorithm for cloud base height discussed in Chapter II, a greater number of CALIPSO detections was expected. CALIPSO correctly identified the cloud base height in 55 of the 82 cases (67.07%) where it was the primary detection instrument. Meanwhile CloudSat accurately identified the cloud base height in 19 of the 40 cases (47.50%) in which it was the primary detection instrument. The lower percentage of successful cases from CloudSat is attributed to the documented challenge of the CPR to resolve hydrometeors in the lowest kilometer of the atmosphere, which is further discussed later
in this section. There were six cases in which both CloudSat and CALIPSO failed to identify any significant hydrometeor layers in the column while the ARM instruments reported a layer. Figure 9 shows the distribution of CloudSat and CALIPSO plots for the data set.
Figure 9. Comparison of satellite-derived cloud base heights versus ground observation of cloud base height, sorted by primary detection instrument used by
2B-GEOPROF-Lidar product. ARM measurements from all fours sites are included in this figure.
A documented problem with the current 2B-GEOPROF-Lidar algorithm is CloudSat CPR’s decreased sensitivity to hydrometeor detection in the lowest 1 km of the atmosphere due to a combination of surface reflection and the 1 km pulse length of the CPR (Mace et al. 2007b). According to the 2B-GEOPROF-Lidar documentation, no identifiable hydrometeor signal is detected in the lowest 500 m of each profile, while hydrometeors between 500 m and 1 km are detected at a reduced sensitivity (Mace et al. 2007b). The results in this research confirm this known data issue. The ground
measurements reported cloud bases below 500 m in 48 cases. The satellite-derived cloud base heights proved accurate in 62.5% of these cases. In seven of the 18 cases where the difference exceeded 480 m, CALIPSO detected a mid-level deck between roughly 2000 and 4000 m. In cases with a ground-reported cloud base below 500 m CloudSat was not the primary detection instrument unless CALIPSO was completely attenuated by a mid- or upper-level cloud deck. In these cases, CALIPSO did not record any attenuated backscatter values in the column below the level of complete attenuation. The 2B-GEOPROF-Lidar product then relied solely on radar reflectivity returns from CloudSat to determine the cloud base. This introduced another bias with the detection scheme. CloudSat generally showed increased radar reflectivity returns near the surface in the range of -22 to -28 dBZ when the ground sites reported cloud bases below roughly 800 m. These increased dBZ values were reported at levels well correlated to the ground-reported cloud base height. However, the cloud mask attributed the increased reflectivity values to ground clutter and did not label the returns as cloud. Fine-tuning the SEM algorithm could reduce the ground clutter bias for the low-level layers, but is beyond the scope of this research.
The 2B-GEOPROF-Lidar product identified several high-level cloud base heights that the ground sites failed to identify. While the highest concentration of these errant high clouds was observed at the Darwin site, all locations showed several cloud base heights indicative of high clouds while the ground sites reported either a clear sky or an error in hydrometeor detection. Occasionally, the further check of the outliers against local METAR observations resolved a few of these discrepancies in cloud base height since a human observer is able to detect a high-level cirrus deck at a height beyond the vertical detection limits of the ground-based instruments. However, as will be shown in the independent discussions of the data from both Darwin and Manus later in this chapter, the comparison to METAR observations introduces its own set of biases and limitations, and therefore, cannot resolve all high-cloud outliers.
B. SOUTHERN GREAT PLAINS (SGP) RESULTS
The data availability window for the SGP site was July 4, 2006 to February 16, 2008. All CloudSat and CALIPSO overpasses of the SGP ground site occurred at approximately 0836 UTC (0236 LST); thus, all overpasses occurred during darkness. The comparison of cloud base heights between the satellite sensors and the ground observations for the SGP site showed the best correlation of the four ground sites, with an accurate assessment of cloud base height reported by the 2B-GEOPROF-Lidar product in 74% of the cases examined. Figure 10 shows the results of the comparison for the SGP site. Five cases were deemed significant outliers and selected for further investigation.
Figure 10. Comparison of CloudSat / CALIPSO 2B-GEOPROF-Lidar cloud base heights versus ground-based assessment of cloud base height for the ARM SGP ground site. Red markers denote significant outliers (> 720 m difference).
Of the five outliers investigated, two cases occurred when the ARM ground site instruments reported the cloud base height at the surface and local METAR observations reported a broken or overcast deck at 30 m. MODIS imagery indicated the ground site was in the warm sector of a developing low-pressure system to the west in both cases. CloudSat returned slightly increased radar reflectivity returns (-19.58 dBZ and -22.73 dBZ) below 1000 m, but classified these returns as clutter and did not assign a cloud classification. CALIPSO also indicated the presence of hydrometeors in the lowest kilometer of the column with weak backscatter returns. In both cases CloudSat and CALIPSO do identify overlying mid- and upper-level cloud decks with strong correlation between respective radar reflectivity and layer backscatter returns. Figure 11 shows a MODIS image for one of the cases in question. Given the synoptic situation indicated in this satellite image, these elevated cloud layers certainly exist, but without a ground base measurement for confirmation, the verification of these cloud base height assessments is not possible.
Figure 11. MODIS thermal composite image from 9 Sep 2007, 0835 UTC. Red cross represents location of SGP ARM ground site.
The three remaining outlier cases for the SGP ground site are cirrus situations. In one of these cases, both the CALIPSO Vertical Feature Mask (VFM) and the CloudSat cloud mask fail to identify a cloud in the column, and the local METAR reported clear skies. Furthermore, the CPR returned only weak radar reflectivity values of -29.6 dBZ at the levels labeled as cloud base by both the 2B-GEOPROF-Lidar and the ARM instrument. CALIPSO returned layer backscatter values indicative of a 240 m thick cirrus cloud. In this case, the more sensitive CALIPSO lidar detected a tenuously thin cloud that was not detectable by either the CloudSat CPR from above or the ground hydrometeor detection instruments. In the other two cirrus cases, CALIPSO was identified as the primary detection instrument of the cloud base height by the 2B-GEOPROF-Lidar data, and in both cases the assigned cloud base height was below the cloud base height detected by the ARM ground site. In these cases, both CPR radar reflectivity and CALIPSO total backscatter showed increased returns at the level indicated as the cloud base height by the ARM instruments, and the 2B-GEOPROF-Lidar product did assign a secondary cloud base at this indicated level in one of the cases. However, for the lowest cloud base identified by the 2B-GEOPROF-Lidar product, no significant increase in radar reflectivity or total backscatter occurred. The satellite-derived cloud base height assessment for the lowest cloud layer in both of these cases remained unresolved
C. NORTH SLOPE ALASKA (NSA) RESULTS
The data availability window for the NSA site was June 24, 2006 to December 26, 2007. The CloudSat and CALIPSO satellite overpass of the NSA ground site occurred at 1346 UTC (0446 LST) for the satellites’ descending path or 2230 UTC (1330 LST) for the satellites’ ascending path. Figure 12 shows the results of the comparison between the satellite-derived cloud base heights versus the ground-based observations.
Figure 12. Comparison of CloudSat / CALIPSO 2B-GEOPROF-Lidar cloud base heights versus ground-based assessment of cloud base height for the ARM NSA ground site. Red markers denote significant outliers (> 720 m difference). The most noticeable trend in Figure 12 is the satellite-derived cloud base heights reported much higher than the observed cloud bas heights in the lowest 500 m of the column. In fact, of the 12 significant outliers in the NSA data set, eight events occurred when the ground site reported a cloud base height below 1000 m and six of the events reported cloud base heights below 300 m. CloudSat showed increased radar reflectivity returns below 300 m for these six events, indicating the presence of hydrometeors. However, the cloud mask classified the increased returns as ground clutter rather than cloud. The cloud mask placed the cloud base at a higher level of increased reflectivity. Local METAR observations in three of these cases reported visibilities reduced to less than 1 km due to fog, and snow was reported in a fourth case, which is further discussed below. While the inability to accurately resolve the low-level cloud heights for the NSA
site was troublesome, this inaccuracy was expected due to the documented difficulties of the detection algorithms in the lowest 1 km of the sampled column.
One of the significant outliers was a snow event at NSA on 29 March 2007. The closest CloudSat overpass to the ARM ground site occurred at 1348 UTC. This was the only case where the satellite-derived cloud base height reported was lower than the ground observation when the ground sties reported a base below 1000 m. The CloudSat cloud classification reported a nimbostratus cloud with precipitation between 1280 m and 5597 m. Radar reflectivity values for this cloud feature ranged from -1.99 dBZ to -24.82 dBZ. The radar reflectivity returns remain high (> -17 dBZ) to 800 m, which also happens to be close to the 839 m cloud base detected by the ARM instruments, yet the cloud mask labeled the returns below 1280 m as ground clutter rather than cloud. The CALIPSO total attenuated backscatter data also indicated a cloud from 1630 m to 5530 m. The VFM reported a cloud base at 1587 m. Complete attenuation of the lidar occurred at approximately 1150 m, and no significant backscatter returns were received below this level. It is unclear why the 2B-GEOPROF-Lidar product detected a cloud base at 100 m, since neither the CPR nor CALIOP returned useful data from this level.
D. TROPICAL WEST PACIFIC - DARWIN RESULTS
The data availability window for the TWP-Darwin site was June 20, 2006 to April 23, 2008. The CloudSat and CALIPSO satellite overpass of the TWP-Darwin ground site occurred at 0506 UTC (1436 LST) for the satellites’ ascending path or 1653 UTC (0223 LST) for the satellites’ descending path. Figure 13 shows the results of the initial cloud base height comparison between the 2B-GEOPROF-Lidar and the ARM ground based detection.
Figure 13. Initial comparison of CloudSat / CALIPSO 2B-GEOPROF-Lidar cloud base heights versus ground-based assessment of cloud base height for the ARM TWP-Darwin ground site. Red markers denote significant outliers (> 720 m
difference).
The initial results showed a sizeable group of significant outliers in which the satellite-assigned cloud base heights are much higher than the height assigned by the ARM instruments. The cloud base height reported by the ARM instruments in these cases was either 0 or reported as an error, while the satellite-derived cloud base heights exceeded 12500 m. Usually the METAR was referred to as the default cloud base height for validation purposes when the ARM site did not report a valid cloud base. However, the METAR observations from the Darwin International Airport used for validation simply reported “CAVOK” in each of these cases, indicating that no cloud was present below 1524 m, but providing no information about the atmosphere above this level. After a visual inspection of MODIS satellite imagery to confirm generally clear skies,
eight of these outliers were reclassified as clear profiles and removed from the outlier pool. Figure 14 shows the updated comparison of cloud base heights after correcting for the high-level clouds.
Figure 14. Initial comparison of CloudSat / CALIPSO 2B-GEOPROF-Lidar cloud base heights versus ground-based assessment of cloud base height for the ARM TWP-Darwin ground site. Red markers denote significant outliers (> 720 m
difference).
The TWP-Darwin site was the only site with multiple precipitation events in the data set. Local METAR observations reported precipitation concurrent with the satellite observation on eight occasions. The 2B-GEOPROF-Lidar detection algorithm produced reasonable results in cloud base assessment during these the precipitation events. The original outlier pool for the TWP-Darwin site contained seven of the eight precipitation events. The error in satellite-derived cloud base height in these seven precipitation events averaged 4165 m higher than the ARM cloud base height assessment. However, when compared to local METAR observations, the difference in cloud base heights decreased
to 549 m. This drastic improvement is most likely the result of attenuation of the measurement signals by the falling precipitation for the ARM instruments. In precipitation cases, the human-observed METAR should provide a more accurate value for the cloud base height than the easily attenuated ground-based sensors. Three of the original seven outliers with precipitation were removed from the outlier pool once the METAR confirmed a cloud base height within the accepted 480 m resolution of the satellite-derived cloud base height. The cloud base in six of the eight cases was observed by CloudSat, as the CALIPSO signal completely attenuated in the cloud layer above the falling precipitation. The lidar signal attenuation was most pronounced when CloudSat’s cloud classification labeled the hydrometeor layers as “deep convection”. Figures 15 and 16 show the total attenuated backscatter from CALIPSO and the radar reflectivity from CloudSat, respectively, for one of the rain events at TWP-Darwin. In the total backscatter plot, the complete attenuation of the lidar signal is evident at approximately 13,400 m, with the VFM placing the cloud base at 13,114 m due to the lack of backscatter data below this level. The total backscatter data reported a maximum backscatter value of 0.0436/km-sr at 14080 m. The radar reflectivity returns from CloudSat showed significant returns (> -20 dBZ) and a corresponding cloud mask value of 40 (complete certainty of cloud presence) to 1531 m, the level reported by the 2B-GEOPROF-Lidar product as the cloud base for the column. The radar reflectivity values remain high (> -23 dBZ) below 1351 m in this case, yet the cloud mask classified the returns as ground clutter rather than as a cloud layer. The combination of CloudSat and CALIPSO data in this case proved useful, but the poor resolution of the hydrometeors in the lowest portion of the column remains a problem for the detection algorithm.
Figure 15. Total attenuated backscatter recorded by CALIPSO for precipitation event at TWP-Darwin on 3 Mar 2007. CALIPSO’s nearest overpass to the ARM