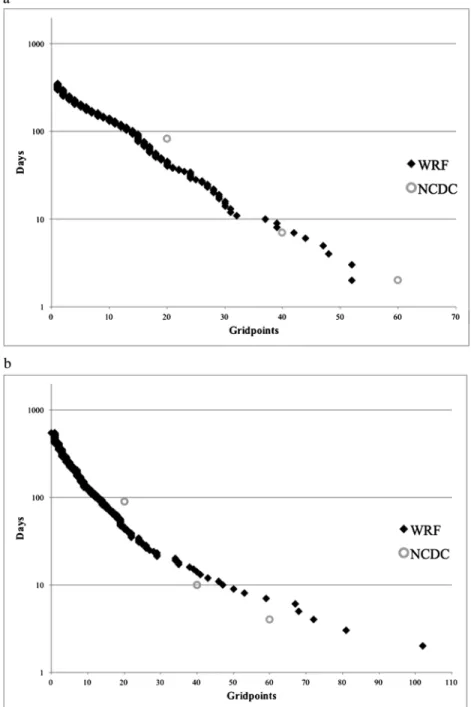
Analysis of WRF extreme daily precipitation over Alaska using self-organizing maps
Full text
Figure


Related documents
Power consumption gathered via the WSN shows different profiles depending on the workload under execution and the server architecture (AMD vs.. Intel, see Figure 3a). CPU
The scattergram represents the distribution with age of 69 determinations of concentration of potassium in serum of 39 premature infants with respiratory distress syndrome (Table
after discharge at which time the laboratory studies revealed a normal urine with a specific gravity of 1.025 and a urea clearance of 100% of average normal function.. After a
In view of the importance of aryloxy tetrazoles and aryloxy imidoylazides [38-43], we want to report a facile, effective and less hazard method for synthesis the 5-aryloxy
Field experiments were conducted at Ebonyi State University Research Farm during 2009 and 2010 farming seasons to evaluate the effect of intercropping maize with
It requires an integration of timer, counter & watchdog timer in a sequential control system for better safety and control.[1]In this paper we propose to
Representations of the body in it all its graphic and ontological essence can become political/ ethical ‘wormholes’ between one image and another, one city space and