Abstract
In this paper, we study the web traffic of KFUPM campus network using one month long access logs captured from a proxy cache at the edge of this network. This network is constrained by limited wide-area networking infrastructure in terms of low bandwidth and high delay. A cluster of proxy servers at the edge of this network is used to alleviate the problems due to limited outgoing bandwidth. Our study reveals that the WWW traffic characteristics generally follow well-known heavy tailed distributions with only a couple of exceptions. Our analysis also indicates that majority of traffic is destined to remote locations, resulting in excessive latency.
Keywords: WWW traffic, proxy servers, characterization, access log, and performance evaluation.
1:
Introduction
Regional networks spanning short geographical areas, such as corporate or campus networks, have their specific infrastructure, access characteristics, and performance requirements that differ from wide-area networks. While performance and traffic characteristics of wide-area networks are well understood (e.g., see [15] or [14]), there are relatively few studies available in public domain that characterize short range networks in terms of their traffic. In this paper, we study the traffic characteristics of a our university campus network at KFUPM in Saudi Arabia. We use network access data collected from a web proxy server at the edge of this campus network. Our goals include: identification of content types and corresponding sizes of data transferred; characterization of accesses in terms of local vs. remote sites; and to uncover the reasons for excessive network latencies experienced by the users.
A number of features distinguish a short range campus network from other types of networks, particularly a typical wide-area network. These features include: 1. Unique Infrastructure: in many cases network
infra-structure can be best described as ad hoc, which grows with the number of its users.
2. Asymmetric Data Transfers: volume of incoming data is significantly larger compared to the volume of out-going data. A dominant fraction of this incoming traf-fic corresponds to World Wide Web (WWW) based applications due to their popularity.
3. Specific Application Demands: these demands result in traffic flow related characteristics, such as bulk, bursty, constant rate, variable rate, etc.
4. Existence of Undetected Bottlenecks: ad-hoc design results in over-provisioning at various parts of the infrastructure without proper analysis. Bottlenecks may simply relocate elsewhere due to over-provision-ing without solvover-provision-ing the real problem.
Keeping these features in mind, we know that the volume of WWW traffic dominates all other types of traffic in our campus network. All WWW and other types of network traffic goes through a cluster of proxy servers at the edge of this network, which provides security, authentication, and access control functions in addition to caching. Our study is based on the analysis of access logs obtained from these proxy servers. Choosing this “vantage point” allows us to observe all network traffic at an aggregation point that it has to cross to reach the outside network and the Internet.
The KFUPM campus network has a limited 2 Mbits/sec outgoing link. Our analysis of WWW traffic indicates that a majority of popular web sites are located in North America. Accessing these sites not only consumes limited outgoing network bandwidth but also results in excessive latencies for the end users. Proxy servers are used to efficiently share this limited bandwidth among multiple users. Since all WWW traffic needs to pass through it, a proxy server can quickly become a major bottleneck in the path of an end-to-end connection unless it is properly sized and configured. Therefore, one of the goals of this study is to analyze the performance of the proxy server.
A number of previous studies have analyzed various aspects of network traffic characteristics through access logs. Some studies are focused on wide-area traffic characteristics. For instance, Paxon [14] analyzes the characteristics of wide area TCP connections using traces of 3 million connections at various gateways. These connections correspond to several TCP applications, such as ftp, telnet, nntp, and smtp. End-to-end routing behavior for pathological conditions and routing stability has been
Analysis of KFUPM Web Traffic Using Proxy Access Logs
Abdul Waheed
Computer Engineering Department
King Fahd University of Petroleum and Minerals
Dhahran 31261, Saudi Arabia
E-mail: [email protected]
examined using “traceroute” based information across a large number of widely distributed Internet destinations [16]. Wide area TCP connection traces are also used to analyze the connection interarrival times [15]. Logg et al. use log data to analyze the TCP, UDP, and ICMP traffic between multiple High Energy Physics research sites at the edge of a laboratory network [10].
Many recent studies have focused on WWW traffic as it remains the dominant component of Internet traffic. WWW traffic characterization efforts can be classified into at least four areas: general traffic characterization, web server workload and performance studies, characterization of client/user behavior, and web proxy performance evaluation. Crovella et al. examine the general characteristics of self-similar nature of WWW traffic [4] and heavy-tailed distributions of web related document sizes and other attributes [5]. A number of studies have characterized web server performance using measurements. Arlitt and Williamson identify several invariants in web server workloads that remain unchanged from one site to another [2]. Arlitt provides a detailed analysis of the workload of a busy Worldcup ‘98 web server using access logs [3]. Reed et al. present visualization tools to monitor the performance of web servers [8,9]. Cuha et al. analyze the client behavior using log data obtained by instrumenting a Mosaic web browser and collecting access information in response to WWW accesses from this browser [6]. Abdulla et al. use proxy server traces from a number of industry, government, and academic sites to analyze WWW workload characteristics and their impact on caching performance [1]. Mahanti et al. characterize the workload in a hierarchical proxy caching environment for a campus network [11]. These two efforts focus on characterizing the workload attributes, such as existence of heavy-tailed document popularity and size distributions, source of self-similarities, and cyclic behavior of users. Compared to these two efforts, our work is motivated by the existence of performance bottlenecks that result in excessive delays for the end users. Our analyses also indicate the existence of heavy-tailed distributions in our WWW access logs, however, the scope of our analyses is restricted to appreciating the heavy-tail behavior only by visual inspection. We do not attempt to use statistical tests to rigorously prove the existence of heavy-tailed distributions as it is a well-known phenomenon. Instead, our study is specifically focused on identifying the performance bottlenecks through measurements at the edge of KFUPM network.
Section 2 outlines the architecture of the KFUPM campus network. WWW traffic characteristics are analyzed in Section 3 followed by analysis of performance bottlenecks in this network in Section 4. We conclude with a discussion of the contributions of this work and its future course.
2:
Network Architecture and Access Log
Data Collection
The KFUPM campus network consists of an FDDI ring that connects various subnetworks. This local infrastructure consists of a mix of 10/100/1000 Mbits/sec networks. All of the outbound network traffic has to pass through a cluster of three proxy servers. These proxy servers are based on Microsoft Proxy 2.0 on Windows 2000 Server platforms in an array configuration using Cache Array Routing Protocol (CARP) for load-balancing and making the array look like a unified cache to the clients [12]. In addition to caching for HTTP requests, proxy servers provide authentication, access control, and transparent proxying for other network traffic (e.g., winsock, ftp, nntp, etc.). Non-HTTP traffic access is restricted to a small group of users, therefore, major content of outbound traffic is due to HTTP transactions. Campus network is connected to the national ISP about 300 miles away through a T1 line with 2 Mbits/sec bandwidth. The ISP has its own HTTP caching infrastructure at the edge of its network, which is connected to the Internet through satellite and land based links.
Proxy servers continuously generate trace records due to HTTP requests, which are logged into files on local disks. Trace record format of these log data are specified in [13]. We use a month (Feb. 2002) long log of WWW access traces by the campus users for this study. Log data consist of more than about 8 million valid trace records corresponding to that many HTTP transactions. All of these trace records were passed through a filter to remove user IDs and requesting host’s IP addresses before we obtained them for this study to maintain the privacy of the users.
3:
WWW Traffic Characteristics
General characteristics of WWW traffic are well understood and a number of these characteristics can be identified in any network. Our objective in this section is to analyze the proxy server access log data at the edge of campus network to determine three properties of WWW traffic:
1. Most frequently visited sites and their frequencies; 2. Type and frequency of accessed content; and
3. Sizes of documents with respect to each content type. We examine each of these characteristics in the following sub-sections.
3.1: Web Site Popularity
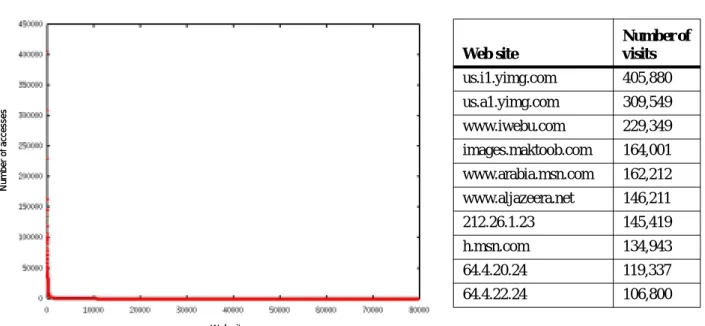
Figure 1(a) shows the number of visits to unique web sites sorted in descending order. There are very few unique web sites that are accessed most frequently. However, there are thousands of web sites that are accessed for only a few times. This follows a typical heavy-tailed popularity distribution, as observed by others [2,5]. Figure 1(b) tabulates top ten most frequently accessed web sites. All of these sites are geographically remote sites, mostly in
North America. Thus most of the outbound network traffic is destined to remote servers resulting in excessive delay and utilization of limited bandwidth.
3.2: Content Type Analysis
Figure 2 presents the number of documents with respect to various MIME types: image, text, application, audio, video, etc. Clearly, more than 70% of web traffic carries images. Text documents make up only about 18% of the traffic. Rest of the document types have a relatively small contribution to the overall content.
3.3: Document Size Analysis
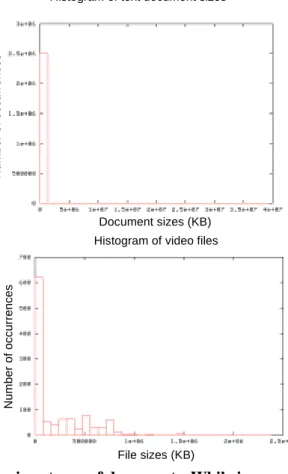
Figure 3 presents the histograms of sizes of four types of documents: HTML, image, audio, and video. Both HTML and image documents have their peaks at small file sizes and very few documents have large sizes. In case of audio and video documents, there are
0 1000000 2000000 3000000 4000000 5000000 6000000 7000000 8000000 9000000 10000000
Images Html App Audios Videos Rest
Document types (MIME types)
Numbe r of do c u m ent s
Figure 2: Analysis of web traffic content types.
considerable number of occurrences at larger file sizes. While HTML and image files appear to follow the well-known heavy-tailed distributions, the audio and video file sizes do not appear to follow such a pattern. It should be noted that the audio and video files are not streaming objects. In fact, the proxy servers in KFUPM network do not cache streaming media objects. Therefore, entire media files are transferred resulting in average sizes of several hundred kilobytes compared to only few kilobytes sizes in cases of HTML and image files.
Table 1 lists the mean file sizes and their standard deviations with respect to different types of content. The image file size is less than 4 KB, which is quite small. It means that most of the compressed images are of small sizes. Similarly, uncompressed text documents have an average size of around 10 KB. This is also consistent with other studies of such file sizes. The average sizes of audio and video files, however, is very large. Since even a short digitized audio or video clip is large, this measurement can be related to the inherent nature of digitization process that results in huge file sizes.
The fact that the image and text file sizes follow a long-tail distribution can be observed by trying to fit some theoretical probability density functions (pdfs) to the measured sizes. These theoretical pdfs may include: normal, exponential, and lognormal. None of these standard distributions exhibit long-tail. It can be observed that both image file size and text file size data has a huge peak in the beginning and heavy tail, which is not followed by any of the theoretical pdfs. On the other hand, analysis of audio or video file sizes do not exhibit such characteristics as they correspond to bulk data transfer
Web sites N u m b e r o f acce sses Web sites N u m b e r o f acce sses Web site Number of visits us.i1.yimg.com 405,880 us.a1.yimg.com 309,549 www.iwebu.com 229,349 images.maktoob.com 164,001 www.arabia.msn.com 162,212 www.aljazeera.net 146,211 212.26.1.23 145,419 h.msn.com 134,943 64.4.20.24 119,337 64.4.22.24 106,800
Figure 1: Analysis of popular web sites and the number of visits to those sites. (a) Web site popularity exhibits a long tail. (b) These characteristics indicate that significantly large number of requests are destined to web servers in North America resulting in excessive delay and high demand of limited outbound network bandwidth.
(b) (a)
rather than streaming.
Analysis of general traffic characteristics in this section indicates that KFUPM campus network follows well-known characteristics of web traffic. Web site visit frequency and document sizes follow heavy-tailed distribution with the exception of audio and video file transfers due to their unusually large sizes. Analysis of
Table 1. Summary statistics of document sizes with respect to various types of content.
Content type Max. (KB) Mean (KB) St. deviation (KB) Images 6,699 3.6 16.8 Text/HTML 39,361 10.8 59.3 Compressed 29,636 501.5 1,447 Applications 15,454 9.2 97.6 Audio files 735 735 1,155 Video files 200 200 283
content types also shows that majority of documents are either HTML or image files.
4:
Analysis of Bottlenecks
Since all of the outbound campus network traffic passes through the proxy server array, it can become a bottleneck for this network. Table 2 provides the frequency of various types of network transactions that result in traffic. An overwhelming majority of all network transactions (98%) results in downstream data transfer from outside to the internal network.
Our analysis of proxy server logs indicates that the average latency for each data transfer is in the range of 2.9 seconds with an average document size of 6 KBytes. This appears to be a huge latency compared to the amount of data transfer. However, as we indicated most of the data accesses are from remote locations in North America, data has to traverse a large number of hops before reaching the local destination. Some of the links in this path are slow satellite based connections. In addition, the infrastructure does not preclude the use of upstream proxy servers that further enhance the latency. This type of excessive latency is a characteristic of network traffic in a typical developing country as the sites accessed are several hops away.
Histogram of image sizes Histogram of text document sizes
Document sizes (KB) Image sizes (KB) Num ber of occu rrences Num b er of occ u rrences
Histogram of audio files
N u mber of occ u rrenc es File sizes (KB) Num ber of occur rences File sizes (KB) Histogram of video files
Figure 3: Characteristics of document file sizes for various types of documents. While images
and text documents exhibit long tails, the sizes of compressed audio and video file sizes show
[2] M. Arlitt and C. Williamson, “Web Server Workload Characterization: The Search for Invariants”, in the pro-ceedings of the 1996 ACM SIGMETRICS Conference on the Measurement and Modeling of Computer Systems, Philadelphia, PA, May 23-26, 1996.
[3] Martin Arlitt and Tai Jin, “Workload Characterization of the 1998 World Cup Web Site,” HP Labs Technical Report HPL-1999-35R1, Sept. 1999.
[4] Mark Crovella and Azer Bestavros, “Self-Similarity in World Wide Web Traffic: Evidence and Possible Causes,”
IEEE/ACM Transactions on Networking, 5(6), pp. 835-846, 1997.
[5] Mark E. Crovella, Murad S. Taqqu, and Azer Bestavros, “Heavy-Tailed Probability Distributions in the World Wide Web,” in A Practical Guide To Heavy Tails, Chap-ter 1, Chapman & Hall, New York, pp. 3--26, 1998. [6] Carlos R. Cunha, Azer Bestavros, and Mark E. Crovella,
“Characteristics of WWW Client-based Traces,” Techni-cal Report # BU-CS-95-010, Computer Science Depart-ment, Boston University, 1995. Available on-line from: http://cs-www.bu.edu/faculty/crovella/paper-archive/TR-95-010/paper.html.
[7] DummyNet. Available from: http://www.iet.unipi.it/ ~luigi/ip_dummynet.
[8] Tomas T. Kwan, Robert E. McGrath, and Daniel A. Reed, “NCSA's World Wide Web Server: Design and Perfor-mance,” IEEE Computer, November 1995, Vol. 28, No. 11, pp. 68-74.
[9] Stephen E. Lamm, Daniel A. Reed and Will H. Scullin, “Real-Time Geographic Visualization of World Wide Web Traffic,” World Wide Web Journal, The Web After Five Years, a publication of the Web Consortium and O'Reilly & Associates, Roger Hurwitz (ed), Vol. I, Issue 3, Summer 1996.
[10] Connie Logg and Les Contterell, “Passive Performance Monitoring and Traffic Characteristics on the SLAC Internet Border,” Technical Report, Available on-line from: http://www.ihep.ac.cn/~chep01/paper/7-017.pdf. [11] Anirban Mahanti, Carey Williamson, and Derek Eager,
“Traffic Analysis of a Web Proxy Caching Hierarchy,” in
IEEE Network Magazine: Special Issue on Web Perfor-mance, May/June 2000.
[12] Microsoft Proxy Server 2.0—Cache Array Routing Proto-col (CARP), White Paper, Available on-line from: http:// www.microsoft.com/technet/archive/default.asp?url=/ TechNet/archive/proxy/prxcarp.asp.
[13] Microsoft Web Proxy Server 2.0 Log File Format, Avail-able on-line from: http://support.microsoft.com/ default.aspx?scid=kb;EN-US;q234147.
[14] Vern Paxson, “Empirically-Derived Analytic Models of Wide-Area TCP Connections,” IEEE/ACM Transactions on Networking, 2(4), pp. 316-336, August 1994.
[15] Vern Paxson and Sally Floyd, “Wide-Area Traffic: The Failure of Poisson Modeling,” IEEE/ACM Transactions on Networking, 3(3), pp. 226-244, June 1995.
[16] Vern Paxson, “End-to-End Routing Behavior in the Inter-net,” in Proceedings of SIGCOMM '96, August 1996. [17] The Measurement Factory, Third Cache-off Official
Report, 2001. Available on-line from: http://www.mea-surement-factory.com/results/public/cacheoff/NO3/ report.by-alph.html.
5:
Conclusions
Analysis of proxy server logs at the edge of KFUPM campus network indicates that WWW traffic generally follows well-known characteristics in terms of web site popularity, content types, and document size distributions. Log data also confirms a common complaint of campus network users of experiencing excessive delays. Average delays per transaction over a period of one month were measured to be about 3 seconds despite low average load on the proxy servers at the edge of the network.
Detailed profiling of the proxy logs in terms of HTTP request types, response codes, and outcome of local cache look up for corresponding documents indicates that the common case of transferring a document from one of the local caches takes excessively long time. This is contrary to the common perception held by users and network administrators that the excessive delays experienced by the end users are due to limited outbound bandwidth combined with heavy transaction load. Limited bandwidth can result in excessive delays but only if the offered transactions to the proxy is excessively high with poor hit rate—two conditions not substantiated by the log data.
Acknowledgements
Author would like to acknowledge the support from the Computer Engineering Department of King Fahd University of Petroleum and Minerals (KFUPM) for this work. In addition, I would like to acknowledge the support of Information Technilogy Center (ITC) of KFUPM to provide the proxy access logs.
References
[1] G. Abdulla, E. Fox, M. Abrams, and S. Williams, “WWW Proxy Traffic Characterization with Applica-tion to Caching,” Technical Report TR-97-03, Com-puter Science Department, Virginia Tech., March 1997. Available on-line from: http://www.cs.vt.edu/~chitra/ work.html.
Table 2. Frequency of various types of network transactions through HTTP proxy
server at the edge of the network. Operation type Count % of all operations GET 13,431,538 97.68% POST 198,867 1.45% HEAD 1,295 0.01% OPTION 796 0.01% All types of ops 13,750,835 100%