Glasgow Theses Service
Al-Saeed, Majed Mohammed Abdullah (2015) Profiling a parallel
domain specific language using off-the-shelf tools. PhD thesis.
http://theses.gla.ac.uk/6561/
Copyright and moral rights for this thesis are retained by the author
A copy can be downloaded for personal non-commercial research or study
This thesis cannot be reproduced or quoted extensively from without first obtaining permission in writing from the Author
The content must not be changed in any way or sold commercially in any format or medium without the formal permission of the Author
When referring to this work, full bibliographic details including the author, title, awarding institution and date of the thesis must be given
LANGUAGE USING OFF-THE-SHELF TOOLS
Majed Mohammed Abdullah Al-Saeed
Submitted in Fulfilment of the Requirements for the Degree of
Doctor of Philosophy
University of Glasgow
College of Science and Engineering
School of Computing Science
July 2015
The copyright in this thesis is owned by the author. Any quotation from the thesis or use of any of the information contained in it must acknowledge this thesis as the source of the quotation or information.
Profiling tools are essential for understanding and tuning the performance of both parallel programs and parallel language implementations. Assessing the performance of a program in a language with high-level parallel coordination is often complicated by the layers of abstraction present in the language and its implementation. This thesis investigates whether it is possible to profile parallel Domain Specific Languages (DSLs) using existing host language profiling tools. The key challenge is that the host language tools report the performance of the DSL runtime system (RTS) executing the application rather than the performance of the DSL application. The key questions are whether a correct, effective and efficient profiler can be constructed using host language profiling tools; is it possible to effectively profile the DSL implementation, and what capabilities are required of the host language profiling tools?
The main contribution of this thesis is the development of an execution profiler for the parallel DSL, Haskell Distributed Parallel Haskell (HdpH) using the host language profiling tools. We show that it is possible to construct a profiler (HdpHProf) to support performance analysis of both the DSL applications and the DSL implementation. The implementation uses several new GHC features, including the GHC-Events Library and ThreadScope, develops two new performance analysis tools for DSL HdpH internals, i.e. Spark Pool Contention Analysis, and Registry Contention Analysis.
We present a critical comparative evaluation of the host language profiling tools that we used (GHC-PPS and ThreadScope) with another recent functional profilers, EdenTV, alongside four important imperative profilers. This is the first report on the performance of functional profilers in comparison with well established industrial standard imperative profiling technologies. We systematically compare the profilers for usability and data presentation. We found that the GHC-PPS performs well in terms of overheads and usability so using it to profile the DSL is feasible and would not have significant impact on the DSL performance.
We validate HdpHProf for functional correctness and measure its performance using six benchmarks. HdpHProf works correctly and can scale to profile HdpH pro-grams running on up to 192 cores of a 32 nodes Beowulf cluster. We characterise the performance of HdpHProf in terms of profiling data size and profiling execution runtime overhead. It shows that HdpHProf does not alter the behaviour of the GHC-PPS and retains low tracing overheads close to the studied functional profilers; 18% on average. Also, it shows a low ratio of HdpH trace events in GHC-PPS eventlog, less than 3% on average.
We show that HdpHProf is effective and efficient to use for performance analysis and tuning of the DSL applications. We use HdpHProf to identify performance issues and to tune the thread granularity of six HdpH benchmarks with different parallel paradigms, e.g. divide and conquer, flat data parallel, and nested data parallel. This include identifying problems such as, too small/large thread granularity, problem size too small for the parallel architecture, and synchronisation bottlenecks.
We show that HdpHProf is effective and efficient for tuning the parallel DSL implementation. We use the Spark Pool Contention Analysis tool to examine how the spark pool implementation performs when accessed concurrently. We found that appropriate thread granularity can significantly reduce both conflict ratios, and conflict durations, by more than 90%. We use the Registry Contention Analysis tool to evaluate three alternatives of the registry implementations. We found that the tools can give a better understanding of how different implementations of the HdpH RTS perform.
In The Name Of Allah (God), The Most Gracious, The Most Merciful.
I dedicate this thesis to the memory of my mother. I miss her so much, but I am glad that she saw the process of this thesis through to its completion, offering the support to make it possible, as well as plenty of prayers, may Allah rest her soul in peace amen.
My praises to Allah (God) for giving me the wellness, the strength of determination, the patience, and support to complete this work successfully.
I would like to express my special appreciation and thanks to my supervisor Professor Phil Trinder, for all his encouragement, guidance and support to my research, and for allowing me to grow as a research scientist. I have benefited greatly from his advice, inspiration, and vast experience.
Also, I would like to express my very great appreciation to my supervisors Dr. Lilia Georgieva and Dr. Patrick Maier. Lilia’s professional guidance and valuable support have been a great help in my research. Patrick has been a tremendous mentor for me. I have been lucky enough to work with him over the course of my PhD, he was invaluable in providing guidance and support from a different perspective. His willingness to give time so generously has been very much appreciated.
Many thanks to Professor Greg Michaelson and Dr. J. Paul Siebert for their useful and constructive feedback and recommendations regarding this thesis. Also, I would like to thank my friends at the Dependable Systems Group (DSG) at Heriot-Watt University Dr. Khari Armih, Dr. Mustafa Aswad, and Dr. Rob Stewart for their advice and valuable technical support.
I would also like to extend my thanks to the computing officers at Heriot-Watt University for their support and allowing hardware access for the performance evalua-tion of HdpHProf and the critical analysis study.
I would like to thank King Faisal University and the Ministry of Higher Education in Saudi Arabia for offering me this scholarship. Also I would like to thank them for providing the finance support throughout the years of study for me and my family.
Last, but by no means least, a special thanks to my family. Words cannot
express how grateful I am to my father, my wife, my daughters, and my son for all of the sacrifices that you have made on my behalf. Your prayers for me were what has sustained me thus far.
I declare that, except where explicit reference is made to the contribution of others, that this dissertation is the result of my own work and has not been submitted for any other degree at the University of Glasgow or any other institution.
1 Introduction 16
1.1 Thesis Statement . . . 17
1.2 Contributions . . . 17
1.3 Authorship and Publications . . . 19
2 Background 20 2.1 Parallel Architectures . . . 21
2.1.1 Shared-Memory Architectures . . . 21
2.1.2 Distributed-Memory Architecture . . . 22
2.2 Parallel Programming Models . . . 23
2.2.1 Shared-Memory Parallelism . . . 24
2.2.2 Distributed-Memory Parallelism . . . 24
2.2.3 Parallel Functional Languages . . . 25
2.2.4 HdpH . . . 26
2.3 Parallel Performance Analysis . . . 28
2.3.1 Performance Profiling Process . . . 29
2.4 Parallel Profilers . . . 33
2.4.1 Imperative Profiling . . . 33
2.4.2 Functional Profilers . . . 36
2.5 Summary . . . 40
3 A Survey of Parallel Functional Profilers 41 3.1 Experimental Methodology . . . 42
3.1.1 Experimental Set-up . . . 42
3.1.2 Concordance Benchmark Versions . . . 43
3.1.3 Experiments . . . 43
3.2.2 Profiling Data Size in Relation to Number of Processing Elements
(PEs) . . . 47
3.2.3 Profiling Data Size Discussion . . . 51
3.3 Runtime Overheads of Profiling . . . 53
3.3.1 Runtime Overhead in Relation to Computation Size . . . 54
3.3.2 Profiling Overhead in Relation to Number of PEs . . . 57
3.3.3 Runtime Overhead Discussion . . . 61
3.4 Data Presentation and Visualisation . . . 63
3.4.1 Programming Model . . . 63
3.4.2 Presentation of Performance Data . . . 63
3.4.3 Software Properties . . . 64
3.4.4 Usability . . . 66
3.4.5 Discussion . . . 66
3.5 Related Work . . . 67
3.6 Summary . . . 68
4 HdpHProf– Design and Implementation 70 4.1 HdpHProf Requirements . . . 70
4.2 HdpHProf Implementation Design . . . 71
4.2.1 HdpH Trace Events . . . 72
4.2.2 Multiple Trace Files . . . 74
4.2.3 Time Synchronisation . . . 75
4.2.4 Merging Trace Files . . . 76
4.2.5 Trace Visualisation . . . 77
4.2.6 Trace Analysis and Presentation . . . 77
4.3 HdpHProf Implementation . . . 80
4.3.1 Data Collection . . . 80
4.3.2 Data Analysis . . . 83
4.3.3 Trace File Time Synchronisation . . . 86
4.3.4 Merging Trace Files . . . 87
4.3.5 Data Presentation . . . 88
5.1 Experimental Tools and Benchmarks . . . 93
5.2 Validation of Functional Correctness . . . 95
5.2.1 Code Instrumentation . . . 96
5.2.2 Time Synchronisation in Trace Files . . . 96
5.2.3 Merging Trace Files . . . 97
5.2.4 Contention Analysis Tools . . . 98
5.3 Scalability . . . 105
5.4 Profiling Data Size . . . 108
5.4.1 Profiling Data Size vs Computation Size . . . 108
5.4.2 Profiling Data Size vs Number of PEs . . . 111
5.4.3 Profiling Data Size Comparison and Discussion . . . 113
5.5 Execution Time Overhead . . . 114
5.5.1 Runtime Overhead vs Computation Size . . . 114
5.5.2 Runtime Overhead vs Number PEs . . . 117
5.5.3 Runtime Overhead Discussion . . . 119
5.6 HdpH Tracing Overhead . . . 120
5.7 Summary . . . 122
6 Evaluating HdpHProf for Applications 123 6.1 Experimental Methodology . . . 123
6.1.1 Experimental Set-up . . . 123
6.1.2 Experiments . . . 123
6.2 Identification of Performance Problems . . . 125
6.2.1 Excessively Small Thread Granularity . . . 125
6.2.2 Excessively Large Thread Granularity . . . 126
6.2.3 Sequentialisation bottleneck . . . 127
6.2.4 Insufficient Work for Machine Architecture . . . 129
6.2.5 Combination of factors . . . 131
6.3 Tuning Thread Granularity . . . 132
6.3.1 Data Parallel Chunk Size . . . 132
6.3.2 Divide and Conquer Threshold . . . 136
6.4 Co-location and Sequential Granularity . . . 138
6.4.4 Coarse Grained Tasks . . . 142
6.4.5 Discussion . . . 144
6.5 Summary . . . 144
7 Evaluating HdpHProf for HdpH Internals 146 7.1 Spark Pool Contention . . . 146
7.1.1 Spark Management . . . 147
7.1.2 Experiments . . . 148
7.1.3 Conflict Ratio . . . 148
7.1.4 Conflict Duration . . . 149
7.1.5 Mean Conflict Duration . . . 149
7.1.6 Maximum Conflict Duration . . . 150
7.1.7 Grouping Conflicts by Schedulers . . . 151
7.2 Spark Pool Contention and Granularity . . . 153
7.2.1 Experiments . . . 154
7.2.2 Conflict Ratio and Granularity . . . 155
7.2.3 Conflict Duration and Granularity . . . 155
7.2.4 Contention and Granularity Discussion . . . 156
7.3 Registry Contention . . . 156
7.3.1 Global References and Global IVars . . . 157
7.3.2 Experiments . . . 157
7.3.3 Conflict Ratio . . . 158
7.3.4 Total Conflict Duration . . . 159
7.3.5 Mean Conflict Duration . . . 160
7.3.6 Maximum Conflict Duration . . . 161
7.3.7 Conflicts By Operation Type . . . 162
7.3.8 Variability in Execution Time . . . 166
7.3.9 Registry Implementations Discussion . . . 168
7.4 Summary . . . 169
8 Conclusion 170 8.1 Summary . . . 170
8.2 Limitations . . . 173
3.1 Compilers and Profiling Tools. . . 42
3.2 Minimum, Mean, and Maximum Profiling Data Sizes (on 4 PEs). . . . 53
3.3 Minimum, Mean, and Maximum Relative Runtime Overheads (on 4 PEs). 62 3.4 Synopsis of Visualisation Tools. . . 64
4.1 HdpH Trace Events. . . 73
5.1 Compilers and Profiling Tools. . . 94
5.2 HdpH Benchmarks. . . 94
5.3 Spark Pool Contention Analysis Profile Functionality Test. . . 102
5.4 Registry Contention Analysis Profile Functionality Test. . . 105
5.5 Eventlog, GHC vs HdpH Trace Events. . . 121
6.1 Fibonacci Co-loc. and Seq. thresholds settings. . . 139
6.2 Analysis of Fibonacci Co-loc. and Seq. Granularity Settings. . . 144
7.1 Parameters of Fibonacci Benchmark. . . 155
2.1 An SMP Architecture . . . 21
2.2 A NUMA Architecture . . . 22
2.3 A Distributed Memory Architecture . . . 23
2.4 Performance Profiling Process Workflow. . . 29
2.5 Sampling of Performance Data. . . 30
2.6 Tracing Performance Data. . . 31
2.7 Collecting Tracing Data. . . 31
2.8 Visualising Tracing Data. . . 32
2.9 Some ParaGraph displays [51] . . . 34
2.11 ompP Profile for Parallel Section. . . 35
2.10 mpiP profile Header and MPI Time Sections. . . 35
2.12 Screenshot of Vampir Visualising a Score-P Trace File. . . 36
2.13 An example GranSim overall activity [78] . . . 37
2.14 Screenshot of EdenTV Visualising an Eden Trace File. . . 38
2.15 Work Flow model of the GHC-PPS. . . 39
2.16 Screenshot of ThreadScope Visualising a GHC Trace File. . . 39
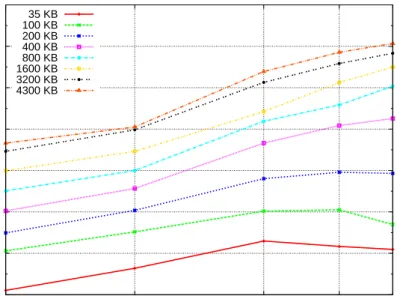
3.1 Score-P (MPI) Profiling Data Size in Relation to Input Size. . . 44
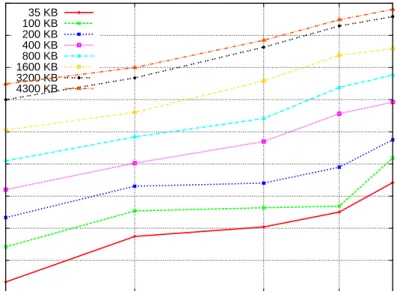
3.2 Eden Tracing Profiling Data Size in Relation to Input Size. . . 45
3.3 Score-P (OpenMP) Profiling Data Size in Relation to Input Size. . . 45
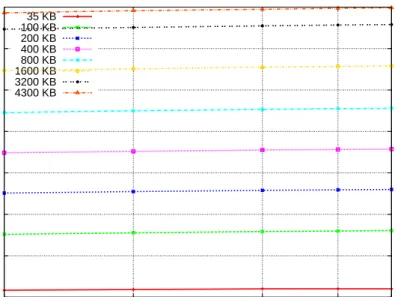
3.4 GHC-PPS Profiling Data Size in Relation to Input Size. . . 46
3.5 mpiP Profiling Data Size in Relation to Input Size. . . 47
3.6 ompP Profiling Data Size in Relation to Input Size. . . 47
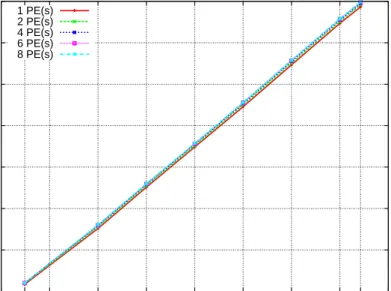
3.7 Score-P (MPI) Profiling Data Size in Relation to Number of PEs. . . . 48
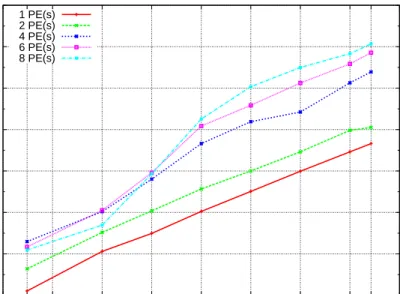
3.8 Eden Tracing Profiling Data Size in Relation to Number of PEs. . . 49
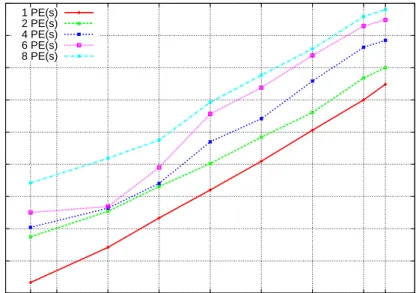
3.9 Score-P (OpenMP) Profiling Data Size in Relation to Number of PEs. . 49
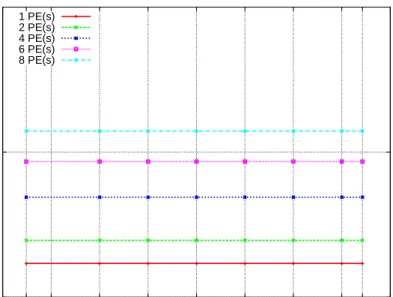
3.12 ompP Profiling Data Size in Relation to Number of PEs. . . 51
3.13 Synopsis of Profiling Data Sizes in Relation to Input Size (on 4 PEs). . 52
3.14 Score-P (MPI) Runtime Overhead in Relation to Input Size. . . 54
3.15 Eden Tracing Runtime Overhead in Relation to Input Size. . . 54
3.16 Score-P (OpenMP) Runtime Overhead in Relation to Input Size. . . 55
3.17 GHC-PPS Runtime Overhead in Relation to Input Size. . . 56
3.18 mpiP Runtime Overhead in Relation to Input Size. . . 56
3.19 ompP Runtime Overhead in Relation to Input Size. . . 57
3.20 Score-P (MPI) Runtime Overhead in Relation to Number of PEs. . . . 58
3.21 Eden Tracing Runtime Overhead in Relation to Number of PEs. . . 58
3.22 Score-P (OpenMP) Runtime Overhead in Relation to Number of PEs. . 59
3.23 GHC-PPS Runtime Overhead in Relation to Number of PEs. . . 59
3.24 mpiP Runtime Overhead in Relation to Number of PEs. . . 60
3.25 ompP Runtime Overhead in Relation to Number of PEs. . . 60
3.26 Synopsis of Relative Runtime Overheads in Relation to Input Size (on 4 PEs.) . . . 61
4.1 HdpHProf Work Flow Model. . . 72
4.2 Generating, Synchronising and Merging Multiple Trace Files. . . 74
4.3 Design of HdpHProf Time Synchronisation Process. . . 76
4.4 Spark Pool Conflicts. . . 79
4.5 Registry Conflicts. . . 80
4.6 Spark Pool Contention Analysis Profile. . . 89
4.7 Registry Contention Analysis Profile. . . 91
4.8 TheadScope visualises HdpH Fibonacci 40 threshold 30 on 4 nodes 2 cores each (total cores 8). . . 91
5.1 Test of HdpHProf Time Synchronisation Function. . . 97
5.2 Eventlogs Before Synchronisation and Merging. . . 98
5.3 Eventlog After Merging. . . 99
5.4 Spark Pool Contention Analysis Profile. . . 101
5.5 Registry Contention Analysis Profile. . . 104
5.6 Fibonacci 50 Thresholds Co-loc. 34 Seq. 16. . . 106
5.9 Mandelbrot Profiling Data Size vs Computation Size. . . 109
5.10 Fibonacci Profiling Data Size vs Computation Size. . . 110
5.11 SumEuler Profiling Data Size vs Computation Size. . . 110
5.12 Queens Profiling Data Size vs Number of PEs. . . 111
5.13 Mandelbrot Profiling Data Size vs Number of PEs. . . 112
5.14 Fibonacci Profiling Data Size vs Number of PEs. . . 112
5.15 SumEuler Profiling Data Size vs Number of PEs. . . 113
5.16 Queens Runtime Overhead in Relation to Computation. . . 115
5.17 Mandelbrot Runtime Overhead in Relation to Computation. . . 115
5.18 Fibonacci Runtime Overhead in Relation to Computation. . . 116
5.19 SumEuler Runtime Overhead in Relation to Computation. . . 116
5.20 Queens Runtime Overhead vs Number of PEs. . . 117
5.21 Mandelbrot Runtime Overhead vs Number of PEs. . . 118
5.22 Fibonacci Runtime Overhead vs Number of PEs. . . 118
5.23 SumEuler Runtime Overhead vs Number of PEs. . . 119
5.24 Stacked view GHC vs HdpH Trace Events. . . 121
6.1 Summatory Liouville 10,000,000 Chunk Size 10,000 (24 Cores). . . 125
6.2 SumEuler [10000-42000] Chunk Size 800 (24 Cores). . . 126
6.3 nBody 2048 Steps 8 Chunk Size 64 (24 Cores). . . 128
6.4 Zoomed in nBody 2048 Steps 8 Chunk Size 64 (24 Cores). . . 129
6.5 SumEuler [10000-42000] Chunk Size 400 (96 Cores). . . 130
6.6 Summatory Liouville 10,000,000 Chunk Size 100,000 (96 Cores). . . 131
6.7 Queens 13 Chunk Size 1600 (24 cores). . . 133
6.8 Summatory Liouville 10,000,000 Chunk Size 1,000 (24 Cores). . . 134
6.9 Summatory Liouville 10,000,000 Chunk Size 100,000 (24 Cores). . . 135
6.10 Summatory Liouville 10,000,000 Chunk Size 300,000 (24 Cores). . . 135
6.11 Mandelbrot X=4096 Y=4096 Depth=1024 Threshold 0 (24 Cores). . . 137
6.12 Mandelbrot X=4096 Y=4096 Depth=1024 Threshold 4 (24 Cores). . . 137
6.13 Mandelbrot X=4096 Y=4096 Depth=1024 Threshold 10 (24 Cores). . . 138
6.14 Fibonacci 45 Co-loc. 30 Seq. 5 (Small, Small) (24 Cores). . . 140
6.15 Fibonacci 45 Co-loc. 35 Seq. 5 (Appr., Small) (24 Cores). . . 140
6.16 Fibonacci 45 Co-loc. 40 Seq. 5 (Large, Small) (24 Cores). . . 140
6.19 Fibonacci 45 Co-loc. 35 Seq. 33 (Appr., Large) (24 Cores). . . 142
6.20 Fibonacci 45 Co-loc. 40 Seq. 19 (Large, Appr.) (24 Cores). . . 143
6.21 Fibonacci 45 Co-loc. 40 Seq. 33 (Large, Large) (24 Cores). . . 143
7.1 HdpH System architecture [84]. . . 147
7.2 Spark Pool Conflict Ratios. . . 149
7.3 Spark Pool Conflict Durations. . . 150
7.4 Spark Pool Mean Conflict Duration. . . 150
7.5 Spark Pool Maximum Conflict Duration. . . 151
7.6 Conflicts Grouped by No. Schedulers involved (3 Schedulers). . . 152
7.7 Conflicts Grouped by No. Schedulers involved (5 Schedulers). . . 152
7.8 Conflicts Grouped by No. Schedulers involved (7 Schedulers). . . 152
7.9 Conflict Ratio and Granularity. . . 156
7.10 Conflict Duration and Granularity. . . 157
7.11 Registry Contention Analysis: Conflict Ratio. . . 158
7.12 Registry Contention Analysis: Conflict Duration. . . 159
7.13 Registry Contention Analysis, Mean Conflict Duration. . . 160
7.14 Registry Contention Analysis, Maximum Conflict Duration. . . 161
7.15 Conflicts Between Globalise Operations. . . 163
7.16 Conflicts Between Free Operations. . . 164
7.17 Conflicts Between Dereference Operations. . . 165
7.18 Conflicts Between Mixture Operations. . . 166
API Application Programming Interface.
ASCII American Standard Code for Information Interchange.
COTS Commercial Off-The-Shelf.
DSL Domain Specific Language.
GHC Glasgow Haskell Compiler.
GHC-ELF GHC EventLog Format.
GHC-PPS GHC Parallel Profiling System.
GHC-SMP GHC on a Shared-Memory Multiprocessor.
GpH Glasgow Parallel Haskell.
GUI Graphical User Interface.
HdpH Haskell Distributed Parallel Haskell.
HEC Haskell Execution Context.
HPC High-Performance Computing.
MIMD Multiple Instruction Multiple Data.
MISD Multiple Instruction Single Data.
MPI Message Passing Interface.
NUMA Non-Uniform Memory Access.
OTF Open Trace Format.
PE Processing Element.
PVM Parallel Virtual Machine.
RTS Runtime System.
SDDF Self-Describing Data Format.
SICSA Scottish Informatics and Computer Science Alliance.
SIMD Single Instruction Multiple Data.
SISD Single Instruction Single Data.
SMP Shared-Memory Multiprocessor.
TSO Thread State Object.
Introduction
The manycore revolution has both made parallelism mainstream, and sparked inter-est in functional languages. The underlying memory model has a big influence on parallel languages: in shared-memory languages computations can share state, but in a distributed-memory language computations must communicate any common state. The increasing demand for parallel machines to solve larger problems raises the need for advanced performance analysis tools to help programmers effectively and efficiently optimise parallel applications [42].
Performance analysis and tuning for parallel environments is important due to the complexity of parallel technology [51, 30], and presents more challenges than on a sequential machine [145]. Profiling is a key element of effective parallel programming and performance optimisation: it is essential that the programmer understands the parallel behaviour in order to improve it [146, 98, 6, 20].
In languages that provide high-level parallelism, like most parallel functional lan-guages, profiling is especially important. The high level abstraction means that the conceptual gap between the program and its execution on the hardware is greater [122]. Therefore, language implementers and programmers must have a profiler to help un-derstand parallel behaviour and identify performance bottlenecks in the implementa-tion [54, 35, 66].
This thesis investigates a new approach to constructing profiling infrastructure for parallel Domain Specific Languages (DSLs), namely using host language profiling tools to construct an effective and efficient profiling tool for a parallel DSL.
Specifi-cally, Haskell Distributed Parallel Haskell (HdpH) is a distributed-memory parallel
DSL [84, 82] that is built solely on the standard Glasgow Haskell Compiler (GHC) [46] runtime. We present the design, implementation, validation and evaluation of
Hd-pHProf, an execution profiler, i.e. time profiler, for the DSL HdpH constructed from Haskell profiling tools.
1.1
Thesis Statement
This thesis investigates whether it is possible to profile parallel DSLs using existing host language profiling tools. The key challenge is that the host language tools report the performance of the DSL Runtime System (RTS), executing the application rather than the performance of the DSL application. The key questions are as follows: can a correct, effective and efficient profiler be constructed using host language profiling tools for applications written in the parallel DSL? Is it possible to construct a correct, effective and efficient profiler to tune the parallel DSL implementation? What capabilities of the host language profiling tools facilitate parallel DSL profiling? Can shared-memory profiling tools be extended to work effectively for a distributed-memory parallel DSL?
1.2
Contributions
This thesis investigates how to use commodity pre-existing profiling tools for a host language to profile the performance of a distributed-memory parallel DSL. The main contribution is to develop, validate and evaluate a new profiler, HdpHProf, for a distributed-memory parallel functional DSL, i.e. HdpH which runs on a Beowulf cluster of multicore. The thesis makes the following research contributions:
1. We report a critical analysis of parallel functional profilers [4, 5], comparing two functional profilers, GHC Parallel Profiling System (GHC-PPS) with its trace viewer ThreadScope [67, 134] and EdenTV [11]; alongside four important imper-ative profilers, i.e. Vampir [139], Score-P [124], mpiP [141], and ompP [37]. The comparison is based on the SICSA Concordance benchmark [23], covers both shared and distributed-memory parallel languages, and is performed on com-mon parallel architectures. We compare the runtime overheads and amount of profiling data generated by the profilers, analysed by whether the parallelism is shared/distributed memory and whether the profiler is imperative/functional, and tracing/summative. We systematically compare the profilers for usability and data presentation (Chapter 3).
2. We investigate the feasibility of constructing an effective profiler for a distributed-memory parallel DSL using the host language profiling tools. We do so by design-ing and implementdesign-ing HdpHProf [3], a post mortem, multi-stage, and extensible profiler for a distributed-memory Haskell parallel DSL (HdpH). HdpHProf re-quires no changes to the host language (GHC) unlike EdenTV [11], nor to the HdpH programs that are profiled. Importantly, the implementation uses several new GHC features including the GHC-Events Library and ThreadScope, to build profiling infrastructure for a parallel DSL. We introduce two novel analysis tools
for monitoring HdpH internals, i.e. Spark Pool Contention Analysis and Registry
Contention Analysis (Chapter 4).
3. We validate HdpHProf for functional correctness and characterise its perfor-mance. We ascertain that HdpHProf works correctly and accurately records the behaviour of parallel programs. Also, we validate HdpHProf for scalability by us-ing 5 HdpH benchmarks to show that it can scale to profile applications runnus-ing on a large number of cores (192 cores on 32 cluster nodes). We characterise the performance of HdpHProf in terms of data size and execution runtime overhead, depending on computation size and the number of Processing Elements (PEs) as in [4]. We show that HdpHProf retains the low time and space overheads of the GHC-PPS. Moreover, profiling the parallel DSL occupies less than 2.2% of tracing overheads of GHC-PPS, unless thread granularity is excessively small (Chapter 5).
4. We show that an effective and efficient DSL profiler (HdpHProf) can be con-structed for applications using host language profiling tools. We use HdpHProf to identify performance issues and to tune the thread granularity of six HdpH benchmarks. We demonstrate how to identify performance problems in execution behaviour of HdpH applications with different parallel paradigms, e.g. divide and conquer, flat data parallel, and nested data parallel. This includes problems such as too small/large thread granularity, problem size too small for the parallel ar-chitecture, synchronisation bottlenecks, and combinations of these factors. We demonstrate how HdpHProf can be used to tune thread granularity in HdpH applications (Chapter 6).
5. We show that an effective and efficient profiler can be constructed to tune the par-allel DSL implementation (i.e. the HdpH RTS) using the host language profiling
tools. We do so by using HdpHProf analysis tools to investigate the behaviour of
HdpH RTS. The Spark Pool Contention Analysis tool reveals, for example, how
the spark pool implementation behaves during high concurrent access demand and how contention changes with task granularity. We present how appropriate task granularity can significantly reduce contention on the spark pool by more
than 97%. We use theRegistry Contention Analysis tool to evaluate three
alter-native registry implementations. This shows how HdpHProf can identify different execution behaviours for the different implementations which can help debug or improve the parallel DSL implementation (Chapter 7).
1.3
Authorship and Publications
Parts of this thesis are closely based on the work reported in the following papers:
• HdpHprof— A Profiler for Haskell Distributed Parallel Haskell [3]. In
The Draft Proceedings of the Symposium on Trends in Functional Programming (TFP12), St Andrews, Scotland, 2012. With Patrick Maier, Phil Trinder and Lilia Georgieva. The paper presents the initial design and implementation of HdpHProf and shows preliminary profiling results of HdpH’s programs run on a Beowulf cluster comprising 32 8-cores nodes.
• A Critical Analysis of Parallel Functional Profilers[4]. InThe Draft Pro-ceedings of The 25th symposium on Implementation and Application of Functional Languages(IFL13), Radboud University Nijmegen, The Netherlands, 2013. With Patrick Maier, Phil Trinder and Lilia Georgieva. This paper presents an evalua-tion of two parallel Haskell profilers, GHC-PPS and EdenTV, in comparison with four important profilers for imperative languages. The comparison covers both shared and distributed memory parallel languages, and is performed on common parallel architectures. The comparison uses a published benchmark, namely the Concordance application set as the first Multicore Challenge [23]. We compare the amount of profiling data generated by the profilers analysed by whether the parallelism is shared/distributed memory and whether the profiler is imperative/-functional, and tracing/summative. We investigate the runtime overheads of the profilers, again analysed by whether the parallelism is shared/distributed mem-ory and whether the profiler is imperative/functional, and tracing/summative. Also, we systematically compare the profilers for usability and data presentation.
Background
Parallelism has become the norm in commodity computers. Unfortunately developing applications for parallel computers is more difficult than developing software for sequen-tial computers, hence it consumes more time and money [110]. A parallel programmer must specify additional coordination aspects, such as how to divide load among dif-ferent processors, and how these processors communicate and synchronise. Moreover, parallelism makes debugging and optimisation of programs more complicated and error prone [74, 34, 147].
To get good performance, tools for performance analysis and tuning of parallel programs are crucial to give programmers an insight about the execution behaviour and assistance in identifying performance problems [97, 51]. Performance tools help programmers identify performance bottlenecks and under-utilisation of computing re-sources. Every mainstream parallel programming language, such as C with MPI and/or OpenMP, has one or more performance analysis tools, e.g. Seecube [25], HyperView [86], Pablo toolkit [115], and ParaGraph [60].
This chapter surveys the state of the art of parallel computer architectures, par-allel programming models, and performance analysis of parpar-allel programs. We present parallel computer systems depending on the physical memory organization:
shared-memory and distributed-shared-memory (Section 2.1). We discuss parallel programming
models (Section 2.2). We discuss ways of profiling performance of parallel programs and explain what makes profiling distributed-memory programs different from shared-memory programs (Section 2.3). We present state-of-the-art performance analysis tools for imperative languages such as C/C++ with MPI and/or OpenMP, and high-level functional parallel Haskells (Section 2.4).
BUS
Memory
CPU CPU CPU CPU
Figure 2.1: An SMP Architecture
2.1
Parallel Architectures
Parallel architectures can be classified according to the machine’s instruction and data streams as in Flynn’s taxonomy [31, 32]. He identified four categories of architecture: SISD (e.g. uni-core), SIMD (e.g. vector processor), MISD (e.g. systolic array), and MIMD (e.g. multicore). Today most general-purpose parallel computers are based on MIMD [112]. MIMD is too broad to be useful on its own so it is split into two classes of parallel systems according to memory organisation, shared-memory, and distributed-memory [92].
2.1.1
Shared-Memory Architectures
All the processors in a shared memory system share a single physical or logical address space and communicate with each other by reading and writing variables from the shared-memory. Shared-memory systems could be divided further into two categories based on how the memory is accessed by the processors, i.e. Uniform Memory Access (UMA), and Non-Uniform Memory Access (NUMA).
UMA. Uniform Memory Access (UMA) is a class of shared-memory systems where
the cost of accessing memory is the same for all collaborating processors.
Shared-Memory Multiprocessor (SMP) is one form of the UMA shared memory systems in which all processors can access all the memory locations at equal speed via a shared bus [110]. Figure 2.1 depicts a SMP architecture. SMP is considered attractive and easy to program because of the convenience of sharing data among processors [144]. On the other hand, SMP is not scalable beyond a relatively small number of processors because increasing the number of processors causes contention on the bus [92].
L1 Cache Memory CPU L1 Cache Memory CPU L1 Cache Memory CPU L1 Cache Memory CPU Logical Address Space
Figure 2.2: A NUMA Architecture
cores” are implemented within a single processor. The cores reside in a single die and are considered as individual processors which have their own set of execution and architectural resources [1]. Multicore systems, may, or may not, share a large on-chip L2 cache between cores. Multicore systems are more efficient than the SMP since the cores share the L2 cache, reducing the memory bandwidth bottleneck and communication problem. As with SMP, multicore systems’ scalability is limited [29].
NUMA. Non-Uniform Memory Access (NUMA) is another class of shared-memory systems in which all processors share a memory which is nonuniformly addressable for them, where some processors may physically reside more closely in some memory blocks than other processors. The access time for data in the memory can vary considerably depending upon whether the data is located in the local memory of the processor, or the local memory of another processor [110]. Figure 2.2 depicts a shared memory NUMA architecture. Unlike the SMP the NUMA is more scalable because of the lower memory bandwidth bottleneck involved. On the contrary, the time it takes to access location on the memory could vary considerably from one processor to another depending on how far the memory is from the processor [92].
2.1.2
Distributed-Memory Architecture
Each processor in a distributed-memory architecture has its own memory and typically communicates with other processors by sending and receiving messages. Figure 2.3 de-picts a distributed-memory architecture [92, 110]. The speed of distributed systems depends not only on the speed of CPUs but also on the speed and topology of the
Memory CPU Interconnect network Memory CPU Memory CPU Memory CPU
Figure 2.3: A Distributed Memory Architecture
network. Most importantly, in distributed systems it is more probable that the pro-grammer will be responsible for explicitly specifying all the communication between processors, and specifying the distribution of data [92]. We will discuss the ubiqui-tous cluster and hybrid architectures used later in the thesis, but will not discuss Grid [33, 18], cloud technologies [26, 27] or the more exotic manycore [22, 81] .
Cluster Computing. A cluster [92, 121] is a set of computers connected with each other by some networking technology, e.g. Ethernet. Beowulf clusters [127, 119] are constructed by networking Commercial Off-The-Shelf (COTS) nodes, typically running free to use operating system and software packages, e.g. Linux and MPI/PVM libraries. Beowulf clusters are powerful and inexpensive compared with High-Performance Com-puting (HPC) architectures [118].
Hybrid Architectures. Hybrid systems are built by combining shared-memory and distributed-memory technology. When a cluster is built of shared-memory nodes, e.g. multicores –which is probably the most common platform for PCs and workstations these days– the cluster is considered a hybrid parallel system. Cores in each separate node can communicate through passing pointers to shared-memory regions. On the other hand, message-passing is used for communication between nodes within the clus-ter. We will profile parallel programs running on a hybrid Beowulf cluster of multicores in Chapter 6.
2.2
Parallel Programming Models
To program a parallel computing architecture programmers need a programming model that allows the design and implementation of parallel applications. Moreover, pro-gramming languages, tools, and environments are essential elements for designing and
implementing parallel applications [130]. To make it possible for programmers to build and run parallel programs they need a set of tools, features, and an Application Pro-gramming Interface (API) [92].
According to Rauber and R¨unger [113] a parallel programming model ”specifies
the programmers view on the parallel computer by defining how the programmer can code an algorithm. This view is influenced by the architectural design and the language, compiler, or the runtime libraries.” Unlike in sequential programming there are many possible parallel programming models, depending on the architecture of the parallel machine [130, 92]. This makes it hard for programmers to write portable programs. The most commonly used models for parallel programming are the shared-memory, distributed-memory, or hybrid models.
There are many programming languages and environments for parallel program-ming [92]. Here we only present the two parallel programprogram-ming environments most widely used by the parallel programming community, i.e. OpenMP [101] for shared-memory, and Message Passing Interface (MPI) [95] for distributed-memory. In addi-tion, we will discuss high-level functional parallel languages.
2.2.1
Shared-Memory Parallelism
OpenMP [101] is a model for shared-memory architectures that currently support For-tran, C, and C++ on Linux and Windows platforms. OpenMP is mostly used by adding a compiler directive around a loop to add parallelism to sequential code where the com-piler takes care of the majority of the detailed thread creation and management [92]. OpenMP is the most widely used communication standard in shared-memory program-ming in parallel computing [15].
2.2.2
Distributed-Memory Parallelism
The Message Passing Interface (MPI) [95] is a standard message passing library used for distributed-memory architectures where processes do not share data. There are multiple implementations of the MPI specification in the form of libraries that pro-vide functions, subroutines, and methods for languages, e.g. Fortran, C, and C++. Moreover, it is supported in a variety of HPC and commodity clusters [110]. Pro-gramming distributed-memory machines with MPI is difficult because the programmer must specify the data distribution and inter-process communication between processes
using messages [92]. MPI is probably the most widely used communications standard for programming distributed-memory parallel applications [15].
2.2.3
Parallel Functional Languages
This section discusses parallel implementations of the general purpose lazy functional programming language Haskell [58]. We will focus on Haskell and not discuss other
functional languages e.g. Erlang [7] and ML [143] because we will profile Haskell
DSLs. Haskell is different from most current languages that are closely related to the underlying hardware, where programming is based upon the concept of changing stored values. Instead, Haskell promotes a programming style with higher level of abstraction, based upon the idea of applying functions to arguments [65]. Haskell is a functional computation language that is the base for a range of parallel and distributed languages [135]. We will outline various Haskell extensions for parallel and distributed programming.
Shared-Memory Haskells
GpH. Glasgow Parallel Haskell (GpH) [136] is an extension of Haskell that provides
parallelism and keeps the programmer away from the details of the parallel execu-tion. GpH provides semi-explicit parallelism with little programmer control of parallel behaviour where the compiler and the runtime system do most of the work. The
pro-grammer only writes the parallel algorithm and explicitly controls some aspects of the
parallel algorithm. There are two available implementations for GpH: GHC-SMP [90] for shared-memory, and GUM [138] for distributed-memory. Evaluation strategies, i.e. coordination abstractions, have been introduced [137, 88] to specify parallelism (evaluation order and degree) at a higher level (e.g. parallel data structures).
GHC-SMP. GHC on a Shared-Memory Multiprocessor (GHC-SMP) [57, 90] is a present full-scale implementation of shared-memory parallel Haskell based on the GHC. GHC-SMP provides lightweight parallel evaluation and deterministic parallelism: the parallel program has the same semantics as the sequential program. The GHC-SMP runtime can support explicit thread-based parallelism [106] and semi-explicit determin-istic parallelism [137].
Parallel Monad. ParMonad [89] is a programming model for deterministic parallel computation in Haskell that provides monadic control of parallelism and retains
deter-minism and purity. Furthermore,Par Monad’s work-stealing scheduler allows it to lift
system-level functionality to the Concurrent Haskell level. Despite this, performance
results show that Par Monad keeps performance overhead at a level comparable with
other parallel programming models in Haskell.
Distributed-Memory Haskells
Eden. Eden [12, 80] is a Haskell extension for distributed-memory parallelism. Eden provides a high-level of abstraction for parallel programming by controlling the par-allel evaluation of processes. Processes in Eden can by defined explicitly; meanwhile communication between the processes remains implicit. Eden provides a rich library of predefined skeletons that cover many common patterns of parallel algorithms, e.g. parallel divide-and-conquer, and parallel map. Eden programmers can choose or adapt one of these skeletons for the problem at hand instead of writing programs from scratch. Eden provides dynamic load balancing by its replicated workers’ skeleton which fre-quently gives better performance than purely static schemes such as tasks farms.
Cloud Haskell. Cloud Haskell [28] is a new domain-specific (cloud computing) lan-guage which is shallowly embedded in Haskell for distributed-memory parallelism. Cloud Haskell has been influenced by the successful message-passing model used in Erlang [7] along with the purity, types, and monads of Haskell. A message-passing communication model is provided in Cloud Haskell. Unlike Eden, Cloud Haskell con-tributes a new method for serialising functions’ closures to be transferred over the network with no need to extend the compiler or the runtime system.
2.2.4
HdpH
Haskell Distributed Parallel Haskell (HdpH) [84, 83] that is profiled in the reminder of the thesis is a new Haskell embedded DSL for distributed-memory parallelism. It provides semi-explicit parallelism i.e. the programmer specifies only a few key par-allelism aspects, e.g. the creation of tasks. HdpH scales to run on HPC, e.g. the 90K core HECToR supercomputer [63]. HdpH is designed to not rely on a bespoke low-level runtime system. Like Cloud Haskell it requires no more than GHC, primarily to minimise the language maintenance effort. HdpH is implemented in a modular and
layered approach and, importantly, coded in vanilla Concurrent Haskell [106]. As this thesis presents the design, implementation and evaluation of a profiler (HdpHProf) for HdpH, in Chapters 4, 5, 6 and 7 this section gives an overview of HdpH.
Listing 2.1: HdpH Primitives [84].
1 data Par a −− Par monad
2 e v a l : : a −> Par a 3
4 f o r k : : Par ( ) −> Par ( ) 5
6 data IVar a −− b u f f e r s
7 new : : Par ( IVar a )
8 put : : IVar a −> a −> Par ( )
9 g e t : : IVar a − Par a 10 11 data NodeId −− e x p l i c i t l o c a t i o n s 12 a l l N o d e s : : Par [ NodeId ] 13 14 data C l o s u r e a −− e x p l i c i t , s e r i a l i s a b l e c l o s u r e s 15 s p a r k : : C l o s u r e ( Par ( ) ) −> Par ( )
16 pushTo : : C l o s u r e ( Par ( ) ) −> NodeId − Par ( ) 17
18 data GIVar a −− g l o b a l h a n d l e s t o I V a r s
19 g l o b : : IVar ( C l o s u r e a ) −> Par ( GIVar ( C l o s u r e a ) ) 20 r p u t : : GIVar ( C l o s u r e a ) −> C l o s u r e a −> Par ( ) 21 a t : : GIVar ( C l u s u r e a ) −> NodeId
Listing 2.1 illustrates the basic primitives that the programmer can use to express parallelism in HdpH. The lines from 1 to 9 show the shared-memory primitives, and
in lines 11 to 21 are the distributed-memory primitives. The Par type constructor is
used to encapsulate a parallel computation. The fork primitive creates a new thread
and returns nothing, and is used for generating shared-memory parallelism. IVars are
mutable variables (writable exactly once) used by threads to communicate computa-tional results. There are three operations that allow the programmer from accessing
IVars: creating new one (new), blocking read (get), and write (put). The put does
not normalise its argument hence the eval primitive is used, instead, to evaluate an
expression to weak-head normal form.
HdpH support distributed-memory parallelism with abstract data types for ex-plicit locations, exex-plicit closures, and global IVars. To generate distributed-memory
parallelism HdpH exposes to the programmer the basic primitives spark and pushTo.
The spark generates computation (called a spark), a future computation that may be executed on different node. A created spark resides in a spark pool and waits to be
distributed or scheduled by an on-demand work-stealing scheduler. The pushTo
prim-itive is similar to spark but eagerly sends a computation to a target node for instant
execution.
HdpH retrieves the results of remote distributed computations by using global
read. Global IVars are exposed to the programmer by three operations: create new
one (glob) by globalising a local IVar, remote write (rput), and location information
(at) of the underlying IVar. The operations restrict the base type of their underlying
IVars to closures to ensure the serialisability of the values that the rput writes. All
transported values between nodes both computation and results are closures which means that a result might be again a computation.
The following example and descriptive text are closely based on [84]. Listing 2.2
shows an HdpH Fibonacci program (dpfib) that employs the HdpH primitives, and
can be executed on shared or distributed memory architectures using the HdpH
im-plementation. The program must globalise the IVar v, yielding global IVar gv, and
wrap the first recursive call in an explicit closure generated by the Template Haskell
splice$(mkClosure [|...|]), before sparking. Also, it must convert the result of the
sparked computation to an explicit closure with toClosure before writing to gv, and
that closure must be eliminated again with unClosure before adding the results of
both recursive calls.
Listing 2.2: HdpH Fibonacci Program [84].
1 d p f i b : : Int −> Int −> Par Int
2 d p f i b t n 3 | n <= t = return $ f i b n 4 | otherwise = do 5 v <− new 6 gv <− g l o b v 7 s p a r k $ ( mkClosure [|d p f i b t ( n−1) >>= 8 e v a l >>= 9 r e p u t gv . t o C l o s u r e|] ) 10 y <− d p f i b t ( n−2) 11 c l o x <− g e t v 12 return ( u n C l o s u r e c l o x + y )
2.3
Parallel Performance Analysis
Performance monitoring and analysis tools play a very important role in the process of developing parallel software that efficiently utilises the parallel machine [6, 71]. Ac-cording to Liang and Viswanathan [76] the term profiling in its broad sense is, ”the ability to monitor and trace events that occur during run time, the ability to track the cost of these events, as well as the ability to attribute the cost of the events to specific part of the program.” Moreover, the goal of performance analysis of parallel programs is to provide programmers with an insight about the behaviour and performance is-sues during execution by efficiently recording and intuitively presenting performance
and analyse the behaviour and performance of parallel applications, for the purpose of helping programmers to tune and improve their parallel code.
2.3.1
Performance Profiling Process
Performance profiling is commonly broken into different stages where the output of one stage is the input for the next [74, 30]. The process consists of: Gathering critical data that can give an insight about the behaviour of the parallel system, persisting the performance data for processing, e.g. in memory, in a database or a trace file, the analysis of performance data to order events and calculate facts, and finally, the presentation of system behaviour to the user which can be in the form of graphical, or text-based (summarised) visualisation. Figure 2.4 illustrates the performance profiling process workflow.
Execution &
Data Collection Profiling data Analysis Presentation
Figure 2.4: Performance Profiling Process Workflow.
Data Collection
The profiling process starts by collecting performance data from the executing pro-gram. The data collection process can take different forms, e.g. summative profiling, sampling, or tracing [24]. In the following we describe three common data collection approaches.
Summative Profiling. In this approach the profiler collects aggregated information about particular events during execution [71]. The profiler counts routine invocations or execution times of various events during the program execution and derives statistics from this data, e.g. gprof [52], CPPRO [54], and Haskell profiler [122, 66]. A profile can be useful for improving the behaviour of a program by showing routines that are responsible for most counts and execution times and comparing different alternative implementations [52]. An advantage of summative profiling is the low-overhead com-pared to other data collected methods such as tracing. However, profiling can only be useful for high-level analysis because it does not preserve the structure and temporal ordering of events [35, 99].
Sampling. Sampling takes snapshots at time intervals during the program execution, and the runtime must be sufficiently long relative to the sample period so that meaning-ful information can be derived [116]. Figure 2.5 demonstrates how performance data is
collected during the sampling process1. Periodic interrupts during program execution
occur to take measurement. Statistical inference is used to derive program behaviour from the sampled data [16, 43].
Time Measurements func 1 main func 2 func 3 func 4 s1 s2 s3 s4 s5 s6
Figure 2.5: Sampling of Performance Data.
Tracing. Tracing is the recording of individual program execution events against time. With tracing detailed analysis of the interaction of processes or threads is possible with time-stamped events [35, 71]. Many performance analysis tools use tracing for collecting more detailed and comprehensive information about the behaviour of the executing program [68]. However, tracing is more intrusive than profiling and sampling. The main disadvantage of tracing is that it is considered the most expensive approach for performance data collection in terms of perturbation to program execution, space required for tracing data, and the post-processing of the trace events [6, 98, 116, 71, 99]. Importantly, tracing allows performance analysis that summative profiles cannot: for instance, identifying variation in dynamic behaviour of a function over several iterations. Besides, from tracing data, profiles can be computed, but not vice versa [71]. Instrumentation is used to emit trace events at certain places in the parallel code. Tracing is implemented by either instrumenting the runtime system, or the parallel application, to emit trace events during the execution. A trace event consists
of a time stamp which indicates when the event occurred and a string that describes where/why the event occurred [115]. Figure 2.6 illustrates how individual trace events
are recorded in a program for different functions or procedures1.
The emitted trace events are then saved into a kind of storage system. As can be seen from Figure 2.7, monitors record trace events at the time of the executions then
all collected tracing data is stored into a trace file1. Trace events are most commonly
stored in a trace file with a predefined data structure to help analysis tools to read and process the data more efficiently. We use tracing to collect data for HdpH performance analysis in Chapter 4. Time Measurements func 1 main func 2 func 3 func 4 t1 t2 t3 t4 t5 t6 t7 t8 t9 t10
Figure 2.6: Tracing Performance Data.
Process A Process B ... 24 Enter 1 26 Send B 30 Exit 1 ... Local trace A ... 25 Enter 1 29 Receive A 32 Exit 1 ... Local trace B 1 func1 ... 2 func2 ... ... 24 A Enter 1 25 B Enter 2 26 A Send B 29 B Receive A 30 A Exit 1 32 B Exit 2 ... Global trace 1 func1 2 func2 ... Merge Unify Monitor Instrumentation Monitor Time Time
Data Analysis
Once the performance has been collected it is analysed [74]. The analysis process starts by reading the raw trace events. After that, the trace events can be processed for categorisation, grouping, calculation of statistics, etc. The results can be shown to the user instantly, saved into a file, or fed to a presentation tool for visualisation.
Presentation
Presenting the performance data is about presenting the profile data in a form that usefully reflects the execution behaviour of the parallel program. For the presentation to be meaningful, it must relate the information in a context [62]. The data presentation can be graphical or text-based. In the graphical case data presentation graphs, such as Gantt charts or Kiviat diagrams [59], are used to map trace events to a physical or logical computation resource, e.g. a processor or a thread. Text-based presentation uses summaries [35], tables, and statistics to provide information about the execution behaviour of the program.
It is very important that the performance data is presented to the user in a way that allows them to identify performance problems [85]. Presenting performance data using graphical visualisation tools is a powerful tool for understanding, tuning, and optimising the behaviour of parallel systems and program execution [74, 53, 39]. Fig-ure 2.8 demonstrates how a Gantt chart can be used to give an insight into the parallel behaviour of an application in terms of processor utilisation by visually presenting trace
events to the user1. Trace events are used to construct the dynamic behaviour of the
parallel program, and time stamps indicate when things happened (x-axis), whereas description is used to identify where things happened (y-axis).
... 24 A Enter 1 25 B Enter 2 26 A Send B 29 B Receive A 30 A Exit 1 32 B Exit 2 ... 1 func1 2 func2 ...
main func1 func2
24 25 26 27 28 29 30 31 32 33 A B Time P ro ce ss ( Thr e ad s)
Shared and Distributed Memory Profiling
Parallel performance profiling depends on the programming model of the profiled pro-gram. Distributed-memory profiling poses several challenges absent in the shared-memory model; for instance, how to profile highly scalable systems, monitor commu-nication, manage multiple trace files, synchronise trace events, and resolve different clock rates. Therefore, profiling distributed-memory parallelism is more challenging than shared-memory parallelism. In Chapter 4 we will present HdpHProf a profiler for the distributed-memory HdpH DSL on a hybrid architecture. It uses tracing to collect HdpH performance data and provides trace analysis tools.
2.4
Parallel Profilers
2.4.1
Imperative Profiling
For decades imperative parallel languages have been supported by a variety of perfor-mance analysis tools. Early profilers, like ParaGraph [60], Pablo [117], and XPVM [73], provided parallel programmers with useful information about the parallel execution. Parallel profiling faces new challenges in new architectures; for instance, larger-scale systems and higher-level parallel languages. These challenges encourage the research community to develop advanced performance tools such as mpiP [141], ompP [37], Score-P [124], Vampir [139], Scalasca [123, 42], and TAU [125]. We will use some of the imperative profilers in our study for parallel functional profilers in Chapter 3.
ParaGraph. ParaGraph [60] is a trace based performance analysis tool for message-passing programs. It was probably the commonly accepted performance visualisation technology in the mid ’90s [62]. ParaGraph uses the portable tracing library PICL [44] that runs on variety of message-passing parallel computing systems. However, Para-Graph does not support performance analysis of shared-memory parallel programs. It post-processes produced trace information of actual executions to present performance behaviour. ParaGraph provides multiple graphs that depict dynamic behaviour of message-passing parallel applications, and shows overall graphical performance sum-maries [61]. It provides users with a variety of displays that can give detailed analysis about parallel performance from different prospectives, e.g. utilisation, processor count, and concurrency profile. Figure 2.9 shows some ParaGraph performance graphs, for example, the Kiviat diagram display (bottom-right in Figure 2.9) shows a geometric
Figure 2.9: Some ParaGraph displays [51]
representation of individual processor’s usage and how the overall load is balanced among all processors.
Pablo Toolkit. Pablo [114, 117] is a performance analysis environment that sup-ports a variety of scalable parallel computing architectures. It focuses on scalability, portability, and extensibility. The Pablo environment toolkit consists of two main components: a portable instrumentation library, and a portable software analysis tool [115]. Pablo uses its own Self-Describing Data Format (SDDF) [8] for recording tracing data into a trace file [116]. The analysis of trace data is post-mortem. Pablo analysis tools can present performance behaviour to the user, using graphics to help understand the parallel program behaviour and identify performance bottlenecks [117].
mpiP. mpiP [142, 141] is a profiler for MPI applications. mpiP monitors the perfor-mance of MPI by collecting statistical information about MPI functions from the MPI profiling layer. Users can configure mpiP to collect aggregate metrics for statistical analysis [99]. mpiP does not capture all MPI calls; it avoids communication during profiling, and it can limit the profiling scope to reduce the profiling overhead. mpiP has no Graphical User Interface (GUI) and does not provide performance graphs but outputs text profiles to show statistical information about the execution of the parallel program. Figure 2.10 shows an extract of mpiP profile of a parallel program.
Figure 2.11: ompP Profile for Parallel Section.
Figure 2.10: mpiP profile Header and MPI Time Sections.
ompP. ompP [36, 37] is a performance analysis tool for shared-memory programming with OpenMP. Tracing is used to gather performance data in the memory to produce a post-mortem profile. ompP measures the performance of an OpenMP application by calculating statistical information about the parallel execution. Also, it can sup-port performance monitoring of hybrid applications of OpenMP + MPI [38]. ompP helps identify performance problems, e.g. most time-consuming regions and load im-balance. ompP is similar in spirit to mpiP [141]; it has no GUI and it does not present performance graphs, instead it presents the performance information in a text profile. Figure 2.11 shows an extract of ompP profile for a parallel program.
Score-P and Vampir. Score-P [124] and Vampir [139] are elements of a bigger set of performance analysis tools for optimising the performance of parallel applications. Score-P is used for performance data collection and Vampir is a visualisation and analysis tool.
Score-P is a performance measurement infrastructure for parallel programming. Score-P is highly scalable and can support HPC facilities [17]. It equips its users with tools for profiling, event tracing, and online analysis of parallel application. In addition,
Figure 2.12: Screenshot of Vampir Visualising a Score-P Trace File.
Score-P can work with a number of performance analysis tools [72]; for example, Vampir [139], Scalasca [123, 42], and TAU [125]. Score-P made this possible by adopting standardised output formats such as the Open Trace Format (OTF) [70], the CUBE4 profiling formats [41] and using instrumentation tools like Opari2 [94].
Vampir is a performance analysis tool which was introduced in the mid ’90s by Nagel et al. [96] and improved upon to become one of the most advanced and sophis-ticated performance analysis tools available nowadays [71, 15, 14]. Vampir is a GUI which provides the capability to read, analyse and present graphically the performance monitoring data for different parallel imperative languages, e.g. C or Fortran with MPI, or OpenMP, or CUDA. Vampir provides its users with multiple views to help the understanding of the execution behaviour of parallel programs. Also, it is capable of working on large scale computing infrastructures, e.g. HPC. Figure 2.12 shows a screenshot of Vampir Visualising a Score-P trace file. It offers different performance graphs the can be selected for performance inspection (from the tool bar top-left in Figure 2.12), e.g. process and thread activities and messages between them. Also, it provides overall activity display (top-right in Figure 2.12) depicting the average utili-sation of the parallel machine.
2.4.2
Functional Profilers
Parallel functional languages also have performance analysis tools. hpcpp [120] was one of the earliest attempts to profile a parallel Haskell. GranSim [55, 79] was the first performance analysis tool for the parallel implementations of the Glasgow Haskell Compiler (GHC), GpH-GUM [138], and GpH [108]. GranSim provides a variety of performance graphs such as overall activity, threads activity, and granularity profile.
Figure 2.13: An example GranSim overall activity [78]
Other variants of GranSim also have been developed [56, 69]. Influenced by GranSim, more recent parallel Haskell profilers have been developed utilising GUI technology, e.g. EdenTV [11] and ThreadScope [134]. We will present a critical analysis of these two functional profilers in Chapter 3.
GranSim. GranSim [55, 78] is a simulator built around the GHC threaded runtime system. It simulates parallel execution of Haskell programs and provides profiling tools for tuning the performance and granularity of parallel programs. Each thread is given a statistics buffer attached to its Thread State Object (TSO) in which the trace events of the execution are recorded. When the thread terminates, all the contents of the buffer will be dumped to a trace file. Moreover, other important events, such as communication between processes, can be written to the trace file during the execution time. The profiling tools focus on visualising the granularity profile but they also provide general activity profiles such as overall activity, per-processor activity, and per-thread activity. Figure 2.13 shows an example of GranSim overall activity profile for a parallel program where the overall runtime is measured in machine cycles and the average parallelism is determined by the area covered by the continuing green or medium-grey threads.
Eden Tracing and EdenTV. The Eden programming language [12, 80] is supported with performance analysis tools. The profiling system of Eden provides tracing and visualisation.
Figure 2.14: Screenshot of EdenTV Visualising an Eden Trace File.
80]. The runtime of GHC-Eden [48] is instrumented to produce trace events. This is can be activated from the runtime options. Previously, Eden tracing was implemented by using the Pablo Toolkit [117] and adopting its SDDF [8] for the trace files. The most recent version of Eden adopts the new tracing of GHC Parallel Profiling System (GHC-PPS) and uses its GHC EventLog Format (GHC-ELF) [67].
The Eden Trace Viewer (EdenTV) is a post-mortem visualisation tool which provides the capability to read, analyse, and present graphically the performance mon-itoring data (trace file) of the parallel functional language Eden from the level of the parallel runtime system [11]. EdenTV presents Eden’s processes mapped to the machines they were executed on, Eden threads activities, garbage collection phases, process generation tree, and the stream of communication between Eden processes on different machines. Figure 2.14 shows an example of EdenTV profile (Machines view) for Eden program where each machine’s status is depicted in a coloured bar on the y-axis and the execution time is represent on the x-axis, e.g. green is active, blue is idle. The black lines between the machines shows the stream of messages between the machines.
GHC-PPS. The GHC Parallel Profiling System (GHC-PPS) [67] is the current per-formance analysis tools for the GHC on multicore [57]. The GHC-PPS consists of tracing facility, analysis tools (GHC-Events Library [49]), and a GUI for browsing the trace events called ThreadScope [134]. Figure 2.15 shows the workflow model of the GHC-PPS.
The GHC-PPS tracing is built into the GHC runtime. To monitor the perfor-mance of a program, tracing flags are added to both the compilation and the execution
eventlog Graphs Application Profiles Compile (GHC) Execute Visualise (ThreadScope) Analysis (GHC-Events Library)
Figure 2.15: Work Flow model of the GHC-PPS.
options (known as event logging in the Haskell community). This will produce a trace file with the GHC EventLog Format (GHC-ELF) called (eventlog).
The GHC-Events library is for reading and processing performance data in the eventlogs [49]. It includes a variety of analysis tools and functionalities that allow the user to investigate the eventlog contents; for example, to sort and print out the trace events to the user in human readable format. Importantly, the library is extensible, so users of the GHC-PPS can develop custom analysis tools to satisfy their needs.
ThreadScope [134] is the post-mortem trace analyser for the GHC-SMP [57]. It is the standard GUI tool to read, analyse, and display performance data generated by the GHC-PPS. Figure 2.16 shows ThreadScope profile of shared-memory parallel Haskell program. The main display of the profile shows (on the y-axis) the overall activity of the program and a list of Haskell Execution Contexts (HECs) beneath it (normally each HEC represents a thread that is mapped to a physical core), and the execution time is represented on the x-axis.
2.5
Summary
This chapter covered a background about parallel computing, parallel programming languages and profiling parallel performance. We presented parallel systems tures based on the underlying physical memory organisation: shared-memory architec-tures, distributed-memory architectures and hybrid architectures(Section 2.1). Later in this thesis we will measure performance on a hybrid architecture, a Beowulf clus-ter of multicores. We presented parallel programming models that are widely used in the parallel programming domain; shared-memory programming with OpenMP and distributed-memory programming with MPI. Also, we discussed parallel programming with high-level parallel functional languages like HdpH that we will use for the rest of the thesis (Section 2.2). We discussed the analysis of parallel performance, illustrating the performance profiling process that we will use in Chapter 4 to build the profiler HdpHProf. We also discussed performance analysis tools of both imperative parallel languages and functional parallel languages that we will study in Chapter 3 for the comparative analysis of parallel functional profiler (Section 2.4).
A Survey of Parallel Functional
Profilers
This chapter presents a survey of parallel functional profilers alongside important im-perative profilers. We evaluate two parallel Haskell profilers, GHC-PPS and EdenTV, in comparison with four important profilers for imperative languages. The functional profilers are relevant as our new HdpHProf profiler exploits GHC-PPS capabilities to profile a distributed-memory DSL, and hence EdenTV is a natural comparator.
The comparison covers profilers of both shared/distributed- memory parallel lan-guages, and is performed on common parallel architectures. The comparison uses a published benchmark, namely the Concordance application which was set as the first SICSA Multicore Challenge [23].
The GHC-PPS performs tracing profiling of shared-memory parallel Haskell, and EdenTV performs tracing profiling of the Eden distributed-memory parallel Haskell. The imperative profilers are the tracing and graphical P/Vampir for MPI, Score-P/Vampir for OpenMP, the two summative profilers mpiP for MPI, and ompP for OpenMP (Section 3.1). We compare the amount of profiling data generated by the profilers classified by whether the parallelism is shared/distributed-memory, whether the profiler is imperative/functional, and tracing/summative. The study reveals some interesting results, e.g. both functional tracing profilers generate one or two orders of magnitude less data than the imperative tracing profilers (Section 3.2).
We investigate the runtime overheads of the profilers, again classified by whether the parallelism is shared/distributed memory, whether the profiler is imperative/func-tional, and tracing/summative. The results of this study shows, for example, both tracing functional profilers induce overheads of an order of magnitude less than the
![Figure 2.9: Some ParaGraph displays [51]](https://thumb-us.123doks.com/thumbv2/123dok_us/10111478.2911718/35.892.284.707.73.407/figure-some-paragraph-displays.webp)
![Figure 2.13: An example GranSim overall activity [78]](https://thumb-us.123doks.com/thumbv2/123dok_us/10111478.2911718/38.892.281.712.73.371/figure-an-example-gransim-overall-activity.webp)