Demonstrating a new framework for the comparison of
environmental impacts from small- and large-scale hydropower
and wind power projects
Tor Haakon Bakken
a,b,*, Anne Guri Aase
c, Dagmar Hagen
d, Håkon Sundt
a,
David N. Barton
d, Päivi Lujala
caSINTEF Energy Research, Sem Sælands vei 11, NO-7465, Trondheim, Norway
bNorwegian University of Science and Technology (NTNU), Department of Hydraulic and Environmental Engineering, Norway cNorwegian University of Science and Technology (NTNU), Department of Geography, Norway
dNorwegian Institute for Nature Research (NINA), Norway
a r t i c l e i n f o
Article history:
Received 12 October 2013 Received in revised form 19 January 2014 Accepted 22 January 2014 Available online 13 April 2014 Keywords: Small-scale hydropower Large-scale hydropower Wind power Environmental impacts GIS analysis
a b s t r a c t
Climate change and the needed reductions in the use of fossil fuels call for the development of renewable energy sources. However, renewable energy production, such as hydropower (both small- and large-scale) and wind power have adverse impacts on the local environment by causing reductions in biodi-versity and loss of habitats and species. This paper compares the environmental impacts of many small-scale hydropower plants with a few large-small-scale hydropower projects and one wind power farm, based on the same set of environmental parameters; land occupation, reduction in wilderness areas (INON), visibility and impacts on red-listed species. Our basis for comparison was similar energy volumes pro-duced, without considering the quality of the energy services provided.
The results show that small-scale hydropower performs less favourably in all parameters except land occupation. The land occupation of large hydropower and wind power is in the range of 45e50 m2/MWh,
which is more than two times larger than the small-scale hydropower, where the large land occupation for large hydropower is explained by the extent of the reservoirs. On all the three other parameters small-scale hydropower performs more than two times worse than both large hydropower and wind power. Wind power compares similarly to large-scale hydropower regarding land occupation, much better on the reduction in INON areas, and in the same range regarding red-listed species. Our results demonstrate that the selected four parameters provide a basis for further development of a fair and consistent comparison of impacts between the analysed renewable technologies.
Ó2014 The Authors. Published by Elsevier Ltd. This is an open access article under the CC BY-NC-ND license (http://creativecommons.org/licenses/by-nc-nd/3.0/).
1. Introduction
Further development of renewable energy sources and the reduction in the consumption of fossil fuels are important elements in the strategy to reduce climate change. As a response to this, the
EU has agreed upon the Renewable Energy Sources Directive (
EU-RES, 2009). As one of the instruments to meet these objectives Norway and Sweden agreed (from January 1, 2012) on a joint green
electricity certificate market aimed at stimulating the production of
26.4 TWh of renewable electricity (Government, 2011). The scheme
promotes green energy by offering producers of electricity from
renewable sources a green certificate (‘subsidy’) for every MWh of
electricity produced. This is expected to further boost the devel-opment of especially small-scale hydropower and wind power in
both countriesTable 1.
The development of renewable energy sources like hydropower and wind-power is however controversial due to the adverse
im-pacts on the local environment (e.g. Edenhofer et al., 2011;
Subramanian, 2012). Within the hydropower sector, there are
conflicting views about whether the most environmentally friendly
strategy is to develop many small-scale hydropower projects or a few large ones. Despite this, it appears that policies in many
countries support the view that‘small is beautiful and large is bad’
when it comes to hydropower, and laws and regulations in many countries are designed in such a way that small-scale hydropower *Corresponding author. SINTEF Energy Research, Sem Sælands vei 11, NO-7465
Trondheim, Norway. Tel.:þ47 95156944.
E-mail address:[email protected](T.H. Bakken).
Contents lists available atScienceDirect
Journal of Environmental Management
j o u r n a l h o m e p a g e : w w w . e l s e v ie r . c o m / l o c a t e / j e n v m a nhttp://dx.doi.org/10.1016/j.jenvman.2014.01.050
is given preference over large-scale hydropower (Edenhofer et al., 2011;Koutsoyiannis, 2011), which some authors argue is neither
renewable nor sustainable (Frey and Linke, 2002; Koutsoyiannis,
2011). The definition of small-scale hydropower varies
substan-tially from country to country (Frey and Linke, 2002;Edenhofer
et al., 2011), as the maximum installed capacity of small
hydro-power ranges from 1 MW to 100 MW, indicating that the classifi
-cation is based on political reasons rather than scientific evidence
(Frey and Linke, 2002) and is somewhat arbitrary (Egre and Milewski, 2002). In support of this view Gleick (1992) and Edenhofer et al. (2011)argue that differences in installed capacity
are not necessarily a good indication of a plant’s environmental
performance, as smaller facilities might have greater environ-mental disruption per unit of energy produced than larger units.
Due to the rapid development of new renewable energy pro-duction and international commitments there is an urgent man-agement need to have improved methodology for the comparison of the environmental performance of energy projects across
tech-nologies (Edenhofer et al., 2011). The following research questions
are therefore addressed in this study:
- Can a set of criteria be established that allows the comparison of environmental performance between small-scale hydropower, large-scale hydropower and wind power?
- How valid is it to claim that one type of electricity production has a better (or worse) environmental performance than the other, based on these criteria and the selected dataset of elec-tricity production facilities?
The work in this paper contributes to the fairly limited literature
on this field of science. Among the few studies comparing the
environmental performance between hydropower (small and
large), wind power and other electricity generation options,Evans
et al. (2009)concluded that wind power is the most sustainable, followed by hydropower, photovoltaics (solar power) and then geothermal. The parameters used for comparison in this compari-son were costs, greenhouse gas emission, availability of sources,
efficiency of energy conversion, land requirements, water
con-sumption and social impacts.
Koutsoyiannis (2011) compiled a dataset of 188 existing hy-dropower projects and found that the occupied reservoir area per unit produced electricity (or installed effect) is smaller for large
projects. The study by Kibler and Tullos (2013) evaluated the
assumption that many small hydropower projects (<50 MW) is
better than a few large hydropower projects based on data from
China’s Nu River basin. Despite difficulties infinding precise and
reliable data they conclude that the biophysical impacts of small-scale hydropower may exceed those of large-small-scale hydropower projects, particularly with regard to habitat and hydrological
change.Kibler and Tullos (2013)used parameters such as habitat
loss, catchment connectivity, and priority conservation lands as
their basis for comparison. Schmutz et al. (2010) used flooded/
inundated river reaches due to hydropower projects as their parameter for comparison and found that 15 reservoir-based
hydropower plants came out better than the sum of 803 small-scale hydropower plants, given the same planned energy output (approx. 2.8 TWh).
Bakken et al. (2012) compared the accumulated environmental impacts from 27 small-scale hydropower plants with (the average of) three large-scale hydropower projects in Norway, based on the environmental impact assessments. The results showed a slight tendency for large-scale hydropower to have a lower degree of impacts than many small-scale projects. However, the lack of pre-cision in the data and weak methodological foundation for
com-parison introduces uncertainty in the results. In a study byHagen
and Erikstad (2013)a number of small hydropower plants in Nor-way were assessed, and concluded that the impact on local habi-tats, landscapes and terrain could be comprehensive, and that in order to defend its reputation as an environmentally friendly in-dustry the small-scale hydropower business should take their
‘brand mark’more seriously.
2. Method and datasets used for comparison 2.1. Equal volumes of electricity produced
The basis for our comparison of environmental impacts is that the selected technologies should generate similar volumes of electricity (in MWh), without considering other qualities of the energy services provided, such as to what extent the electricity is regulated and the reliability of supply. These are crucial services in an integrated energy system, and the importance of regulating services is expected to increase in the future with a larger share of non-regulated/intermittent sources, such as wind and solar power (Gabrielsen and Grue, 2012). Another commonly used parameter to describe electricity production is installed capacity (in MW) which is the maximum (instant) production a plant or system can deliver, but this does not say anything about the actual production over a longer period.
2.2. Selection of parameters for comparison
Based on methodological problems encountered in e.g. Bakken et al. (2012) an improved approach was developed using a stan-dardized set of indicators enabling direct comparison between electricity production technologies. Parameters in this context are
descriptors of specific environmental qualities and they were
chosen for their relevance for local environmental impacts, describing both the physical impacts and proxies for biological impacts. The parameters are quantitative in order to allow simple mathematical operations for the purpose of summing, averaging and normalization of impacts. It was also an important criterion that the parameters could be handled uniformly between
tech-nologies with as little technology-specific and subjective
judge-ments as possible. The parameters are partly similar to those used
in published literature (Edenhofer et al., 2011; Kibler and Tullos,
2013; Evans et al., 2009) and partly defined specifically for our study. Furthermore, the parameters are considered relevant for policy development and implementation (see details in the
Sec-tions 2.2.1e2.2.4). The following parameters were selected for
comparison:
1. Land occupation (including rivers and lakes/reservoirs) 2. Reduction in wilderness areas (INON)
3. Visibility of power plants
4. Conflicts with red-listed species
One limitation in our study is that all occupied land areas occupied are given the same qualitative value, independent of what Table 1
Summary of characteristics of the selected plants/cases for comparison. Characteristics Small-scale
hydropower
Large-scale hydropower
Wind power Number of plants 27 1 (3 used for
averaging)
1 farm, 48 turbines Average electricity
production (GWh/yr)
350 347 (average) 356 Installed effect (MW) 88.7 76 (average) 150 MW
type of nature is occupied, as we have not done any value or
vulnerability classifications of the areas.
2.2.1. Land occupation
Changes in land use are by far the largest single cause of
biodiversity loss in Norway (Kålås et al., 2010). The protection of
biodiversity is governed by the Nature Diversity Act (2009), and state that special care should be paid to land use, land use change and habitat degradation caused by development projects. This is
also emphasized in the authorities’guidelines for development of
energy projects (OED, 2007). The data on land occupation were
obtained by use of data downloaded from‘Norway satellite photos’
(www.norgeibilder.no). The occupied areas were digitized manu-ally with use of a Geographical Information System (GIS), in this
study the software ArcGIS 10.0 provided by ESRI’s (ESRI, 2013).
Areas considered as affected by hydropower (small and large) are those areas occupied by the hydraulic works and infrastructure, typically including the hydropower plants, intakes, outlet struc-tures, penstocks (if not buried), access roads and cleared forest. Also
the parts of the watercourses with changed flows, i.e. from the
intake in the upper end to the point where the water is released
back to the river, are also defined as‘occupied land’. A subjective
assessment classified roads as built for the energy project or not.
For large-scale hydropower plants, the reservoir areas were defined
as occupied land and polygons were drawn around the reservoirs at maximum water level.
For the wind power farms a polygon was drawn outside the outer wind mills based on photos provided by the developer
(Statkraft) during the licensing process (www.nve.no), which is also
the formal outer delimitation of the facility. 2.2.2. Reduction in wilderness areas (INON)
An important political goal in Norway is the protection of the remaining wilderness areas from human interventions (e.g. Parliament, 2001; Parliament, 2007). The INON-index describes areas with no interventions and was established by the Norwegian Directorate for Nature Management (DN) in order to map the long-term changes in areas free of human interventions. According to the last mapping by DN (2008) energy projects is the single largest
cause of reductions in the INON-areas in Norway (DN, 2008).
Construction in wilderness areas is for this reason carefully fol-lowed in licensing of new energy projects.
The INON areas are defined as those lying at least 1 km in a
straight line from the nearest infrastructure object, as defined in
the classification manual (Skjeggedal et al., 2005), including roads,
power lines, railways and hydropower developments. Following
the classification proposed bySkjeggedal et al. (2005)and adopted
by DN, buffer sizes of 1 km, 3 km and 5 km are used in this study.
Our analysis identifies the INON-areas that are occupied
(re-ductions in INON-areas) due to the energy projects, projected with buffer sizes 1 km, 3 km and 5 km, respectively. Data of INON areas (2008) for this analysis were downloaded from Norway Digital (www.norgedigital.no), converted to a map layer and overlayed
with the map data on‘land occupation’. The buffers were calculated
from the outer lines of the land occupation polygons. 2.2.3. Visibility of electricity production plants
Recreation in landscapes without any visual disturbances from human interventions is highly appreciated by recreationists and
has been a source of conflicts in many energy projects. In the recent
debate on the development of grid lines (‘monster towers’) crossing
the scenic Hardangerfjorden (Norway), landscape impacts were not
acceptable to several interest groups (Ruud et al., 2011), and caused
a very tense conflict with extensive coverage in national media.
In order to calculate the size of the areas where a specific power
installation can be seen (‘viewshed’), the map layer‘land
occupa-tion’was overlayed with a digital elevation model (DEM) with a
spatial resolution 5 m was downloaded from Norway Digital (www.
statkart.no/Norge_digitalt/Engelsk/About_Norway_Digital/) and processed in a GIS. In our analysis all elements from all technologies were set to 0 m above the terrain. As the rotor-blades at wind farms reaches an altitude of 110 m above the terrain, this assumption would lead to a larger under-estimation of the visibility than for small and large hydropower. Furthermore, it should also be mentioned that due to limitations in the GIS software, the maximum distance the elements could be seen from was 30 km, despite especially wind towers most likely being visible from further away in clear weather conditions, hence under-estimating the visibility areas.
2.2.4. Conflicts with red-listed species
The Norwegian red-list has classified 2398 species as‘
threat-ened’ and 1284 as ‘almost threatened’ (Kålås et al., 2010), and
development of small-scale hydropower in steep slopes has a
documented effect on rare moss and lichen species (Hassel et al.,
2010; Timdal et al., 2010). Both the environmental investigations and the treatment of applications for small-scale hydropower plants put a great emphasis on red-listed species and in particular
on red-listed bryophytes and lichens (Evju et al., 2011).
A map layer of red-listed species was based on data from the
national species database (Artsdatabanken, 2013). These data were
overlayed with a map layer of‘land occupation’(using buffer
dis-tance of 2 km and 10 km from the power production sites) to create
a conflict map layer. The analysis was carried out under the
following assumptions and limitations:
The locations of threatened species were not diversified with
respect of red-list status, i.e. all species observations are treated equally.
A uniform home-range/mobility of 2 km and 10 km was applied
to all threatened species, i.e. species-specific information was
not applied in order to relate the buffer to the habitat re-quirements and distribution range.
The quality of the basic information in the Artsdatabanken (The
Norwegian Biodiversity Information Centre) was assumed to be uniform.
All observations of red-listed species in the areas are used,
in-dependent of whether there might be several of the same
spe-cies, which would add to the total number of conflicts.
2.3. Description and characteristics of the plants used in the comparison
2.3.1. Wind power planteSmøla
Smøla wind power plant was selected as the case on wind power production for comparison with small-scale and large-scale
hy-dropower projects (Statkraft, 2013). Smøla is the largest wind
po-wer farm in Norway, located in Møre og Romsdal County (Fig. 1) by
the west coast in mid-Norway (Fig. 1), producing in average
356 GWh/year. The annual energy production from Smøla was set as the energy base for the total study.
2.3.2. Small-scale hydropower plants
In total 27 small-scale hydropower plants were chosen in order to correspond the energy production from Smøla. All case plants
are located in Sogn og Fjordane County (Fig. 1), as the small-scale
hydropower development in this county is very extensive, and to ensure comparability with the preceding study by Bakken et al. (2012). The installed capacity of the individual plants was in the
range of 1.3e5.3 MW, i.e. within the Norwegian size-classification
of small-scale hydropower (>1 MW and <10 MW). The energy
production, which might vary from year to year depending on the hydrological conditions, ranged from a predicted minimum of 4.8 GWh/yr up to 24.4 GWh/yr for the largest plant in an average year.
2.3.3. Large-scale hydropower plants
Three large-scale hydropower plants were also selected from Sogn og Fjordane County: Øksenelva (135 GWh/yr), Leidøla
(462 GWh/yr) and Årøy (GWh/yr), all reservoir-based plants (Fig. 1).
All the locations used in the study are within the same region in Norway we assume that the biophysical characteristics of the lo-cations are as similar as possible, given the differences in technol-ogy. Each technology exploits different types of natural resources, i.e. small-scale hydropower plants will typically be located in steep terrains with small tributaries; wind power plants in open areas exposed to high and constant wind resources.
3. Results and discussion
The annual power production varies slightly between the technologies, and results are presented per unit of produced elec-tricity, i.e. per MWh or GWh. The calculated areas represent what is physically exploited for the purpose of power production. 3.1. The results from the GIS analysis
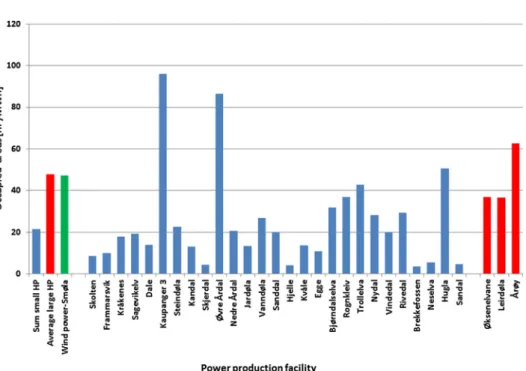
The summed land occupation from the small-scale hydropower plants is much lower than the average of the large-scale hydro-power plants and the wind farm, where the latter two are close to
the same (Fig. 2). Looking into the details of the small-scale plants
we can see that there are large individual differences. Two of these plants have much higher land occupation per MWh than both the average large and the individual large. Six out of 27 small-scale
plants have a land occupation less than 10 m2/MWh. The average
land occupation by the three large-scale hydropower plants is more than twice that of small-scale hydropower. Looking into the details of the large plants, two of the large plants have close to the same area use while the third has almost twice the area use as the two others. The main reason why the large hydropower plants end up with large area use is the size of the reservoirs, which is assigned as
‘occupied land’. Related to this, it should be mentioned that the
majority of the reservoirs in Norway are established in natural lakes
(Hveding, 1992), sometimes with limited changes to the natural condition. Based on our data we can conclude that small-scale hydropower plants produce large volumes of energy in the light of the modest land occupation. If a large run-of-the-river hydro-power plant (without reservoir) had been included in the analysis,
this would most likely have achieved a‘good score’on this aspect as
there are no large reservoirs connected to these types of hydro-power plants.
Wind power occupies the same areas as large-scale hydropower projects and much of the area occupation is due to the safety zones around the turbines. The safety zone is set by the authorities as 500 m in all directions because of the risk for the windmill itself or
the wings to fall down or the risk of ice-falls from the blades (Holter
et al., 2010). There is also a certain distance between the wind mills to avoid aerodynamic disturbance.
The large reduction in INON areas from the small-scale
hydro-power (Fig. 3) is due to the fact that producing the same volume
from many small-scale plants implies several small encroachments in an area, hence fragmenting the landscape. Larger hydropower projects will have more concentrated encroachments, even though the distances from the reservoir, brooklet intakes and access roads can be considerable. In our case, wind power came out by far as the best option with respect to INON. The wind power farm is very concentrated and the single farm selected in our study was situated at a short distance to existing infrastructure (not within an INON area) and hence the park did not cause further effect. As we used only one wind power farm, this result cannot be used to generalize the INON parameter.
The results on visibility (Fig. 4) are unfavourable to
small-scale hydropower plants, especially compared to large-small-scale hydropower and wind power. As the encroachments from the 27 small-scale hydropower plants are distributed over a large area, the results are not surprising. In small-scale hydropower plants most of the infrastructure is located above surface, and even the penstock/pipeline is often visible from the surface
despite being buried (Hagen and Erikstad, 2013). This is in
contrast with large hydropower, where much of the needed infrastructure is underground, such as tunnels for water
trans-fer, power house and penstock (Hveding, 1992). Furthermore,
the majority of the small plants in this study are located in steep fjord landscapes which often can be seen from large areas. There is a large variation in visibility between the individual
small-scale hydropower plants, ranging from 70 m2/MWh to
7399 m2/MWh. The large hydropower plants range from 32 to
Fig. 1.Map of Northern Europe (to the left) the region of Norway with the exact location of the wind-power plant and the large hydropower plants (to the right). The 27
34 m2/MWh as the low estimates to 317 m2/MWh as the highest of the three large plants in the dataset. As there are only three large-scale hydropower plants in this study, the results are sensitive to the choice of plants in the dataset. The large dif-ferences indicates that there can be considerable potential to
reduce the conflicts with the respect to visibility (Hagen and
Erikstad, 2013; Erikstad et al., 2009).
Wind power plants are often located in open landscape due to wind conditions, and there is great potential for visual disturbances to the landscape, mainly related to the height of the wind mills in
theflat landscapes (Strickland et al., 2011). In our analysis all
ele-ments from all technologies were set to an altitude of 0 m above the terrain, which also would lead to an under-estimation of visibility, especially for wind power.
Fig. 2.Land occupation by the studied projects per unit of electricity produced for the three different technologies. The three bars to the left show the aggregate averaged values,
the blue bars in the centre present the individual small-scale hydropower plants, while the three red bars to the right are individual results from each of the three large-scale hydropower plants.
Fig. 3.Reduction in wilderness areas (INON areas) by the analysed energy projects per unit of electricity produced for the three different technologies. The bars present the results
Small-scale hydropower plants have the least preferable
envi-ronmental performance with respect to conflicts with red-listed
species in our study (Fig. 5), when assigning both a 2 km and a
10 km buffer zone. The higher conflict level between small-scale
plants and red-listed species is likely due to the fragmented
nature of development of small-scale power plants. This affects large areas when a buffer is added to many small sites, compared to fewer, larger and more concentrated encroachments in large-scale hydropower plants and wind-plants, even though the direct land occupation is smaller in the small plants.
Fig. 4.Thefigure presents the results from the visibility analyses, i.e. how large areas the energy projects of the three different technologies can be seen from. The three bars to the
left show the aggregated/averaged values, the blue bars in the centre present the individual small-scale hydropower plants, while the three red bars to the right are individual results from each of the three large hydropower plants.
Fig. 5.The number of incidents with conflict between a red-listed species and the selected energy projects, assigning a 2 km (in blue) and 10 km buffer (in light brown) to the
energy projects. The bars to the left show the aggregated/averaged values for each of the technologies, the bars in the centre present the individual small-scale hydropower plants, while the bars to the right are individual results from each of the three large hydropower plants.
The analysed large-scale hydropower plants have few conflicts with red-listed species, both when a 2 km and a 10 buffer size are used. The three individual large plants provide a consistent picture with the averaged results. The scores on wind power are also fairly
low, especially for the 2 km buffer. Despite the low conflict level for
the wind-park in our study the conflict level is high between the
presence of sea eagle and the wind power is tense at Smøla, as well
as at other wind power sites in Norway (NRK, 2013) and illustrates
that other biodiversity values can be worth including as a param-eter in a comparison. A major problem with including rare and red-listed species in such studies is the lack of knowledge about species
distribution. The environmental assessments are insufficient in
mapping of red-listed species, and in particular species from large and important groups as bryophytes, lichens and invertebrates (Gaarder and Melby, 2008; Evju et al., 2011). A review of environ-mental investigations of small-scale hydropower plants, docu-mented that red-listed lichens were rarely recorded, and red-listed
bryophytes were never recorded (Gaarder and Melby, 2008). From
this we can interpret that the conflict with red-listed species in our
analysis is most likely underestimated. This is even more enhanced
in small-scale hydropower plants with a simplified environmental
assessment (Korbøl et al., 2009; Jensen et al., 2010), and where the
economy is limited to do both doing surveys and study mitigating
efforts (Hagen and Erikstad, 2013). The consequence can be that
projects with less detailed investigations get awarded as they identify fewer species than those areas that have been thoroughly assessed. A range of habitats can be affected from small-scale
plants, but the main focus is gorges and forest (Evju et al., 2011).
The diversity of habitats is higher in (not least within) the large-scale hydropower and wind power projects and the potential
conflicts might also come out as more diverse.
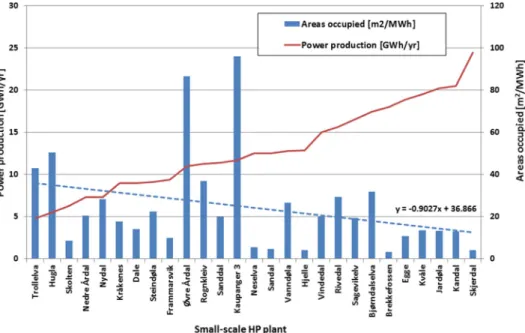
It is interesting to see fromFig. 6 that there is a trend in the
dataset of the small-scale plants that the land occupation per unit of electricity produced is reduced with the volume of electricity produced. The decreased land occupation per volume of electricity produced in the small hydropower plants in our project might imply a general trend that larger small-scale projects (below 10 MW) have a smaller land occupation per unit electricity than the smallest. One explanation can be that larger projects have more
resources for technical and environmental competence available. However, this trend does not continue as the large hydropower
projects have a much higher land occupation (36e62 m2/MWh)
than the largest small-scale plants (in the range of 5 m2/MWh).
Similar results on the decrease of impact with increased power production (among the small-scale plants) can also be found for the
visibility parameter (Aase, 2013).
3.2. Evaluation of the methodological approach
The selected parameters in this study have not previously been used in the context of comparing environmental impacts between energy production technologies. Our experience is that the demonstrated methodology can be a contribution for assessment and a broad evaluation of environmental impact related to energy gain. The quality of the data accessible from public databases is of
sufficient quality for the technical analysis, but has some critical
limitations for the interpretation of the environmental conse-quences. This includes limited data for presence/absence of
red-listed species (e.g.Hassel et al., 2010; Timdal et al., 2010), insuffi
-cient data on related infrastructure such as power lines (Erikstad
et al., 2009), and the absence of other environmental attributes (such as habitat qualities, other species, ecological values of con-nectivity). The selected approach also involves subjective judge-ments, in the process of digitizing and calculating areas affected by the projects as represented by the calculation of buffers.
Species have very different habitat requirements, so setting a
fixed margin to assess influence is problematic. Some species need
a large and connected home range (like some birds andfish species,
e.g.Helland et al., 2011), while others have very specific and local habitat requirements as presence of dead wood or spurting water
(like some bryophytes and lichens, e.g. Evju et al., 2011). At the
same time there is a lack of knowledge about species occurrence and environmental vulnerability to the encroachments introduced
by the power production projects (Ihlen, 2010). Afixed boundary
for the specific sites for the three different production types, call for
a standard value on the margin that contains the highest number of actual affected species. If the margin is too large, the calculated number of affected species might be higher than the actual number
Fig. 6.Small-scale hydropower plants sorted with increasing energy production from left to right and the‘land occupation’per energy volume (the bars). The dotted line represents
and create bias. But as each site is unique, project areas will affect a high number of species, and some will affect a smaller number. By
setting a predefined fixed buffer for each site the results are
considered easier to reproduce, despite their limitations.
To omit the transmission lines in this study is another serious limitation that should be improved in a future model. Numerous small-scale plants will need the construction of new infrastructure to transport the electricity onto the central grid. Such transmission
lines can cause significant environmental impacts (Bevanger, 1998;
Bevanger et al., 2011). The large production sites (wind and the single large hydropower plant) will need high-voltage transmission lines, and a wider landscape corridor than the single small-scale plants, however, smaller power production facilities in total are likely to need longer distances of low voltage lines.
Furthermore, the study does not distinguish between different
area types and habitat qualities, i.e. 1 km2occupied land is the same
as each other km2of occupied land. Further studies should include
qualitative aspects of the land. The ongoing development of a model for national mapping of landscape types will be very useful
for this purpose (Erikstad et al., 2013).
There is a great management need to develop methods for calculating the accumulated impacts from energy projects, as described by for instance Norwegian Nature Diversity Act
(para-graph 10) andOED (2007). It is, however, acknowledged by several
authors that the methodology is immature (Smit and Spaling, 1995;
Canter, 1996; Bakken et al., 2012; Kibler and Tullos, 2013). The calculation of the cumulative environmental impact is a compli-cated issue, due to the mentioned parameters about quality, con-nectivity, and lack of environmental data. Improved methods are
under development (Erikstad et al., 2009), but in our study we have
calculated the accumulated impacts from small-scale hydropower simply by summing the individual impacts for a limited number of parameters, and assuming similar characteristics for all areas.
In our study we compared similar volumes of electricity pro-duction based on annual volumes produced. Reservoir-based hy-dropower is the only large-scale renewable electricity production that provides substantial volumes of regulated electricity
produc-tion (Edenhofer et al., 2011), and is hence much more valuable to
society. This source can provide electricity supply when the hy-drological and meteorological conditions do not allow production of electricity from small-scale plants or from wind power and can
‘fill in’ in periods where peak power production is needed. An
interpretation of the results can be that society has to ‘sacrifice’
nature resources in order to provide this type of service (‘battery
service’). 3.3. Policy
In the management of energy and environmental resources and
there is a difficult and delicate balance between political goals for
more renewable production on the one hand (EU-RES, 2009) and
achieving certain environmental standards and the protection of
nature on the other (OJEC, 2000). Reconciling these aspects is
difficult. It needs explicit priorities and should not be left to
case-by-case management. The recent agreement on the el-certificate
market between Norway and Sweden (Government, 2011) might
speed up the development of new energy projects, and put addi-tional pressures on remaining resources. A more open and precise discussion is needed as different political priorities will lead to different management practice. Based exclusively on our results, the policy formulation will be determined by the weights that are given to each of the analysed parameters. If the highest priority is to stop reduction in INON areas the massive development of small-scale hydropower should be reduced, but if the land occupation is the single-most important environmental parameter to minimize,
small-scale hydropower development is more favourable, accord-ing to our study.
The concept of ecosystem services assessment (ESA) (Kumar,
2010) is now under consideration for a wider application in the
management of waters in Europe (EU, 2013). ESA opens up for
offsetting of habitats, but it has been identified as a methodological
challenge to define habitat equivalency and similar user interests,
which is needed in order to carry out compensation and offsetting the impacts of different projects across ecosystem services. Our work might provide a platform for offsetting impacts between different types of electricity production. An assumption is that areas that are degraded due to energy projects (or other means) can be compensated with similar-sized or similar-quality areas
else-where (Moilanen et al., 2009; Quigley and Harper, 2006). This is a
very crude assumption and quality aspects (e.g. via nature types) of the occupied areas should be introduced, for instance by classifying
the areas by nature type (Bruggeman et al., 2005). Assuming also
that a ratio could be established between the nature types, off-setting could also be supported between energy projects of different technologies, but this topic certainly needs further work. Crucially, the ecosystem services approach acknowledges that different locations can have different user interests and hence different values even when physical characteristics may be similar. 4. Conclusions
Introducing the parameters of land occupation, reduction in wilderness areas (INON), visibility and impacts on red-listed spe-cies is one promising way forward to compare environmental performance between electricity-producing technologies. These parameters provide a common and quantitative basis with the same dimensions and units, allowing direct comparison between technologies. In this study small-scale hydropower scores best on the parameter of land occupation, i.e. uses the smallest land area in order to produce the same volume of electricity as large hydro-power and wind hydro-power. Wind hydro-power comes out similarly to large-scale hydropower regarding land occupation, and much better on reduction in INON areas. Both wind power and large-scale hydro-power perform better than small-scale hydrohydro-power with respect to
red-listed species. As such, the study is in line with thefindings of
Bakken et al. (2012),Edenhofer et al., (2011)andKibler and Tullos
(2013), bearing in mind that these comparative studies were based on other environmental parameters. There are, however, large individual differences between the single energy plants (small- and large-scale hydropower) indicating that there is a po-tential to reduce the negative environmental impact with careful siting and mitigation efforts.
The selected parameters in our study do not cover all the environmental impacts of energy projects as these parameters are not proxies for all physical and biological qualities of the natural environment. It should also be noted that our results do not diversify the impacts within one and the same environmental parameter as the qualities of the areas are treated uniformly. This is a critical shortcoming with regards to an ecosystem services dimension in our results. Further research should focus on including the quality of the areas affected by the energy projects, including related infrastructure, ensuring a consistent and fair mapping between technologies, and also including a larger set of parameters describing the quality of the energy services provided. As a regulated and reliable supply of energy has a higher value to society, our simple comparison based on similar volumes of energy
based on annual production does not take into account the benefits
of reservoir-based hydropower.
Policy objectives should be expressed more precisely when it comes to trade-offs between the development of new energy
sources and protection of the environment. All renewable energy projects will have some negative impact on environmental quali-ties, and minimizing and mitigating these effects is of relevance to society. One type of technology can be less damaging with respect to impacts on red-listed species while another technology might be the better choice in order to avoid further reduction in INON areas. The potential for mitigation and offsetting of impacts can also vary
between technologies. Today’s practice in Norway is that a project
developer applies for a specific project at a specific site, and the
authorities say yes or no to the proposed project, possibly with some restrictions. This can lead to sub-optimization of resource use and environmental impacts, possibly also within one technology. It is pertinent to ask whether a better strategy would be for the
au-thorities to call for bids for the‘best electricity project independent
of technology’ within a region, given that a certain volume of
electricity of a specific quality needs to be developed.
Acknowledgement
This paper is based on the results from a master’s thesis by Anne
Guri Aase at the Norwegian University of Science and Technology (NTNU), Department of Geography, Norway, under the supervision of Päivi Lujala, Asbjørn Karlsen and Tor Haakon Bakken. The study
has received financial support via EcoManage, funded by the
Research Council of Norway (contract no: 215934/E20). EcoManage is organized under the research centre CEDREN (Centre for
Envi-ronmental Design of Renewable Energyewww.cedren.no). This
study has received additional funding directly from the Norwegian
Environment Agency (www.miljodirektoratet.no/english/).
References
Aase, A.G., 2013. A New Approach Towards Comparing Environmental Impacts from Small-scale Hydropower, Large-scale Hydropower and Wind Power, Dept. of Geography. Norwegian University of Science and Technology, Trondheim, Norway.
Artsdatabanken, 2013. The Norwegian Biodiversity Information Centre. http:// www.biodiversity.no/frontpage.aspx?m¼23(accessed 16.12.13.).
Bevanger, K., 1998. Biological and conservation aspects of bird mortality caused by electricity power lines: a review. Biol. Conserv. 86, 67e76.
Bevanger, K.M., Bartzke, G., Brøseth, H., Dahl, E.L., Gjershaug, J.O., Hanssen, F.O., Jacobsen, K.O., Kvaløy, P., May, R.F., Meås, R., Nygård, T., Refsnæs, S., Stokke, S., Thomassen, J., 2011. Optimal Design and Routing of Power Lines; Ecological, Technical and Economic Perspectives (OPTIPOL). Progress Report 2011. Norsk Institutt for Naturforskning, p. 52.
Bruggeman, D., Jones, M., Lupi, F., Scribner, K., 2005. Landscape equivalency anal-ysis: methodology for estimating spatially explicit biodiversity credits. Environ. Manage 36, 518e534.
Canter, L.W., 1996. Environmental Impact Assessment. McGraw-Hill, New York. DN, 2008. Reduction in Encroachment-free Areas. Norwegian Environment Agency.
http://www.miljodirektoratet.no/no/Nyheter/Nyheter/Nyhetsarkiv/2009/12/ Energisektoren-gir-storst-tap-av-inngrepsfri-natur/(accessed 16.12.13.).
Edenhofer, O., Pichs, R., Madruga, Sokona, Y., Seyboth, K., Matschoss, P., Kadner, S., Zwickel, T., Eickemeier, P., Hansen, G., Schlömer, S., von Stechow, C.E., 2011. IPCC Special Report on Renewable Energy Sources and Climate Change Mitigation. Cambridge University Press, Cambridge, United Kingdom and New York, NY, USA.
Egre, D., Milewski, J.C., 2002. The diversity of hydropower projects. Energ. Policy 30, 1225e1230.
Erikstad, L., Hagen, D., Evju, M., Bakkestuen, V., 2009. Utvikling av metodikk for analyse av sumvirkninger for utbygging av små kraftverk i Nordland. For-prosjekt naturmiljø. NINA Rapport 506, p. 44.
Erikstad, L., Blumentrath, S., Bakkestuen, V., Halvorsen, R., 2013. Land-skapstypekartlegging som verktøy til overvåking av arealbruksendringer. NINA Rapport 1006.
ESRI, 2013. ArcGIS-software. http://www.esri.com/software/arcgis/arcgis-for-desktop(accessed 16.12.13.).
EU, 2013. Mapping and Assessment of Ecosystems and their Services. An analytical framework for ecosystem assessments under Action 5 of the EU Biodiversity Strategy to 2020. Discussion papereFinal, April 2013.
EU-RES, 2009. Directive 2009/28/EC on the Promotion of Electricity Produced from Renewable Energy Sources.http://eur-lex.europa.eu/LexUriServ/LexUriServ.do? uri¼Oj:L:2009:140:0016:0062:en:PDF(accessed 16.12.13.).
Evans, A., Strezov, V., Evans, T.J., 2009. Assessment of sustainability indicators for renewable energy technologies. Renew. Sust. Energ. Rev. 13, 1082e1088.
Evju, M., Hassel, K., Hagen, D., Erikstad, L., 2011. Small-scale Hydropower Plants and rare Bryophytes and Lichens. Knowledge and Lack of knowledge, NINA Report 696. Norsk Institutt for Naturforskning, p. 33.
Frey, G.W., Linke, D.M., 2002. Hydropower as a renewable and sustainable energy resource meeting global energy challenges in a reasonable way. Energ. Policy 30, 1261e1265.
Gaarder, G., Melby, M.W., 2008. Små vannkraftverk. In: Evaluering av doku-mentasjon av biologisk mangfold. Miljøfaglig Utredning.
Gabrielsen, R.H., Grue, J.E., 2012. Norwegian Energy policy in context of the global energy situation. Nor. Acad. Sci. Lett..
Gleick, P., 1992. Environmental consequences of hydroelectric development: the role of facility type and size. Energy 17, 735e747.
Government, 2011. Green Electricity Certificate Agreement Norway e Sweden.
http://www.regjeringen.no/upload/OED/pdf%20filer/EV/063-2011-Avtale_ elsertifikater_endelig.pdf(accessed 16.12.13.).
Hagen, D., Erikstad, L., 2013. Arealbrukens betydning for miljøprofil i småkraft-bransjen, med vekt på vei og rørgate. Kart og plan, 297e308.
Hassel, K., Blom, H.H., Flatberg, K.I., Halvorsen, R., Johnsen, J.I., 2010. Moser Anthocerophyta, Marchantiophyta, Bryophyta, Norsk rødliste for arter 2010. The 2010 Norwegian Red List for Species. Artsdatabanken, pp. 139e153.
Helland, I.P., Erikstad, L., Hagen, D., Jonsson, B., Thorstad, E.B., 2011. Effekter av små kraftverk påfisk. Vann, 127e142.
Holter, Ø., Ingebretsen, F., Parr, H., 2010. Fysikk Og Energiressurser. University of Oslo, Oslo.
Hveding, Q., 1992. Hydropower development in Norway. Division of Hydraulic Engineering, Norwegian Institute of Technology.
Ihlen, P.G., 2010. Botaniske verdier og småkraft. In: Frilund, G.E. (Ed.), Etter-undersøkelser Ved Små Kraftverk. Norges vassdrags-og energidirektorat (NVE), Oslo, pp. 74e91.
Jensen, C., Brodtkorp, E., Stokker, R., Sørensen, J., Gakkestad, K., 2010. Konsesjon-shandsaming av vasskraftsaker: rettleiar for utarbeiding av meldingar, kon-sekvensutgreiingar og søknader. Norges vassdrags-og energidirektorat (NVE), Oslo.
Kålås, J.A., Henriksen, S., Skjelseth, S., Viken, Å.E., 2010. Environmental Conditions and Impacts for Red List Species. Norwegian Biodiversity Information Centre, Norway.
Kibler, K.M., Tullos, D.D., 2013. Cumulative biophysical impact of small and large hydropower development in Nu River, China. Water Resour. Res..
Korbøl, A., Kjellevold, D., Selboe, O.K., 2009. Kartlegging og dokumentasjon av biologisk mangfold ved bygging av småkraftverk (1e10 MW)erevidert utgave: mal for utarbeidelse av rapport. Norges vassdrags-og energidirektorat (NVE), Oslo.
Koutsoyiannis, D., 2011. Scale of water resources development and sustainability: small is beautiful, large is great. Hydrol. Sci. J. 56, 553e575.
Kumar, P., 2010. The Economics of Ecosystems and Biodiversity: Ecological and Economic Foundations. UNEP/Earthprint.
Moilanen, A., Arponen, A., Stokland, J.N., Cabeza, M., 2009. Assessing replacement cost of conservation areas: how does habitat loss influence priorities? Biol. Conserv. 142, 575e585.
NRK, 2013. Planløs natur. Norwegian Broadcasting Corporation.http://www.nrk.no/ ytring/planlos-natur-1.11118223(accessed 16.12.13.).
OED, 2007. Retningslinjer for små vannkraftverketil bruk for utarbeidelse av regionale planer og i NVEs konsesjonsbehandling. Olje-og ener-gidepartementet, Oslo.
OJEC, 2000. Directive 2000/60/EC of the European Parliament and of the Council of 23 October 2000 establishing a framework for Community action in thefield of water policy. Official J. Eur. Communities L 327/1.
Parliament, 2001. St.meld. nr. 42 (2000e2001) Biologisk mangfold.
Parliament, 2007. St.meld. nr. 26 (2006e2007) Regjeringens miljøpolitikk og rikets miljøtilstand.
Quigley, J.T., Harper, D.J., 2006. Effectiveness offish habitat compensation in Canada in achieving no net loss. Environ. Manage, 351e366.
Ruud, A., Haug, J.J.K., Lafferty, W., 2011. Case Hardanger. En analyse av den formelle konsesjonsprosessen og mediedekningen knyttet til den omsøkte luftledningen Sima-Samnanger. SINTEF Energi.
Schmutz, S., Schinegger, R., Muhar, S., Jungwirth, M., 2010. Ökologischer Zutand der Fliessgewässer Österreiches e Perspektiven bei unterschiedlichen Nutzungsszenarien der Wasserkraft. Ôsterr. Wasser-und Abfallwirtschaft, 162e167.
Skjeggedal, T., Arnesen, T., Kveli, J., Marhus, G., Thingstad, P.G., Wollan, G., Aasetre, J., 2005. Inngrepsfrie naturområder som verktøy for arealforvaltning. Nord-Trøndelagsforskning.
Smit, B., Spaling, H., 1995. Methods for cumulative effects assessment. Environ. Impact Asses 15, 81e106.
Statkraft, 2013. Smøla Wind Power Farm. http://www.statkraft.com/Images/ Faktaark%20Sm%C3%B8la%20Wind%20Farm%20ENG%20Sept%202011_tcm9-17664.pdf(accessed 16.12.13.).
Strickland, M.D., Arnett, E.B., Erickson, W.P., Johnson, D.H., Johnson, G.D., Morrison, M.L., Shaffer, J.A., Warren-Hicks, W., 2011. Comprehensive Guide to Studying Wind Energy/Wildlife Interactions. Prepared for the National Wind Coordinating Collaborative, Washington, D.C., USA.
Subramanian, M., 2012. An ill wind. Nature 486, 310e311.
Timdal, E., Bratli, H., Haugan, R., Holien, H., Tønsberg, T., 2010. Lav‘Lichenes’. In: Kålås, J.A., Viken, Å., Henriksen, S., Skjelseth, S. (Eds.), Norsk Rødliste for Arter 2010. Artsdatabanken, Trondheim.