DELIVERABLE D4.1
Project Acronym: EMMA
Grant Agreement number: 621030
Project Title: European Multiple MOOC Aggregator (EMMA)
D4.1 Learning analytics: theoretical background, methodology and
expected results
Revision: 1.0
Authors
Name (Organization) Tammets, K. (TLU)
Name (Organization) Laanpere, M. (TLU)
Name (Organization) Eradze, M. (TLU)
Name (Organization) Brouns, F. (OuNL)
Name (Organization) Padron Napoles, C.L. (ATOS) Name (Organization) De Rosa R. (UNINA)
Name (Organization) Ferrari, C. (IPSOS) Due Date of Deliverable: 31.07.2014
Start date of project: 01.02.2014
Duration 30 months
Leading organisation for this document Tallinn University
PROJECT CO-‐FUNDED BY THE EUROPEAN COMMISSION WITHIN THE ICT POLICY SUPPORT PROGRAMME
l Dissemination level
PU Public
CO Confidential, only for members of the consortium and the Commission Services X PP Restricted to other program participants
This project has been funded with the support of the Competitiveness and Innovation Framework Program (CIP) – ICT Policy Support Program(ICT PSP) of the European Union
REVISION HISTORY AND STATEMENT OF ORIGINALITY
Revision History
Revision Date Author Organisation Description
0.1 5.06.14 Kairit Tammets TLU First draft and structure
0.2 7.07.14 Kairit Tammets TLU Sections 3.3; 4; 4.1; 4.2
0.3 09.07.14 Francis Brouns, Carmen Napoles Padron
Ounl / Atos Review
0.4 10.07.14 Kairit Tammets, Mart Laanpere TLU Sections 1, 2; 5
0.5 15.07.14 Kairit Tammets, Mart Laanpere TLU Section 4
0.6 17.07.14 Maka Eradze TLU Section 3.1
0.6 18.07.14 Kairit Tammets, Mart Laanpere TLU Section 5
0.7 21.07 Francis Brouns, Rosanna De Rosa Ounl / Unina Sections 2, 3, 4
0.8 21.07 Maka Eradze TLU Section 3.2
0.9 23.07 Chiara Ferrari IPSOS Sections 2.2. - 3.1 - 4
1.0 23.07 Kairit Tammets TLU Formatting and final
version
Statement of originality:
This deliverable contains original unpublished work except where clearly indicated otherwise. Acknowledgement of previously published material and of the work of others has been made
Table of content
1. Executive summary ... 4
2. Introduction ... 5
2.1 Summary of project ... 5
2.2 Description of the pilot evaluation work package ... 5
2.3 Approach to learning analytics ... 8
2.4 Description of the deliverable ... 9
3. Learning analytics ... 10
3.1 Learning analytics concept and framework ... 10
3.2 Learning analytics methods ... 14
3.3 MOOCs and learning analytics ... 17
4. Learning analytics methodology in EMMA ... 22
4.2 EMMA learning analytics dashboard ... 29
4.3 Integrating learning analytics into EMMA evaluation framework ... 31
5. Expected results ... 33
5.1 Learning analytics methodology for MOOCs in EMMA platform ... 33
5.2 Learning analytics application ... 33
1. Executive summary
The purpose of the EMMA project is to showcase excellence in innovative teaching methodologies and learning approaches through the large-scale piloting of MOOCs on different subjects.
The main objectives related with the implementation of learning analytics in EMMa project are to:
● develop the learning analytics methodology for MOOCs based on the xAPI (Experience) specification;
● design and develop the learning analytics application for the EMMA platform by combining the EMMA tracking tool, the Learning Record Store and dashboard visualisation applications;
● evaluate the learning analytics methodology and application iteratively. The aims related to the goals of learning analytics are to:
● raise the awareness of the MOOCs’ participants’ learning activities and social structures in the course context;
● provide feedback for MOOC designers and instructors about their course designs based on the participants’ patterns and behaviour in MOOCs.
This deliverable provides an overview of the theoretical background on learning analytics, the technical architecture of the EMMA learning analytics application, describes how learning analytics are related to the other activities and tasks of the workpackage and indicates the expected results of the implementation of learning analytics.
2. Introduction
2.1 Summary of project
The purpose of the EMMA (European Multiple MOOC Aggregator) project is to showcase excellence in innovative teaching methodologies and learning approaches through the large-scale piloting of MOOCs on different subjects. To achieve this, EMMA will provide a system for the delivery of free, open, online courses in multiple languages from different European universities to help preserve Europe’s rich cultural, educational and linguistic heritage and to promote real cross-cultural and multilingual learning. The project will last for 30 months and began in February 2014.
EMMA will operate in two main modes; as an aggregator and hosting system of courses produced by European universities; and as a system that enables learners to construct their own learning pathways using units from MOOCs as building blocks. The EMMA team are taking a deliberate multi-lingual, multi-cultural approach to learning by offering inbuilt translation and transcription services for courses hosted on the platform.
The first MOOCs will be offered to the public in September 2014 and there will be a continuous flow of MOOC offerings in the following 22 months of the project.
Learning analytics are applied to support both the learner in making the most of their learning performance and the teachers/designers to get input on the effectiveness of their design and to allow them to optimise the learner support during the delivery.
2.2 Description of the pilot evaluation work package
The description of work (DoW) describes the aims and activities of work package (WP) 4 that focuses on the evaluation of the pilots. In the pilot phase, several MOOCs will be made available on the EMMA platform. The aim of WP4 is to identify the proper methodology to be used for
assessing the proposed services and engagement achieved; create an assessment tool for measuring the success of the pilots and the aggregator; assess the effectiveness of the tool for learning and evaluate transcriptions and translations. WP 4 is tightly related with the WP 3 (Pilot operation). The aim of the WP 3 is to prepare the pilot MOOC courses, including quality assurance and pedagogical aspects, inserting required metadata to enable “harvesting” approach, customizing the required ICT infrastructure and preparing multi-lingual signposting language, mobilizing and activating the users that will participate in each pilot, and training authors, teachers and users where necessary to exploit the services. Deliverable 3.1 describes the pilot operation with the first MOOCs that will be piloted and form the basis of the learning analytics pilot evaluation.
The work package is divided into several tasks. Task 4.1 aims to develop the learning analytics methodology, which will be described in the current deliverable. Task 4.2 focuses on measurement, collection, analysis and reporting of data about learners and their response to the online context and content, for the purposes of monitoring learning activities, dropout rates and follow-up as well as understanding and optimizing learning and the environments in which it occurs: this task will be accomplished via online questionnaires which will reach the learners at given times, i.e. their Registration on EMMA Platform (“Registration Questionnaire”), their first access to a course (“Expectation Questionnaire”) and their completion (“Exit Questionnaire”). Task 4.3 focuses on data analysis that would provide useful information on student engagement and success at various stages of the learning process and will lead to an understanding of what type of MOOC is a valid and sustainable model for adoption in the future. Task 4.4 is related with the overall cyclical evaluation of the EMMA project. This task will evaluate the pilot services also as separate building blocks and as a whole complex of Emma activities for their effectiveness and the degree to which they achieve their objectives and can be replicated in new deployments. The evaluation will furthermore enable the consortium to see how students use EMMA, gauge their response to this new type of learning environment and provide some solid indicators for best-practice for the ongoing MOOC design. Results of the service and business model evaluation will be used to feed into the exploitation plan.
Learning analytics is part of the work package, and although it is focused in task 4.1, learning analytics provide the data and input for the other tasks. In addition, questionnaires to be completed by the participants form an important part of evaluation of the EMMA project, to supplement the learning analytics mainly with qualitative insights. By implementing learning
analytics into the EMMA platform, it is possible to obtain additional valuable information about participants’ real behavior on the platform in addition to their own judgments provided via the questionnaires. Learning analytics methodology enables to cluster the participants based on their patterns in their learning behaviour in the MOOCs and to approach them with relevant questions in the evaluation phase. So, both learning analytics and questionnaires are tools for measuring learning behaviour on the platform, in the learning community and in the social media context. Additionally, the data collected by the questionnaires will enable the consortium to profile learners as per the main socio-demographic variables (age, gender, educational background, professional profile, country origin, …) and per additional variables (such as knowledge of languages) which will produce an interpretative framework to the learning behavior analysis. Moreover, in the subsequent steps of data collection and analysis - Task 4.3 and Task 4.4. the matching between expectations and accomplishments will enable the partners to measure the success of the pilot as for the micro and macro objectives: micro-objectives being the success of each single course - EMMA operating mode 1 - and/or personal learning pathway - EMMA operating mode 2. Macro-objectives being the five challenges that EMMA pilot has set, and which are described below.
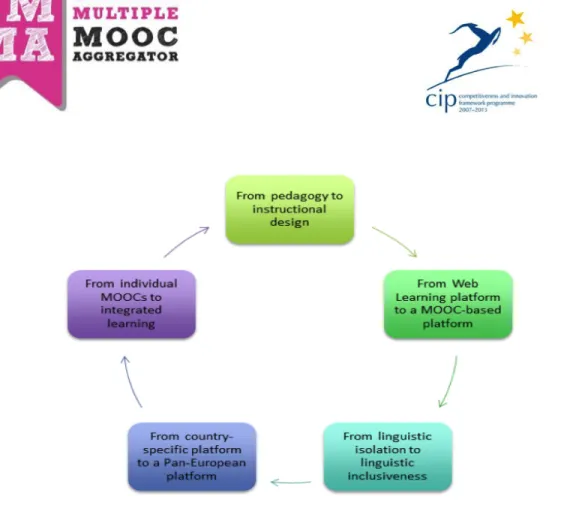
As already described in D3.1, the project aims at investigating how to meet the five challenges (see below Figure 1 - five challenges for the EMMA pilot) that EMMA faces. That is in part accomplished by developing the EMMA MOOC platform specifically to meet those challenges. and in part by designing MOOCs to be run on the EMMA platform. Evaluation of each of these aspects is carried out in several manners. Learning analytics can provide valuable insights specifically for those challenges where the learner reactions are meaningful, as they are able to indicate that a specific issue is emerging within a broader view of the project (i.e. cultural/linguistic possibility of integration; cognitive overload versus high/low level of interaction; transferring model to non-Emma partners etc.).
Figure 1: Five challenges for the EMMA pilot (D3.1)
The development of the learning analytics methodology is indirectly associated with work package 2 (System implementation and integration) as well and especially with the tasks related with the development of the tracking tool. The tracking tool tracks the participants’ digital traces based on the input coming from learning analytics methodology task (T4.1) and exchanges the data with the used Learning Record Store (LRS). Analysis of the data stored in LRS provides the possibility to visualize MOOC’s learning activities in EMMA platform.
2.3 Approach to learning analytics
Learning analytics in EMMA project will focus on: a) real-time analytics through learning analytics dashboards for instructors and students; b) retrospective analysis of the digital traces in EMMA platform. First approach aims to support participants’ learning activities whereas the second approach is intended for more in-depth analysis of the MOOCs and overall EMMA evaluation. As EMMA is a MOOC platform then calculating the dropout and clustering the
participants will be one of the research aims. Additionally uptake of the knowledge, students’ progress and social structures emerging from MOOCs will be analyzed in the pilot phase.
2.4 Description of the deliverable
This deliverable is presented at the end of the M6. As the pilots have not started and empirical data of the learning analytics application is not available, the deliverable 4.1 provides a conceptual description of the learning analytics methodology for the EMMA platform. Section three provides an overview of the theoretical background related to the learning analytics discourse. Firstly, the concept of learning analytics is defined and the framework of Greller and Drachsler (2012) introduced. The section ends with an overview of how the learning analytics has been implemented in the context of the MOOCs. The next section - nr 4 - exposes the learning analytics methodology and the description of the application in the EMMA context. The technical architecture of the EMMA tracking tool that stores the learning activities based on the xAPI standard, learning record store and dashboard application will be presented. Finally the expected results of implementation of the EMMA learning analytics will be discussed.
3. Learning analytics
3.1 Learning analytics concept and framework
One of the leading definitions of learning analytics suggests that it is the “the measurement, collection, analysis and reporting of data about learners and their contexts, for purposes of understanding and optimizing learning and the environments in which it occurs”. This definition had been set out at the 1st International Conference on Learning Analytics and Knowledge1. The field is still emerging, rapidly developing and it experiences “a gradual shift away from technology towards an educational focus”, while the three main drivers for learning analytics have been defined as technological, pedagogical and political/economic (Ferguson, 2012).
Siemens (2014) believes that the systemic use of learning analytics to improve teaching and learning is still emerging, because it arrived to education later than to government, education and business. To him, learning analytics is a “bricolage field, incorporating methods and techniques from a broad range of feeder fields: social network analysis (SNA), machine learning, statistics, intelligent tutors, learning sciences, and others”.
There are different drivers influencing the development of learning analytics, conceptualized by Ferguson (2012) as challenges: 1. Big Data - a challenge for its volume, difficulty to handle the interaction data and most importantly extracting value from the big data-sets. 2. Online Learning that poses an educational challenge - how to optimize opportunities for online learning. 3. Political Concerns - how to improve learning opportunities and results at different levels. Ferguson believes that these drivers draw attention to the three groups of interest - governments, educational institutions and teachers/learners. The development of learning analytics shifts the balance between the three drivers and three groups.
Chatti, Dyckhoff, Schroeder et al (2012) offer a four dimensional reference model to learning analytics where the major questions are asked:
● What? What kind of data does the system gather, manage, and use for the analysis? ● Who? Who is targeted by the analysis?
● Why? Why does the system analyze the collected data?
● How? How does the system perform the analysis of the collected data? Based on these questions, the following dimensions are drawn upon:
Data and environments (what) - since LA is very data-driven, the question of data source is important. Sources are divided in two major categories: Centralized educational systems (LMSs) that have built-in tools and distributed learning environments (that are often Personal Learning Environments) where the user-generated content leads to vast amount of data produced across several environments and systems. This issue is a widely discussed one. Siemens believes, that LMSs are adopted as learning analytics tools and reflect the learner's interactions within a system. The capabilities of tracking and visualization of interaction data has also been limited (Ferguson, 2012; Long & Siemens, 2012). Distributed networks and physical world interactions present additional challenges for analytics - most LMS analytics models do not capture activity by online learners outside of an LMS (i.e., in Facebook, Twitter, or blogs) (Ferguson, 2012; Long & Siemens, 2012). The similar problem persists with the physical world i.e. offline “data” - library uses, learning support, in case of blended learning - the part of the learning that happens outside of LMS, online or offline. Long & Siemens (2012) suggest mobile devices as prospects of linking the divide between the physical and digital worlds by capturing location and activity. Similarly, clickers in classrooms can be integrated with data from learners’ activity in online environments, providing additional insight into factors that contribute to learners’ success. Suthers and Rosen (2011) think that the fragmented data may not reflect the analytic needs. According to Chatti et al (2012) the challenge is to find ways to aggregate and integrate raw data from multiple and different sources frequently available in various formats.
Stakeholders (who?) - stakeholders can be represented by several groups: students, teachers, (intelligent) tutors/mentors, educational institutions researchers and system designers. All of these will have different goals and expectations from LA. Its tools shall provide intended objective of improving teaching and learning and avoid conflicts that stakeholders might have between them. To Chatti et al (2012) this integration of LA into
everyday practice of different stakeholders might represent a challenge. This is where the data privacy and ownership comes into play - data misuse, boundaries of analytics and identity protection must be determined and exercised.
Objectives (why?) - Objectives may vary to different stakeholders. Among several possible objectives of LA monitoring, analysis, prediction, intervention, tutoring/mentoring, assessment, feedback, adaptation, personalization, recommendation, and reflection are listed.
Methods (how) - the following methods are listed in this category: statistics, information visualization (IV), data mining (DM), and social network analysis (SNA).
Greller and Drachsler (2012) give a general framework for learning analytics and offer focusing attention to six critical dimensions within the research lens. According to the framework, each of the dimensions can have several values and it can be extended upon a need. Represented dimensions are: stakeholders, objectives, data, instruments, external constraints and internal constraints.
Stakeholders: they can be data clients and at the same time data subjects, who are also
data suppliers; in some cases, where the LA app feeds back the information to the
learners instead of the teacher, the two stakeholders’ group becomes one.
Objectives: based on the importance of learning analytics in unveiling and contextualizing hidden information on learning processes, the objectives can be fundamentally two: reflection - self-evaluation on all the levels of the hierarchy of information flow between the stakeholders. Prediction: predicting and modeling learner activities which can be helpful for interventions. Authors argue that some LA technologies are not pedagogically neutral.
Educational data: datasets can be protected or open (in this case, should be anonymized).
Instruments: educational data mining technologies, statistics, machine learning, social network analysis, natural language processing all can be relevant to LA. This dimension also includes conceptual instruments like theoretical constructs, algorithms or weightings. Authors think that “competing methods, technologies and algorithms applied to the same set of data, will result in different outcomes and thus may lead to different consequences in terms of decision making based on these outcomes”.
External constraints: conventions like: ethics, personal privacy and similar social limitations and norms: like laws, or specific policies or standards.
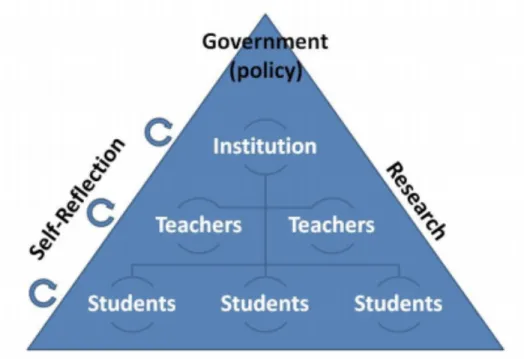
Internal constraints: competences and acceptance are listed as internal constraints. Greller and Drachsler (2012) also give a model of information flow between the stakeholders and it is based on the common hierarchical model of formal education; the pyramid-shape is an illustration of how data analysis from a lower layer can inform the above layer.
Figure 2: Information flow between LA stakeholders (Greller & Drachsler, 2012)
According to the Greller and Drachsler (2012) framework, the ethical side of the use of personal data is listed in the external limitations of learning analytics. One way of overcoming the
constraints of using personal data in research is to develop new policies and guidelines that will prevent the data abuse. But the fundamental question in finding the solution is who does the data belong to. In the current situation data belongs to the owner of the data collection tool, data client and beneficiary, though with the development of new technologies (sensors, location tracking, face-recognition), it may become evident that there may not exist so called “informed consent” due to the unawareness or approval of the user. There is also a question of handling the data - who handles what kind of data within an institution; in order to leverage all the potential of LA all levels of data shall be integrated. One truth remains: the more access a data client has to data subject information, the higher is the responsibility.
3.2 Learning analytics methods
According to Baker and Siemens (2013) in the near future the use of data and learning analytics will grow even more. Its importance in the understanding of learning will substantially increase with its sophisticated methods contributing both to theory and practice.
As learning analytics is inherently interdisciplinary, it has connections to many fields. Chatti et al (2012) see the learning analytics roots (concepts and methods) in the following fields: academic analytics, action research, educational data mining, recommender systems, and personalized, adaptive learning. Although these methods and concepts are really connected to learning analytics, from the broader perspective, two following research fields are connected in a way that often special attention is given to their differentiation; learning analytics and educational data mining communities research focus and methods overlap. For this reason when discussing learning analytics methods, it is important to underline similarities and differences with educational data mining.
Educational data mining and learning analytics are have somewhat similar definitions:
“Educational Data Mining is an emerging discipline, concerned with developing methods for
to better understand students, and the settings which they learn in”. (De Liddo, Buckingham Shum, Quinto et al, 2011)
“The measurement, collection, analysis and reporting of data about learners and their contexts, for purposes of understanding and optimizing learning and the environments in which it
occurs”2
According to Siemens and Baker (2012), similarities between these overlapping fields also include: Data-intensive approaches to studying learners and learning, goal of improving education and basis of research, can drive planning, decision-making, interventions.
EDM has its methods for inferring meaning from the datasets. Baker and Yacef (2009) give the following methods: ● Prediction ● Classification ● Regression ● Density estimation ○ Clustering ○ Relationship mining ● Association rule mining ● Correlation mining ● Sequential pattern mining ● Causal data mining
○ Distillation of data for human judgment ○ Discovery with models
These methods can have 4 main application: 1. improvement of student models, 2. discovering or improving models of a domain’s knowledge structure, 3. studying pedagogical support, 4. Searching for empirical evidence in order to refine and extend educational theories and phenomena, to gain more extensive understanding of what factors influence learning, in some cases to improve learning systems (De Liddo et al 2011).
As Long and Siemens (2012) have suggested, learning analytics has different methods for different levels:
● Course-level: learning trails, social network analysis, discourse analysis ● Educational data-mining: predictive modeling, clustering, pattern mining
● Intelligent curriculum: the development of semantically defined curricular resources ● Adaptive content: adaptive sequence of content based on learner behavior, recommender
systems
● Adaptive learning: the adaptive learning process (social interactions, learning activity, learner support, not only content)
According to Siemens & Baker (2012), there is a distinction in the discovery type – both communities use automated discovery or human judgment for visualization and other methods but the EDM is more focused on automated discovery while LA relies more on human judgment. If EDM uses human judgment its again for the sake of labelling classification and LA still makes use of automated discovery to inform humans that make final decisions. Another distinction is the focus of LA - its more focused on inform and empower learners and instructors. Third factor is that EDM is more looking for reducing phenomena to components and analyzing components whilst LA researchers emphasize understanding systems as wholes.
In general, EDM is more looking towards developing new algorithms and models and LA applies these models in instructional systems. “EDM develops methods and applies techniques from statistics, machine learning, and data mining to analyze data collected during teaching and
learning. EDM tests learning theories and informs educational practice. Learning analytics
applies techniques from information science, sociology, psychology, statistics, machine learning, and data mining to analyze data collected during education administration and services, teaching, and learning. Learning analytics creates applications that directly influence
educational practice” (Buckingam Shum, 2012).
Chatti et al (2012) sees the process of learning analytics as iterative process that involves the following steps:
1. Data collection and pre-processing - using DM methods like data cleaning, data integration, data transformation, data reduction, data modeling, user and session identification, and path completion
2. Analytics and action -discovery of patterns using different LA methods and taking action as it is a primary aim of the whole learning analytics process.
3. Post-processing - for improvement of learning analytics it is crucial to compile data from new sources, refine it and determine new attributes for a new iteration etc.
3.3 MOOCs and learning analytics
MOOCs are believed to change the education, as with no cost to entry or exit MOOCs it will attract learners with a wide range of backgrounds and aims. In the past years MOOCs have entered the mainstream and several platforms for designing and conducting MOOCs have been developed e.g. Edx3, Udacity4, Miriada5, Udemy6, Iversity7, Coursera8. Clearly, all the platforms for MOOCs provide the opportunities to collect a lot of data about learners’ online behavior and digital traces. Still, there is nearly no evidence that the collected data is used with learning analytics purposes – to provide (real-time) feedback to participants’ learning activities or to support instructors to improve course designs. Despite of that, data from the MOOCs is the research interest of several learning analytics researchers and MOOCs have been analyzed from different learning analytics perspectives. For understanding MOOCs and benefits of learning analytics, it is important to distinguish types of MOOCs with different pedagogies. Clark (2013) has provided one example of taxonomy of eight types of MOOCs’ categorization based especially on pedagogy:
● transferMOOCs: a copy of an existing eLearning course into a MOOC platform, where the pedagogic framework follows the standard process of teachers transferring knowledge (lectures, short quizzes, set texts and assessments) to students. An example would be the courses offered by Coursera;
3http://www.edx.org 4http://udacity.com 5http://www.miriadax.net 6http://www.udemy.com 7http://iversity.org
● madeMOOCs: make a more innovative use of video and have a more formal and quality driven approach to the creation of material while assignments pose more difficulty for the students. An example would be the courses offered by Udacity;
● synchMOOCs: well structured courses that follow fixed dates for start, end, assessments, etc. In this way, students can plan better their time and undertake the course more effectively. Both Coursera and Udacity offer these courses;
● asynchMOOCs: The opposite of synchMOOCs fall into this category. This type of MOOCs have no or frequent start dates, together with flexible deadlines for assignments and assessments;
● AdaptiveMOOCs: provide more personalised learning activities to the students by adapting the content they see, according to their progress in the course. The Gates Foundation has highlighted this approach as key for future online courses;
● GroupMOOCs: An idea for more effective MOOCs is the type of groupMOOCs that actually restrict student numbers to ensure students’ collaboration and eventually their performance. As a course progresses, sometimes the groups will be dissolved and reformed again;
● ConnectivistMOOCS or cMOOCs: This type of MOOCs will be described below;
● MiniMOOCSs: These are shorter MOOCs that focus on content and skills that can be learned in a small timescale. They are argued to be more suitable for specific tasks with clear objectives.
In the EMMA project mainly cMOOCs and xMOOCs are distinguished. cMOOCs is built on connectivism (Kop & Hill, 2008). In contrast, xMOOCs is based on behaviorist pedagogy that relies on information transmission (Bates, 2012). Siemens (2012) notes that cMOOCs focus on knowledge creation and generation whereas xMOOCs focus on knowledge duplication. From the learning analytics perspectives it is valuable to know if the MOOCs are designed for consuming or creation and building of knowledge.
In MOOCs, the participants are clustered often based on their engagement, patterns or behavior. Kizilcec, Piech and Schneider (2013) analyzed participants’ learning trajectories and suggested four prototypical engagement patterns: a) completing: learners who completed most of the assessments; b) auditing: learners who watched lectures and infrequently completed assessments; c) disengaging: learners who completed assessments in the beginning of the course but then
decreases in engagement; d) sampling: learners who watched lectures for only one or two periods (sometimes only one video) Authors believe that using these patterns as a lens to more closely analyze learner behavior and backgrounds across the different trajectories, it is possible to suggest research and design directions for future courses. Milligan, Littlejohn & Margaryan (2013) analyzed the cMOOC’s participants patterns of engagement based on their own judgment and clustered the participants to: a) active – maintain active blogs, Twitter accounts and actively participate in discussions; b) lurker - actively follow the course but do not actively engage with other learners within it; c) passive. In Milligan’s et al (2013) study, the distinction between lurkers and passive participants reflects the observation that most of the lurkers were content with their participation in the cMOOC, whereas passive participants seemed frustrated with the course and their behavior indicates that they did not want the autonomy to choose where, when, how, and with whom to learn. Authors claimed that understanding the nature of learners and their engagement is important to the success of any online education provision, especially those where there is an expectation that the learner should self-direct their learning. Tabaa & Medouri (2013) used the following categorization of the MOOC participants based on their patterns: a) ghosts – as long as a MOOC course is activated, this category of students registers to the course but at no time signs in. This category is usually the largest in terms of the number of enrolled students; b) observers – this category of students actually registers for the course, signs in, and might as well explore course materials. However, they do not carry out any kind of evaluations apart from basic quizzes found on lecture videos; c) non-completers – the majority of students fall into this category; they have recourse to MOOCs course materials to assist them study for and succeed in other courses. Essentially, those students attempt to use different course resources but do not accomplish the whole course; d) passive participants – these students might consume each course material: watch lectures, complete quizzes, and interact with other learners and lecturers. Nevertheless, they do not participate in the course homework and projects; e) active participants – active participants are students who actually planned to take part of a MOOC course; they attend the lectures, accomplish the homework, interact with other participants, and complete all evaluations forms. In an analysis of Anderson, Huttenlocker, Kleinberg et al (2014) based on a set of large MOOCs offered by Stanford University, five different categories of student behavior and engagement styles were identified: a) viewers - primarily watch lectures, handing in few if any assignments; b) solvers - primarily hand in assignments for a grade, viewing few if any lectures, c) all-rounders - balance the watching of lectures with the handing in of assignments; d) collectors - primarily download lectures, handing in few assignments, if any.
Unlike Viewers they may or may not be actually watching the lectures; e) bystanders - registered for the course but their total activity is below a very low threshold. Results of Anderson et al (2014) claim their provision of engagement styles based on activity traces shows that while the issue of students “dropping out” of MOOCs points to a genuine and important distinction in types of student activity, it is arguably a distinction being made at too superficial a level.
Nevertheless, unquestionably the most analyzed aspect of MOOCs’ seems to be the completion rate and percentage of the participants who dropout from the courses. Jordan (2014) analyzed nearly 300 MOOCs that were conducted in Coursera, EdX, and Udacity platforms and found that the majority of courses have been found to have completion rates of less than 10% of those who enroll, with a median average of 6.5%. But Jordan stresses that it is inappropriate to compare completion rates of MOOCs to those in traditional bricks-and-mortar institution-based courses and there are potentially many ways in which MOOC students may participate in and benefit from courses without completing the assessments. She also remarks that completion rates should not be ignored entirely and looking at completion rates is a starting point for better understanding the reasons behind them, and how courses could be improved for both students and course leaders.
Next step from calculating the dropout rate of the MOOCs participants is the analysis of the participants’ behavior in order to predict their dropout position. Halawa, Greene & Mitchell (2014) defined the dropout position and provided the dropout prediction merit, which had quite promising results and through their choice of predictive features, it is possible to spot risk signals at least 2 weeks before dropout for over 60% of the students. Tabaa & Medouri (2013) claimed in their study that few studies have addressed the issue of “at-risk” students’ identification and designed the learning analytics application for MOOC environment with the aim to identify the “at-risk” students in MOOC environments. Clow (2013) introduces the concept of “funnel of participation” in MOOCs, which describes the different stages in which learners get aware, subscribe and become participants of a MOOC.
In the MOOC community it has been some time under discussion that there is a need to critically re-think if the dropout rate is a negative phenomena and that it is important not only to focus on dropout-type of students, but also on drop-in-type of students (Hill, 2013). It is quite evident that
most of the participants in MOOCs are purposefully selecting some of the weeks to participate with the relevant materials and they don’t aim to finish the course or get the certificate. The label “drop-ins” have been used as an opposite to the “dropouts” who do not finish the courses. Therefore, the quality of the MOOCs could not be measured in ways it is done in traditional higher education courses (completion rates, grades etc.). Additionally, the study of Liyanagunawardena, Parslow & Williams (2014) that focused on analyzing the concept of dropout from the students’ perspective illustrated that such crude classification of dropout is not fit for this purpose and students, and suggest to look at dropouts in a new perspective considering situational factors of participants such as when they have joined the course and their intentions for the course.
Regardless of that, it is widely agreed that it would be valuable to improve the retention rates of MOOCs by finding out why and at what stage students are dropping out of courses. But such analysis should focus on rather the different domains that are buzzing or reactions of the participants to different modules, how many people return to the course and its modules and so on. Clow (2013) have argued that dropout is expected to be this steep and that numbers are actually not that bad when considered in context. Still, the need to analyze those dropout figures according to the different and unique context where the learning takes place in MOOC settings is stressed (Clow, 2013).
It is evident that implementing learning analytics applications into the MOOCs platforms is important for analyzing the learners’ experiences and course designs for instance to find out when and why students leave the courses. Few attempts have been made to integrate the learning analytics applications to MOOCs platforms, but one of the options is not to provide real-time learning analytics and investigate the patterns after the course experience. E.g. Fournier, Kop and Sitlia (2011) investigated the possibilities to use existing learning analytics tools for analyzing MOOCs. They conducted a thorough analysis of their own MOOC by using a mixed method approach. Quantitative analyses exposed a basic level of assessment and reporting on learner activity, on whether participants are actually doing something, in this case either inside the Moodle environment and corresponding activity outside the environment including Blog and Twitter activity being tracked with the #course tag. Qualitative tools and approaches (e.g. SNAPP, Nvivo, NetDraw) demonstrated how deep exploration of content can reveal the types of
contributions made, as well as the knowledge, ideas, thinking, information, tools, and experience that promote learning along the way. Authors concluded that from their use of the tools it seemed that learning analytics tools can be powerful in giving meaning to interactions and actions in a learning environment, providing scope for personalized learning and the creation of more effective learning environments and experiences.
The studies mentioned above illustrate that MOOC researchers and MOOC providers have used learning analytics for analyzing their courses in quite different ways. At the same time it is quite evident that the studies mainly considered dropout, completion rates and different clusters of users based on their engagement with the content, still mainly from the perspective of a MOOC as a formal course for which the main objective is completion. In the next section the learning analytics approach for the EMMA platform will be described, which needs to be more specific to type of MOOCs supported by the EMMA platform and the aim of EMMA to support personalized learning goals and objectives. EMMA learning analytics approach still takes the retention rates and clusters of the users into account, because dropout is important, but will redefined out in the context of a MOOC while in addition considering the concept of drop-in. Such clustering enables to approach the participants more personally by taking the different types of users and their personal learning objectives into account. This is accomplished by making use of a variety of both qualitative and quantitative analyses.
4. Learning analytics methodology in EMMA
Studies about MOOCs and learning analytics have been mainly focused on dropout rates and clustering of users as discussed in the previous section. The Greller and Drachsler (2012) framework indicates there are two aims for learning analytics: reflection and prediction, though few studies seems to have focused on that so far. There are some studies describing dashboards (see section 4.2) that reflect the learning experience to users, but still these don’t focus on MOOCs. Therefore EMMA presents a novel approach to learning analytics by focusing much more on supporting learners in reflecting on the learning experience and interactions, and predicting progress, while not forgetting about dropout, completion rates and valuable management information for course designers. The main aim of implementing learning analytics
in EMMA platform is to support students’ awareness of their progress and provide meaningful learning activities. As EMMA is a MOOC platform, then there is a need to pay attention to dropout and provide information to course designers on how to improve their course. However, EMMA intends to move beyond that and provide personalized feedback to individual learners. Although the EMMA platform also acts as a regular MOOC platform, allowing providers to design and conduct their MOOC courses, the EMMA platform is more than that. The EMMA platform acts as an aggregator for European MOOCs and is designed to support personalization not only in the design of the MOOCs offered by providers, the provision of multilingual support in video transcription and translation, but also by providing a personal learning environment (PLE) that allows learners to pick and mix from those sections of the various MOOCs on offer that they consider important and relevant and build their own personalized courses. In EMMA, learning analytics are applied to provide reflection opportunities to learners to assist them in monitoring their learning process and controlling the achievement of their learning goal, as well as prediction opportunities to give feedback to the course providers so they could enhance their course design. Moreover, the EMMA platform is designed and optimized for this learning analytics approach.
One of the characteristics of EMMA platform is the integration of a video transcription and translation system. As a result, seven transcription systems (English, Italian, Spanish, French, Dutch, Portuguese and Estonian) and eight translation systems (from Italian, Spanish, French, Dutch, Portuguese and Estonian into English; and from English into Italian and Spanish) are provided. One of the aims of the learning analytics methodology is to investigate if the automatic translation module has an impact on learners’ progress, but this activity is combined with the evaluation instruments developed by IPSOS in WP4. The first draft of the questionnaires is published in Deliverable 3.1 and final versions and the results will be published in Deliverable 4.2. The aim is to investigate if there are more enrolments because our MOOCs are offered in multiple languages, if that leads to more students actually starting with the MOOC, or if it results in more students completing the MOOC?
Unit of analysis in EMMA learning analytics framework
Buckingham Shum (2012) differentiates micro, meso and macro level of learning analytics. Micro-level analytics supports the tracking and interpretation of process-level data for individual learners and by extension, groups (Buckingham Shum, 2012) and has been the level of analysis chosen for the EMMA platform, without ignoring the other levels. Powell and MacNeill (2012) have identified a number of drivers for the micro-level application for learning analytics. These include:
● Individual learners using analytics to reflect on their achievements and patterns of behavior in relation to their peers
● Identification of students who may require extra support and attention
● Helping teachers and support staff to plan supporting interventions with individuals and groups
● Enabling functional groups, such as course teams, to improve current courses or develop new curriculum offerings
● Providing information to help institutional administrators to take decisions on matters such as marketing and recruitment or efficiency and effectiveness measures.
In the EMMA context the micro-level learning analytics is oriented at the activity and event, which consists of interaction between a subject (learner), an object (any learning material/activity included in the MOOC) and is bounded with a verb (action performed), because this is the most suited to provide feedback at personalized level. The EMMA learning analytics methodology aims to go beyond the analysis of frequencies of the learning interactions, but instead to focus on sequences of the activities and activity patterns. EMMA learning analytics methodology relies at theoretical level on two grounds: the uptake framework proposed by Suthers and Rosen (2011) and the artefact-actor-networks theoretical model (Reinhardt, Moi & Varlemann, 2009). The uptake framework handles the event as the core if the aim is to understand which interactions have lead the learners to learning experience. The uptake framework presumes that interactions are fundamentally relational, which means that the unit of analysis is not an isolated act, but consists of relationships between acts (Suthers & Rosen,
2011). A history of research in computer-supported collaborative learning shows that learning is enhanced through collaboration and discourse (Stahl, Koschmann & Suthers, 2006). In the EMMA platform, the discussion functionality that acts as forum, provides the opportunities for social learning in different MOOCs. The Artefact-Actor-Networks (AANs) links social networks and artefact networks in order to make claims about the semantic relatedness between users and their respective artefacts. The resulting Artefact-Actor-Networks allow making claims about the ties between artefacts from multiple sources and the actors involved in their creation, modification and linkage (Reinhardt, Moi & Varlemann, 2009). Such approach enables in EMMA e.g. to cluster the social networks based on the artefacts used, shared and accessed by different participants.
Analysis of the digital traces in EMMA platform has two perspectives: real time and retrospective analytics. Firstly the aim is to develop the real-time learning dashboards for the EMMA platform for students and instructors. Students’ dashboards enable to raise students’ awareness of their learning activities by providing overview of the progress or social structures in the course context. Instructors’ dashboard provides feedback to course designers about the activities during the course. Dashboards will be described more detailed in the current deliverable section 4.2. Beside the real-time analysis of the interactions, retrospective analysis will be performed with the aim to research the learning analytics implementation within the MOOCs context. In the pilot phase of the MOOCs in EMMA platform, the following analysis will be performed:
● Clustering of the participants - In the pilot phase, MOOC participants of EMMA platform will be clustered as: a) enrolled (explicitly “enrolled” the course); b) not started (enrolled, but have not returned to course); c) lurker – enrolled and has returned to the course once; d) passive – enrolled and has accessed one material and participated in one discussion or submitted one assignment; e) active – has accessed 50% of the materials and submitted 50% of the assignments or participated in 50% of the discussions; f) drop-ins – enrolls, but is active in one-two weeks only. There is a chance that in EMMA participants can be at the same time “active” and “drop-ins”. The dropout rate will be also calculated, but after excluding the lurkers and drop-ins. Clustering enables to get insights about participants’ behavior, which is needed for evaluating the courses and analyze for example in what stage the participants become less active. As the EMMA approach
supports the participants to combine their own courses from different building blocks of different MOOCs, then calculating the completion rates is not the primary interest of EMMA. Pilot phase evaluation demonstrates in which way it is possible or needed to cluster the participants.
● Progress and performance - Students’ progress in EMMA MOOCs is measured in accordance with the course lessons. Each course consists of lessons that consist of several units. Units consists of the materials, videos and assignments. Progress will be analyzed based on following events: a) accessed learning resources – learner has accessed n number of materials in given module; b) 'completed' learning activities - learner has indicated that activity has been completed; activity is considered to be completed when learner submits an assignment; activity is also completed when assignment is graded and passed, when quiz has been passed and the expected learning goals had been achieved; c) time spent on materials – for how long the student has read the learning resources, watched the videos, spent on the course in general; d) grades and results – what level the learning activities has been performed. Progress will be visualized in the students' dashboards. Students can see their efforts during the whole course or within a module. ● Uptake of knowledge - In EMMA the learning analytics approach for the uptake of
knowledge is mainly related with the social structures and has to consider available functionalities of EMMA. The uptake is mainly analyzed based on the interactions in the conversation functionality (later also weblog and comments could be added to the analysis). The posts, replies and comments in discussion board are also considered as the basis for social network analysis of the course participants and will be used to visualize the groups of learners within the MOOCs that will be of interest for the MOOC providers and participants.
● Social structures - social network and artefacts analysis will be performed in order to find out what kind of social structures emerge in the MOOC context and in which way the materials and resources mediate between the participants and what kind of networks emerge around the materials or artefacts.
● Engagement with the content - for supporting the evaluation of the course design, access and use of the learning materials will be evaluated. The intensity and frequency of the accessed learning materials will be provided to the MOOC instructors
After analysing the results of the pilot phase, adjustments to methodology or technical application could be made, which will be described in further deliverables D.2.4, D.4.4 or D.4.5. As for connection with the other Tasks in the WP4, the platform functionalities include the possibility to assign each single learner a unique ID number which will allow the data coming from the different partners to be connected and analyzed in their interactions, which means that - for example – it is possible to analyse the profiles of the learners pertaining to each cluster, to identify if high performance learners have recurring profiles, or have expressed specific expectation or, if and how the satisfaction for a course or for a specific unit have a relation with the uptake of knowledge.
4.1 Technical architecture of the EMMA learning analytics application
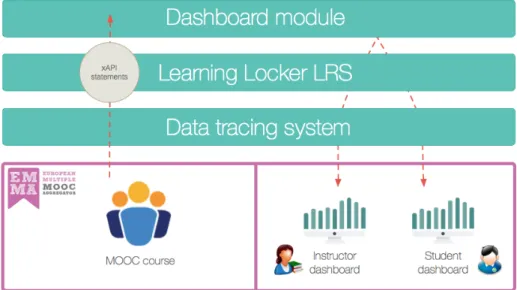
The technical architecture of the EMMA learning analytics application is complex and consists of several technologies. Figure 3 illustrates the components of the architecture: tracking system, learning record store (LRS) Learning Locker for storing the tracked events, dashboards for MOOC participants and MOOC instructors.
Nowadays one of the main interoperability specifications that is used in the learning analytics domain and also in EMMA for analyzing the learning is the Experience API9 or xAPI . xAPI has had a wave of interest and implementation since its conception in 2010 by the Advanced Distributed Learning ADL10 (Cooper, 2014). The objective of the xAPI, according to Glahn (2013), is to express, store and exchange statements about learning experiences, which has two primary parts: a) focus on the syntax of the data format; b) the second part defines the characteristics of “learning record stores” (LRS). At the core of the xAPI are the statements about learning experiences. The xAPI is based on the idea of tracking activity through Activity Streams, which was developed to provide a better way of expressing social media activity than existed before (Cooper, 2014). xAPI provides a framework for making statements of the kind “someone does an action to/with something”, for example “Jane posts reflection in weblog”. As xAPI is geared towards storing learning experiences it offers good opportunities for the personalized advice foreseen in EMMA. The context (social ties, groups, activity duration) and also semantics and used tags are also part of the tracked learning activities in EMMA analytics for conducting more in-depth analysis and provide meaningful dashboards. Another framework that may support the analysis of the context of the learning experience is the IMS Caliper11,
which provides a Learning Activity centric focus to standardize on metrics as actions and related context. Currently this framework is still under development and will be not used in the pilot phase of the MOOCs, but based on the first phase evaluation of the learning analytics application in EMMA, next steps with the Caliper could be planned. Caliper aims to include more about the course context with metric profiles, but both xAPI and Caliper adopt the same idea of making statements like “John commented blogpost", which means that it is possible to keep both standards compatible.
The xAPI specification details a Learning Record Store (LRS) as store of tracking statements communicated through the xAPI. The EMMA tracking tool exchanges the xAPI format with the LRS, which is able to exchange data with the final application. In the case of EMMA, Learning Locker is the LRS of choice, as it is the reference open-source LRS. Although Learning Locker provides a dashboard to visualize data to participants, in the case of EMMA dashboards will be developed from scratch. Learning Locker functions as intermediate between the tracking tool and
9http://www.adlnet.gov/tla/experience-api/en http://www.tincanapi.com
10 http://www.adlnet.gov
the dashboards. The dashboards are made available to the participants (learners and instructors) in the EMMA platform. Next we provide more details about the EMMA learning analytics dashboard.
4.2 EMMA learning analytics dashboard
Verbert, Govaerts, Duval, Santos, van Assche, Parra and Klerkx (2013) categorized the learning analytics dashboards that have been developed in recent years into three types:
● dashboards that support traditional face-to-face lectures - Often the general objective of these dashboards is to support the teacher in receiving live feedback from students during large lectures in order to adapt her teaching
● dashboards that support face-to-face group work - focus on classroom orchestration and support for teachers to manage group work (e.g. visualizes which activity each group is doing (building models, doing quizzes, running simulations, etc.) and to check the intensity of such work
● dashboards that support awareness, reflection, sense- making, and behavior change in online or blended learning. E.g. Course Signals (Arnold & Pistilli, 2012) or dashboard by Carnegie Mellon University (Dollár and Steif, 2012), which both focus on prediction and visualization of learning outcomes based on three data sources: grades in the course so far, time on task, and past performance.
Several other learning analytics dashboards have been developed e.g. for raising the awareness of the learning activities with the focus of self-assessment, time spent on materials, artefacts produced, results of self-assessments, strong and weak topics based on self-assessments, social interactions, used resources, progress student has made toward specific activities of the course as commenting blogs and tweeting, contributions to forum, and so on.
Stephens-Martinez, Hearst and Fox (2014) monitored MOOCs and conducted a survey among the MOOC instructors a) to find out what information sources MOOC instructors prefer that assist in identifying key trends and behaviors in both student performance and student interaction with course content; and b) how these sources should be presented, to be able to develop tools
and visualizations instructors will find most useful. Their results indicated that instructors value seeing student performance, activity patterns such as what materials students looked at, and forum behavior to gauge participation.
The focus of the EMMA learning analytics dashboard will be to support awareness and sense-making of the learning activities in online settings, based on the Verbert’s et al division. From Stephens-Martinez et al (2014) work, the instructors’ preferences have taken into account when designing the learning analytics dashboards for the students and instructors in EMMA platform. Instructors’ dashboard visualizes:
a) students’ progress during the lesson or the course as a whole. Instructor will be informed how many of the students (%) have submitted the assignments, are in progress (assignments accessed, but not submitted) or not started (assignments not accessed);
b) lessons’ overview. Instructor will be informed what is the overall progress in different lessons within the course (%) – assignments performed, materials accessed, time spent on materials.
Weekly the snapshot of social interactions will be visualized in the course context based on posts and replies in discussion section and comments in blog (visualized through SNA). Different sub-communities that interact with each other often, will be visualized with different colors.
Students’ dashboard visualizes in real time:
a) social interactions in the course context based on posts and replies in discussion section and comments in blog (visualized through SNA). Different sub-communities that interact with each other often, will be visualized with different colors.
b) progress in the course context based on the performed self-assessment tasks and assignments, accessed materials and time spent on them, participation in discussion and number of activities completed.
There seems to be few studies that focus on recommender dashboards in MOOCs, which is one of the directions in EMMA platform. In Emma, the learner has a chance to choose from different modules in different MOOCs and to create their personal coursebook for supporting personalized bottom-up approach to learning. For supporting students to find suitable MOOCs and select needed modules for their coursebook, their dashboard will provide meaningful recommendations.
4.3 Integrating learning analytics into EMMA evaluation framework
The EMMA evaluation framework will therefore comprise results coming from analyzing both the actions – Learning Analytics - and the opinions – questionnaires data - related to these actions. In fact, as described above, each learner accessing EMMA will be assigned a unique ID number. This will mean that the Learning Analytics of each individual could be matched to his/her opinions on the various contents, tasks, and actions required and/or executed. During the Pilot, the framework will have a circular feed in which actions and opinions will be analyzed as a continuum, so that changes resulting from decisions taken after analysis will be implemented along with the development of the platform.
Progress within the platform will activate the delivery of the relevant questionnaire: for example,
· the Registration Questionnaire with all the profiling variables will be activated automatically at the time of first access
· the link to the Expectation Questionnaire will be sent to each learner when accessing the MOOC offer
· the link to the Exit Questionnaire (s) will be sent at the time of completion, where “completion” will be defined as per the clustering description contained herein (re. page 18-19) and / or any other types of group which will be highlighted by the Learning Analytics during the course of the Pilot
For example, for a student taking a “regular” course, at the time of completion a “standard” Exit Questionnaire will be released, containing all the relevant questions on satisfaction with what he/she has accomplished and with each of the main components of the course. This will allow the relevant partner to understand what worked well and what worked less in the course they have proposed and – if considered relevant – to adjust weaker points accordingly.
In the case of an Individual Learning Path, the Exit Questionnaire will have a different form and composition in questions and will be aimed at assessing whether the learner managed to find the “ideal” blocks to compose his/her personalized learning path and how satisfied he/she is with the final outcome. Of course, various types of outcomes will be monitored so that drop outs will be classified according to the intentions of the learners when they enter EMMA and the results and reasons why they have dropped out at a certain time (via the Exit Questionnaires).
The Learning Analytics and the learner classification will benefit from the “qualitative” contribution of the survey-based data. Among other results we expect that – in due time - non-university-based learners profiles will enrich the scenario of this MOOCs pilot platform. Also, some variables of the Learning Analytics might be used as cross-variable in the process of analysis and reporting, which is due periodically during the Pilot duration.
The combination of actions and opinions will thus constitute an ongoing record of the platform performance; it will also constitute the common ground for reflection and discussion among partners, and will be available for speculation and production of hypotheses.
5. Expected results
5.1 Learning analytics methodology for MOOCs in EMMA platform
The pilots and later implementations will provide insight into and evaluation results of the learning analytics methodology for MOOCs of Task 4.1. Testing and evaluating the methodology iteratively with several MOOCs will provide sufficient empirical ground for analyzing the MOOCs designs, completion rates and user behavior in course context. Such methodology would be valuable input for MOOC providers and platform developers to see the benefits and bottlenecks of implementing learning analytics in MOOCs context.
In the pilot phase of the MOOCs in EMMA platform, aim is to provide:
● different clusters of the MOOC participants based on their activity patterns and engagement with the content;
● an overview of the participants’ progress during the course;
● social network analysis of the participants including the intensities of the networks and uptake of knowledge, but also resources that mediate between the participants and what kind of networks emerge around the materials or artefacts;
● analysis of engagement with the content - frequencies of using the materials in order to support the MOOC designs.
5.2 Learning analytics application
EMMA’s learning analytics application is a novel and advanced solution in learning analytics field for MOOCs since it makes a combination of the xAPI specification and the Learning Record Store (LRS) Learning Locker for storing and sharing the learning experiences that is not widely in common by MOOC platforms. In particular because the dashboards for students and instructors that will be developed are based on the collected and analyzed events in EMMA platform and are geared towards the specific conditions that apply to MOOC settings. Moreover,
these dashboards do not only provide feedback about the courses and learning activities, but also offer reflection and monitoring opportunities in support of the personalized learning objectives of the students.
References
Anderson, A., Huttenlocher, D., Kleinberg. J., & Leskovec, J. (2014). Engaging with massive online courses. In proceedings of the 23rd International Conference on World Wide Web, WWW’14, pp. 687-698. Republic and Canton of Geneva, Switzerland.
Arnold, K.E., & Pistilli, M.D. (2012). Course signals at Purdue: using learning analytics to increase student success. In: Shum SB, Gasevic D, Ferguson R (eds) Proceedings of the 2nd international conference on learning analytics and knowledge (LAK ‘12), ACM, NY, pp 267– 270
Baker, R., & Siemens, G. (2013). Educational data mining and learning analytics. In Sawyer, K. (Ed.) Cambridge Handbook of the Learning Sciences: 2nd edition.
Baker, R., & Yacef, K. (2009). The State of Educational Data Mining in 2009: A Review and Future Visions. Journal of Educational Data Mining, 1(1), 3-17
Buckingham Shum, S. (2012). Learning Analytics. UNESCO Policy Brief. Retrieved from
http://iite.unesco.org/pics/publications/en/files/3214711.pdf
Chatti, M.A., Dyckhoff, A.L., Schroeder, U., & Thüs, H. (2012). A reference model for learning analytics. Int. J. Technology Enhanced Learning, 4(5/6), 318–331.
Clark, D. (2013). Taxonomy of 8 types of MOOC. Retrieved from http://ticeduforum.akendewa.net/actualites/donald-clark-taxonomy-of-8-types-of-mooc