This is a repository copy of Wheat root system architecture and soil moisture distribution in an aggregated soil using neutron computed tomography.
White Rose Research Online URL for this paper: http://eprints.whiterose.ac.uk/152696/
Version: Accepted Version Article:
Mawodza, T., Burca, G., Casson, S. et al. (1 more author) (2020) Wheat root system architecture and soil moisture distribution in an aggregated soil using neutron computed tomography. Geoderma, 359. ISSN 0016-7061
https://doi.org/10.1016/j.geoderma.2019.113988
Article available under the terms of the CC-BY-NC-ND licence (https://creativecommons.org/licenses/by-nc-nd/4.0/).
eprints@whiterose.ac.uk https://eprints.whiterose.ac.uk/
Reuse
This article is distributed under the terms of the Creative Commons Attribution-NonCommercial-NoDerivs (CC BY-NC-ND) licence. This licence only allows you to download this work and share it with others as long as you credit the authors, but you can’t change the article in any way or use it commercially. More
information and the full terms of the licence here: https://creativecommons.org/licenses/ Takedown
If you consider content in White Rose Research Online to be in breach of UK law, please notify us by
1
Wheat Root System Architecture and Soil Moisture Distribution in an Aggregated Soil
1
using Neutron Computed Tomography.
2
Tinashe Mawodza1*, Genoveva Burca2, Stuart Casson1, Manoj Menon3 3
1Department of Molecular Biology and Biotechnology, The University of Sheffield, Western 4
Bank, Sheffield S10 2TN, United Kingdom 5
2STFC, Rutherford Appleton Laboratory, ISIS Facility, Harwell, OX11 0QX, UK 6
3Department of Geography, The University of Sheffield, 9 Northumberland Rd, Sheffield S10 7
2TN 8
* Corresponding author E-mail address: tmawodza1@sheffield.ac.uk 9
Non-invasive techniques are essential to deepen our understanding of root-soil interactions in 10
situ. Neutron computed tomography (NCT) is an example of such techniques that have been 11
successfully used to study these interactions in high resolution. Many of the studies using 12
NCT however, have invariably focused on lupine plants and thus there is limited information 13
available on other more commercially important staple crop plants such as wheat and rice. 14
Also considering the high neutron sensitivity to hydrogen (e.g. water in roots or soil organic 15
matter), nearly all previous in-situ NCT studies have used a relatively homogeneous porous 16
media such as sand, low in soil organic matter and free from soil aggregates, to obtain high-17
quality images. However to expand the scope of the use of NCT to other more commercially 18
important crops and in less homogenous soils, in this study we focused on wheat root growth 19
in a soil that contained a considerable amount of soil organic matter (SOM) and different 20
sized aggregates. As such, the main aims of this research were (1) to unravel wheat (Triticum 21
aestivum cv. Fielder) root system architecture (RSA) when grown in an aggregated sandy 22
loam soil (<4 mm) with 4% SOM content, (2) Map in 3D, soil water distribution after a brief 23
drying period and (3) to understand how the root system interacts with soil moisture 24
2
distribution brought about by soil structural heterogeneity. To achieve these, wheat seedlings 25
were grown for 13-days in aluminium tubes (100 mm height and 18 mm diameter) packed 26
with soil and imaged for the first time at the IMAT neutron beamline (in the Rutherford 27
Appleton Laboratory, UK). To the best of our knowledge, this is also the first study to use 28
NCT to study wheat root architectural development. Our study proved that NCT can 29
successfully be used to reveal wheat RSA in a heterogeneous aggregated soils with moderate 30
amounts of SOM. Lateral root growth within the soil column was increased in regions with 31
increased finer soil separates. NCT was also able to successfully map water distribution in a 32
3D and we show that large macro-aggregates preferentially retained relatively higher soil 33
moisture in comparison to the smaller soil separates within our samples (Fig. 1). This 34
highlights the importance large macro-aggregates in sustainable soil management as they 35
may be able to provide plants water during periodic dry spells. More in situ investigations are 36
required to further understand the impact of different aggregate sizes on RSA and water 37
uptake. 38
39
Figure 1: NCT image of a 13-day old wheat seedling root growing in an aggregated sandy 40
loam soil. The colour map indicates water distribution within the soil column. 41
42
Key Words: Wheat, Root architecture, Neutron Computed tomography; Water dynamics
3
1. Introduction
44
The seemingly insurmountable task of feeding a growing global population with increasingly 45
limited natural resources is one of the greatest challenges facing humanity in the 21st century 46
(Borlaug and Dowswell, 2003; Lal, 2016). With the effects of climate change threatening to 47
further disturb global production patterns across the world, it is imperative for the research 48
community to devise possible strategies to increase global crop productivity in the 49
forthcoming decades (IPCC, 2007; Knox et al., 2012). This will require a deeper 50
understanding of factors affecting crop production systems using contemporary technologies. 51
One such area of research that has received increased attention of late is that of belowground 52
root-soil interactions. These interactions are a vital part of the crop production system as 53
plants acquire the majority of the resources they use for production via these associations and 54
thus increasing our understanding of these interactions may hold the key for a ‘second green 55
revolution’ required to feed a rapidly growing population (Gewin, 2010; Lynch, 2007; Rich 56
and Watt, 2013). 57
Understanding root-soil interactions especially amongst the worlds’ major cereal crops 58
(maize, wheat, rice) is of paramount importance for the attainment of sustainable global food 59
security as these crops provide more than two thirds of all human dietary energy (Cassman, 60
1999; FAOSTAT, 2019; Khoury et al., 2014). This understanding is crucial for wheat in 61
particular as it is arguably the worlds’ most important staple food crop. It accounts for more 62
than 15% (220 million ha) of global arable land use, (the highest for any cultivated plant) 63
and often yields in excess of 700 million metric tonnes of grain per annum globally 64
(FAOSTAT, 2019). In spite of its great importance however, yield gaps in wheat production 65
still exist, often as a result of poor adaptation of its root system to varying edaphic conditions 66
(Senapati and Semenov, 2019; Waines and Ehdaie, 2007). As such increased research into 67
root-soil interactions in wheat to tailor its root system for different soil environments is 68
4
pivotal for improving wheat yields especially in marginal areas (Alahmad et al., 2019; 69
Figueroa-Bustos et al., 2018; Waines and Ehdaie, 2007). 70
Traditionally these root-soil interactions have been investigated using either inference root 71
health from the development of above ground parts (shoots) or by the more labour intensive 72
invasive soil excavation methods (Pierret, et al. 2005). These observations however, although 73
useful, lacked critical root developmental detail required to make conclusive inferences into 74
how best to improve plant productivity (Mooney et al., 2012). Even when elements of the 75
root-soil interactions were deduced, high throughput measurements were often very difficult 76
to obtain which limited research into subterranean interactions. 77
The advent of non-invasive soil imaging in the late 70’s marked a significant step forward in 78
the study of plant-soil interactions with technologies such as X-Ray Computed Tomography 79
(X-Ray CT) (Crestana, et al, 1986; Keyes et al., 2013; Tracy et al., 2013; Ahmed et al., 2016; 80
Blunk et al., 2017; Burr-Hersey et al., 2017; Koebernick et al., 2017), Magnetic Resonance 81
Imagery (MRI) (Metzner et al., 2015; Pflugfelder et al., 2017; Stingaciu et al., 2013), Nuclear 82
Magnetic Resonance imaging (NMR)(Bačić and Ratković, 1987; Brown et al., 1991; 83
Southon, et al, 1992) and Neutron imaging (NI) (Willatt, et al, 1978; Furukawa, et al. 1999; 84
Menon et al., 2007; Tötzke et al., 2017) being used to answer a multitude of questions about 85
root-soil interactions in great detail. Of these technologies NI has been the most effective 86
non-invasive soil imaging technique used when studying water dynamics and root growth 87
within the soil due to its high sensitivity to hydrogen which is abundant in water (Robinson, 88
et al. 2008). Willatt. et al, (1978), demonstrated the use of this method for the first time, 89
successfully imaging roots of different plants (soya bean and maize) growing in soil. 90
Subsequently this technology was used by in many studies including Willatt and Struss 91
(1979), Couchat et al., (1980), Bois and Couchat, (1983), (Nakanishi, et al 1992) as well as 92
Furukawa, et al. (1999). Two papers by Menon et al (2007) and Moradi et al., (2009) also 93
5
provided a comprehensive, accurate description of NI that subsequently led to even more 94
insightful studies using NI. 95
Initial plant experiments with NI involved the use of 2 dimensional neutron radiography (NR) 96
to study the root architectural properties in situ (Bois and Couchat, 1983; Couchat et al., 97
1980; Willatt and Struss, 1979) using thin slabs made of aluminium. The most extensively 98
used plants in NI have been maize (Zea mays L.) pioneered in experiments by Willatt, et al. 99
(1978) and lupine (Lupinus albus L.) first used by Nakanishi, et al. (1992) with the majority 100
of papers being published on NI in plant-soil interaction mainly focusing on them. Research 101
in soil NI has since moved on to the study of more complex root-soil processes such as 102
dynamics of water flux and the extent of rhizosphere which had previously been difficult to 103
study using other techniques (Carminati et al., 2010; Oswald et al., 2008). Visualisation of 104
water movement coupled with the ability to use tracers such as heavy water (D2O) in NI has 105
led to a better understanding of water uptake and transport in specific roots with 106
Zarebanadkouki, et al. (2013) showing that most of the water uptake in 3 week old lupine 107
plants is carried out by the lateral roots with the tap root mainly acting as a conduit for 108
upwards water movement. 109
Unlike NR, there have been fewer studies that have used neutron computed tomography 110
(NCT) to study soil-root water dynamics despite the fact that computed tomography has the 111
potential to provide even more detailed 3D visualisation of plant-soil systems as compared to 112
NR. Its uptake may have been limited by the size of the specimen that can be successfully 113
imaged in detail (usually no more than 20mm in diameter) as well as the time required for 114
such images to be taken, which is much longer than that for individual neutron radiographs 115
(Warren et al., 2013). The initial work done by Tumlinson et al., (2008) and Esser et al., 116
(2010) with maize seedlings and lupine seedlings showed that visualisation of root and water 117
distribution dynamics in soils can be visualised successfully in 3D using NCT with improved 118
6
root-soil contrast as compared to other non-invasive imaging techniques. Moradi et al., 119
(2011) went a step further in their study with lupine plants showing that water dynamics at 120
the microscale can be accurately observed in 3D and thus can be used in complex and precise 121
modelling operations explaining rhizosphere water flux. Recent advancement in NCT by 122
Zarebanadkouki et al., (2015) who visualised 3D water dynamics of lupine plants in real 123
time, provide great prospects of the use of NCT in further plant-soil interaction studies. 124
Regardless of the recent advancements in NCT in plant-soil interaction studies, there are 125
some important limitations for this technique. For example, all of the previous studies 126
utilising NCT have used soils containing no less than 90% sand, which are mostly devoid of 127
organic matter or macro-aggregates. Therefore, for a wider application of this method it will 128
require testing further using a variety of soil textures and structures. Also conspicuous in 129
many NI studies to date is the absence wheat root architectural investigations using this 130
technology despite the crop being major contributor to global food security. As such it is 131
important to test the feasibility of the use of NI on wheat plants, with the aim of enhancing 132
knowledge on wheat roots and their interactions with soil moisture. 133
In this paper, we thus aimed at determining the 3D root architecture of wheat seedlings grown 134
in an aggregated sandy loam soil with 4% organic matter content using NCT. Our specific 135
objectives were to use NCT to: a) Map 3D wheat root architectural distribution within an 136
aggregated sandy loam soil b) Visualise in 3D, soil water distribution after a brief drying 137
period and (c) to understand how the root system architecture interacts with soil moisture 138
distribution as brought about by soil structural heterogeneity within an aggregated soil. 139
140
141
7
2. Materials and methods
143
2.1 Sample preparation and plant growth 144
The soil used in this experiment was a sandy loam soil (70% Sand, 17% Clay, and 13% Silt) 145
obtained from Cove farm (53°30'03.7"N 0°53'57.2"W) and had an organic carbon content of 146
5.59%. This soil was air dried and mechanically sieved through a 4mm sieve to eliminate 147
large clods and aggregates. The sieving produced a dry aggregate size distribution of 24% for 148
particles <250µ m, 36% for 250-500µm, 13% for 500-1000 µm, 13% for 1000-2000µm and 149
14% for 2000-4000µm with 4% SOM. This was then packed into specially designed, closed 150
bottom, cylindrical aluminium tubes (18mm internal diameter × 100mm height) to ensure a 151
bulk density of 1.2g cm-3 within the tubes. A single wheat (Triticum Aestivum. L cv. Fielder) 152
seed was sown about 1cm underneath the surface of the soil and the tubes were watered to a 153
volumetric moisture content ( ) of 16.0±3.0% which was experimentally determined (using 154
gravimetric methods) to be the field capacity of our growth tubes. This water content was 155
maintained during the course of this experiment by daily surface irrigation to the 156
predetermined weight corresponding to the above mentioned for each tube. The wheat 157
seedlings were grown for 13 days (starting from date of planting) in a growth chamber 158
maintained at a temperature of 22°C (day)/18°C (night) and a relative humidity of 55% with 159
light intensity averaging 400µmol m2 s-1 with an 8-hour day length. Watering was stopped 4 160
days before neutron imaging was carried out to enhance the contrast between the root and 161
soil. 162
2.2 Neutron computed tomography set up 163
Neutron CT imaging was carried out at the IMAT neutron imaging beamline of the ISIS 164
Neutron and Muon Source at the Rutherford Appleton Laboratory, UK. A more detailed 165
description of the IMAT imaging station can be found in (Burca et al., 2013); Kockelmann et 166
8
al., 2013 and Burca et al., 2018). For these experiments the neutron beam was shaped to the 167
field of view of 112.7 mm × 112.7 mm accompanied by a multiaxial tomography stage 168
allowing for 2 simultaneous scans. The neutron radiographies were acquired with an optical 169
camera box equipped with Andor Zyla 4.2 PLUS sCMOS with 2048×2048 pixels, an 85mm 170
lens and 100 µm 6LiF/ZnS: Ag scintillator. The images produced had a pixel and voxel size 171
of 55 m with 30s being the exposure time for each projection and an L(10000mm) /D
172
(40mm)= 250. The time taken for a single scan of the plants was almost 6 hours with 654 173
radiographs being recorded using a rotation step of 0.55°. This was the best set up achievable 174
on IMAT, suitable for our experiment (Mawodza et al., 2018). 175
2.3 Image reconstruction, root segmentation and analysis 176
The images were reconstructed using the commercial available Octopus 8.9 software 177
(Octopus, 2019), and images were corrected for neutron beam variation and camera noise 178
using the flat images and dark images taken before and after image acquisition (Dierick et al., 179
2004; Vlassenbroeck et al., 2006). We did not use an scattering correction when processing 180
our images. The final reconstructed stack of images were imported into Avizo ® 9.0.1 for 181
root segmentation and analysis (FEI, 2015). 182
We attempted to use automated root segmentation algorithms RooTrack (Mairhofer et al., 183
2012) and Root1 (Flavel et al., 2017) but due to the great heterogeneity in water content both 184
the soil and within roots, these proved unreliable for our samples. To get the best results, 185
roots were manually segmented using the limited range paintbrush editor in the segmentation 186
module in Avizo software. The segmented roots obtained from this process were then used to 187
calculate root lengths, thickness, surface area and volume for each root scan. Segmentation of 188
the larger seminal roots was primarily done using automated thresholding techniques 189
available in Avizo as there was a clear attenuation contrast between the soil and these roots. 190
9
This was however not done universally throughout the whole root system as most of the 191
smaller lateral roots as well as some sections of the larger seminal roots had attenuation 192
values that poorly contrasted or were even lower than that of moist soil and aggregates 193
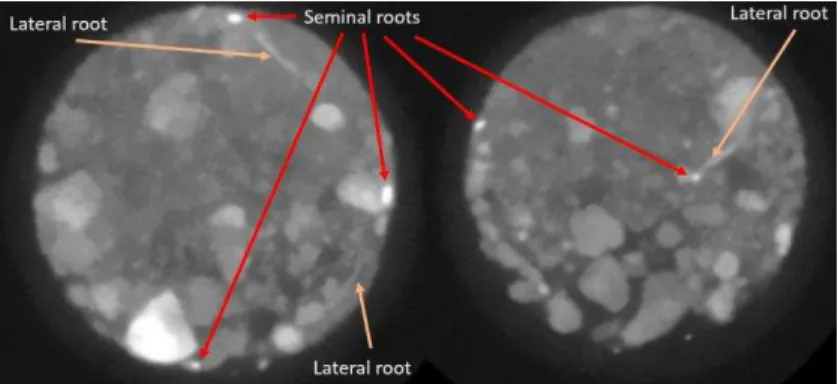
surrounding them as shown in Figure 2. Time consuming manual segmentation based on a 194
combination of localised differences in attenuation and the connectivity of circularly shaped 195
pixel groups (as roots are usually circular in shape) enabled the segmentation of the 196
outstanding lateral roots and seminal root sections throughout the soil columns. Calibration 197
for water content was done using the same soil used in our experiments with known 198
volumetric water contents similar to what was done in Moradi et al., (2011). We then used 199
this calibration to relate the relative neutron attenuation to the moisture content for all the 200
images we acquired. 201
202
Figure 2: Grayscale images used to segment out roots showing how the different root types 203
contrasted with the soil. 204
205
2.4 WinRhizo® root analysis 206
As segmentation was a subjective process, we compared the root properties obtained from 207
our analysis with those obtained from flatbed scanning results analysed using WinRhizo ® 208
(Regents Instruments, Inc.). Therefore, after CT scanning, the soils columns were 209
destructively sampled and the soil was washed off from the roots over a 250µm sieve. The 210
washed roots were then placed in a specially designed water tray and scanned using an Epson 211
10
Expression 10000XL Pro at 600dpi resolution. This scan obtained 2D images of the plant 212
roots which were then analysed using WinRHIZO® 2016a software to determine the root 213
properties (Wang and Zhang, 2009). These roots alongside their shoots were then dried at 214
65°C for 48 hours to obtain their dry biomass. 215
2.5 Statistical analysis 216
All graphs and statistical analysis for these experiments was performed using GraphPad 217
Prism 8.0.1 (https://www.graphpad.com/) with a two tailed paired T tests used to separate 218
means. 219
3. Results
220
3.1 3D wheat root architecture from NCT 221
Three-dimensional root architectural properties of the 13-day old wheat seedlings rendered 222
from neutron scanning were successfully mapped with images in Fig 3. illustrating the 223
different root systems of the six plants that were grown. 224
225
Figure 3: Images revealing the root architecture of the 6 different plants grown 226
11
The root architecture of the plants was broadly similar with an average total root length of 227
89.775 cm ±4.418 (SEM). The plants had 3-5 seminal roots at the time of imaging with least 228
one of the roots (mainly the primary root) having grown to reach to the base of the growth 229
tube they were growing in. Lateral roots of the different plants extended throughout the soil 230
column with visible differences in lateral root growth especially in regions where the seminal 231
roots were in close proximity to larger aggregates (1-4mm) that had large pores in-between 232
them. Lateral roots growing in these regions tended to be fewer and longer whilst those 233
growing in finer soil particles were more numerous but visibly shorter. This can be seen in 234
Figure 4 where due to the random segregation of particles when packing, larger aggregates 235
settled on one side of the column. Roots in some of the columns (plant 1, 4 and 6 in Figure 3) 236
also coalesced together and grew side by side in their downwards trajectory, only 237
disentangling lower down the soil column. 238
239
Figure 4 (Left)Greyscale image of a growth tube showing a segregation of large aggregates 240
towards the left side of growth tube. (Right) increased shorter lateral root growth in regions 241
with finer soil particles whilst lateral roots growing in regions with increased larger 242
aggregates are reduced and longer. The red line demarcates an arbitrary boundary between 243
regions dominated by large aggregates or finer particles. Longer lateral roots are shown in 244
purple whilst short lateral roots are shown in red. 245
12 3.2 Comparison between 3D and 2D root properties 246
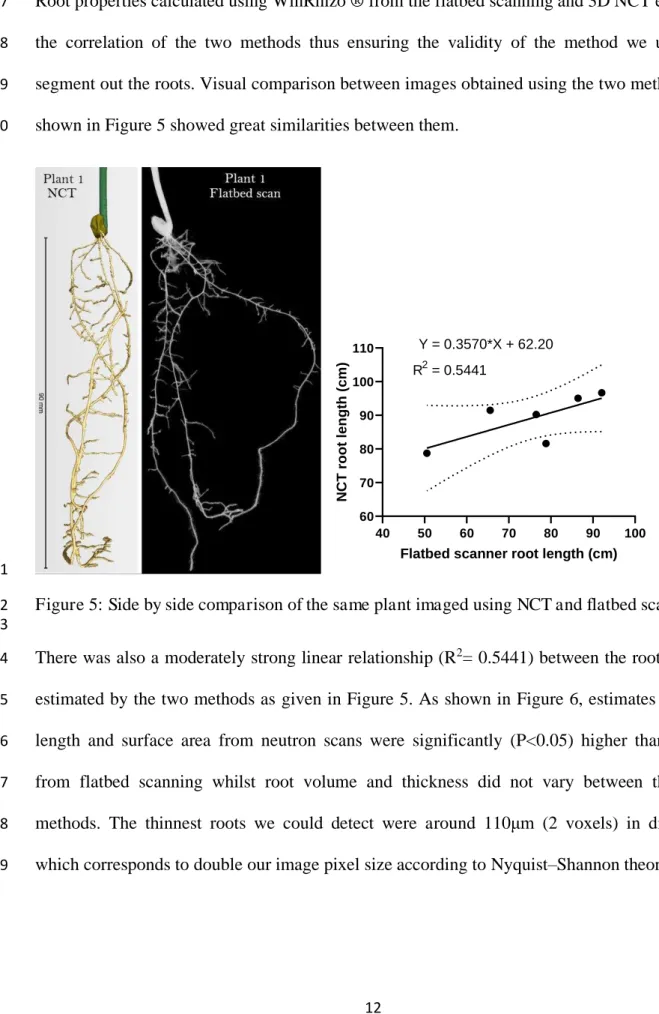
Root properties calculated using WinRhizo ® from the flatbed scanning and 3D NCT enabled 247
the correlation of the two methods thus ensuring the validity of the method we used to 248
segment out the roots. Visual comparison between images obtained using the two methods as 249
shown in Figure 5 showed great similarities between them. 250 40 50 60 70 80 90 100 60 70 80 90 100 110
Flatbed scanner root length (cm)
N C T r o o t le n g th ( c m ) Y = 0.3570*X + 62.20 R2 = 0.5441 251
Figure 5: Side by side comparison of the same plant imaged using NCT and flatbed scanning 252
253
There was also a moderately strong linear relationship (R2= 0.5441) between the root length 254
estimated by the two methods as given in Figure 5. As shown in Figure 6, estimates of root 255
length and surface area from neutron scans were significantly (P<0.05) higher than those 256
from flatbed scanning whilst root volume and thickness did not vary between the two 257
methods. The thinnest roots we could detect were around 110 m (2 voxels) in diameter 258
which corresponds to double our image pixel size according to Nyquist–Shannon theorem. 259
13 260
Figure 6: Comparison of root architectural properties as estimated by flatbed scanning and 261
NCT. a) Root length (P= 0.0250), b) Root surface area, c) Root volume and d) Average root 262
diameter. The error bars indicate Standard Error of the mean and * indicates significant 263
differences (P< 0.05) 264
265
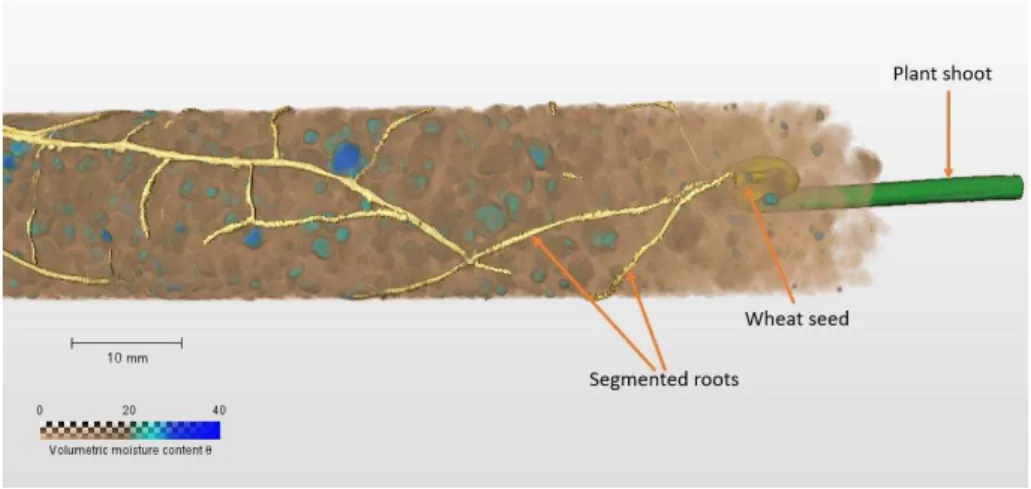
3.3 Soil moisture distribution 266
Similar to root architecture, the visualisation of soil moisture distribution was possible in 3D 267
NCT as illustrated in Figure 7 with neutron attenuation being used as a proxy for using 268
calibrated estimates of water content. These were calibrated by a series of scans of dry soil 269
samples similar (but not identical) to those used for plant growth. It is worth noting however 270
that our estimation of moisture content may encompass an add on effect with the high organic 271
matter which increases neutron attenuation. 272
14 273
Figure 7: 3D NCT rendering of water distribution in aggregated soil where wheat seedling is 274
growing 275
276
Water distribution within the columns was sporadic with regions of increased moisture 277
localisation and depletion throughout the different tubes. Water depletion was greatest in the 278
top 20mm of the soil with soil moisture gradually increasing between 20-60mm from the top 279
of the column until it reached its greatest extent at the base of the tube. Water was largely 280
localised in regions with nearly spherically shape regions within the soil as shown in Figure 281
8. Upon further analysis, it was discovered that this moisture accumulation was mainly 282
associated with the heterogeneously distributed soil aggregates within the soil. As compared 283
to finer particles, all or parts of aggregates have a >20%. 284
285
Figure 8: Showing segmenting out of particles retaining greater >20% 286
15 3.4 Root interactions with soil moisture
287
Wheat roots did not preferentially grow in regions of increased (blue regions with >20). 288
Many of the roots that were observed did not penetrate into water rich aggregates but rather 289
grew around them. Roots that were in direct contact with aggregates with a higher exhibited 290
an increase in their internal . In large pores in-between soil aggregates, roots had reduced
291
which was especially true in smaller lateral roots as opposed to the much larger seminal root 292
network. Some seminal roots however also showed this unexpected internal decrease when 293
growing through larger inter-aggregate pores. The rhizosphere around the roots as shown in 294
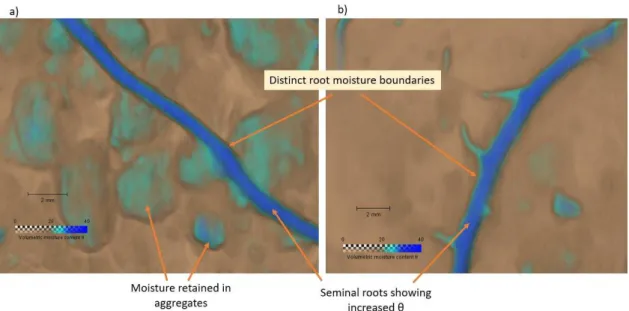
Figure 10, did not show great differences in as compared to the rest of the soil with 295
delineation of the extent of the rhizosphere being difficult decipher. 296
297
Figure 9: Variations in internal water content within roots growing through soil. The top 298
image shows segmented root indicated in yellow whilst in the bottom image, only root 299
moisture content can be visualised 300
16 302
Figure 10: Close up view of the water-map in around seminal roots at a) 3cm and b) 5 cm 303
below the soil surface showing distinct boundaries around the roots 304
4. Discussion
305
4.1 3D NCT wheat root architecture 306
The results presented show that detailed 3D root architectural properties of wheat growing in 307
an aggregated soil with a moderately high organic matter content can successfully be 308
visualised using NCT. To the best of our knowledge, this is the first study to use NCT to 309
study root architectural development in wheat plants in detail. This research also represents a 310
significant step away from many of the previous NCT root architectural studies such as those 311
done by Nakanishi et al., (2005), Moradi et al., (2011), Warren et al., (2013) and Tötzke et 312
al., (2017) that have used predominantly sand soils (with >90% sand). The sand soils used in 313
the previously mentioned studies are more or less homogeneous and often lack aggregation. 314
This study thereby seeks to break with convention by using a heterogeneous, aggregated soil 315
with increased SOM. We recognise however, that the use of an aggregated soils as in this 316
study presents a potential challenge when attempting to segment out wheat roots. This 317
difficulty is brought about by the heterogeneity in soil properties with isolated regions 318
retaining increased moisture and/or being high in organic matter (e.g. soil aggregates) that are 319
17
highly neutron attenuating due to their increased hydrogen content (Robinson, et al. 2008). 320
As a consequence of such features, there is a reduction in the clear attenuation difference 321
between the soil and plant root matter that is characteristic in sand soils thus complicating 322
segmentation as simple thresholding would yield inaccurate results. In this study we were 323
able to overcome such difficulty by both localised thresholding using the increased 324
attenuation and interconnectivity between roots as well as intuitive manual segmentation 325
techniques. 326
This study represents a move away from the use of the leguminous dicotyledonous plant 327
lupine (Lupinus albus. L) that has been popularly studied in many NCT and neutron 328
radiography experiments ever since the pioneering work of (Nakanishi, et al. 1992) and then 329
Menon et al., (2007) who established this plant as a ‘model’ for non-invasive neutron 330
imaging studies in plant-soil systems (Zarebanadkouki et al., 2012; Rudolph-Mohr, et al. 331
2014; Ahmed et al., 2017). Our use of the monocotyledonous graminae family plant, wheat 332
represents one of the first attempts at visualising the RSA of a staple food crop using NCT. 333
Many of the non-invasive imagery done on wheat plants has been carried out exclusively 334
using X-Ray CT (Flavel et al., 2014, 2012; Jenneson et al., 1999; Mooney et al., 2006; Tracy 335
et al., 2012). This study thereby demonstrates the feasibility of using NCT to study the RSA 336
of not only wheat plants but also other staple monocotyledonous crops such as rice and 337
maize. 338
4.2 Comparison between 3D and 2D root properties 339
As the manual segmentation methods we used to reveal root architecture from NCT scans 340
could be subjective, a comparison between the results obtained from NCT scanning and 341
flatbed scanner scanning was done. This is the first time results from NCT have been 342
compared to images flatbed scanning results. Similar correlations have previously been done 343
18
in on X-Ray CT scan root measurements such as those by Tracy et al., (2015) and Flavel et 344
al., (2012). In this study, here was moderately good correlation (R2 = 0.54) between the two 345
methods with respect to key essential root characteristics, root length and volume with 346
estimates from flatbed scanning being significantly lower in root length. This could be 347
explained by the fact that some roots are inevitably lost during washing with literature 348
estimating a loss of about 20-40% of dry matter during storage and washing operations for 349
wheat roots (van Noordwijk and Floris, 1979; Grzebisz. et al, 1989). These losses though, 350
may be partially compensated for by the inability of our NCT to measure and quantify roots 351
less than 110 µm (55µm pixel size ×2) which is 2 times each voxel size that is widely 352
regarded as the effective spatial resolution limit of CT images (Moradi et al., 2011). Roots of 353
this thickness can be picked up by flatbed scanning provided they are not lost during the 354
washing process. 355
4.3 Soil moisture distribution 356
Similar to root system architecture, visualisation of soil moisture distribution was possible in 357
3D with the greyscale intensity acting as a proxy for . The high soil moisture heterogeneity
358
within the scanned tubes was as expected since soil heterogeneity often results in variable 359
hydraulic conductivity throughout the soil which has a direct bearing on the in unsaturated 360
conditions. As plants were surface irrigated, was lowest at the soil surface increasing 361
steadily towards the base of the growth tube. This accumulation of water at the base of the 362
tubes may have been brought about by the lack drainage as they were sealed at the base to 363
allow for accurate determination of the gravimetric water content. Localisation of water as 364
shown in Figure 8, which was presumed to be as a result to the preferential retention of water 365
in aggregates. This preferential water retention was presumed to arise from the pore size 366
distribution within soil aggregates which is often comprised of multiple micro-pores with the 367
ability to store water at higher suctions as opposed to the inter-aggregate pores referred to in 368
19
literature as structural pore spaces that are characteristically bigger and thus can freely 369
transmit water. This preferential water retention however was not universal as some 370
aggregates were also relatively dry at the time of imaging with some parts of the moist 371
aggregates also being relatively drier as compared to the rest of the aggregate. This may 372
suggest that that some aggregates may have pores large enough to drain freely at lower 373
suction levels. 374
Inference of soil moisture status using NCT and neutron radiography is not new with several 375
scholars having shown soil moisture distribution in sand soils. This study builds on their 376
findings adding further complexity by looking at an aggregated soil that has an increased 377
organic matter content. This introduces inaccuracies with the estimation of water content as 378
in such a soil, water is not the only highly neutron attenuating substance as organic matter has 379
increased hydrogen atom content as compared to soil (Robinson, et al. 2008; Tumlinson et 380
al., 2008). This thus means the total attenuation of each voxel is dependent on the water 381
content as well as the organic matter content for the particular volume of soil under review. 382
In this study we calibrated for water content using the same soil at varying levels of , 383
however in doing this we assumed that the organic matter content throughout the soil was 384
constant and variation in attenuation was primarily due to increased soil moisture content. 385
This estimation would be inaccurate especially in regions with localised elevated level of soil 386
organic matter. As such our interpretation of soil moisture distribution should be taken with 387
this in consideration. 388
4.4 Root interactions with soil moisture 389
As roots did not seem to grow preferentially in regions of relative high (are not highly 390
hydrotropic), it is clear that many other factors such as gravity, pore size distribution and 391
nutrient status of the soil may have also contributed to root growth patterns (Kar, et al. 1979; 392
20
Niu et al., 2015; Sato et al., 2015). As roots grew around different aggregates probably as a 393
consequence of trying to find the path of least resistance, many of the roots had good contact 394
with the surface of the moist aggregates. Roots in contact with moist aggregate surfaces 395
seemed to be able to extract water from these aggregates as more often than not, these roots 396
exhibited an increased in . It was striking however that roots growing though large air 397
spaces within the soil in some cases seemed to exhibit a reduction in as they passed through 398
the pore space. This is thought to be as a result of increased evaporative water loss from the 399
root surface within these large air spaces. Such large inter-aggregate pores may thus act as a 400
hindrance to internal root hydraulic conductivity and thus limiting the functionality of roots 401
growing through them. This finding could in part explain some of the observations seen by 402
(Passioura and Stirzaker, 1993) as well as Alexander and Miller (1991) who noticed a 403
general reduction in plant growth when artificial holes are introduced or when plants are 404
grown soils with large aggregate sizes. 405
Another unexpected result from our study was the absence of a distinct region of increased 406
around the roots demarcating rhizosphere soil around the roots as shown in Figure 10. This is 407
contrary to what has been observed in many neutron studies such as those done by (Moradi et 408
al., 2011) who noticed this distinct feature in all the plants they studied. This variation could 409
be as a result of our use of a different textured soil that may not produce such distinct features 410
as soil moisture was heterogeneously distributed within the soil. Differences in plant species 411
difference i.e. wheat used in this study as compared to maize or lupins mainly used in 412
previous studies could also be a contributory factor to our observed differences. Another 413
plausible explanation for this could be in the difference of root segmentation protocols that 414
were used in the different studies. In this case where semi-automatic and manual 415
segmentation was employed based on the roots distinct increased attenuation properties, the 416
edges of the roots could be mistaken to lie within the rhizosphere. This is however unlikely as 417
21
the root thickness as estimated NCT compare well to that found by flatbed scanning. 418
Questions may also be asked about the demarcation of root boundaries in the previous studies 419
as many of these studies did not compare the thickness of the roots found in their scans to 420
those obtained by manual measurement. 421
5. Conclusion
422
NCT was found to be able to reveal root architecture of wheat plants grown in an aggregated 423
sandy loam soil with appreciable amounts of organic matter and inherent heterogeneity. This 424
marks a step forward from the use of predominantly sand soils in NCT, albeit with new 425
challenges of its own. Macro-aggregates increased water storage within the soil with their 426
heterogeneous distribution determining the water distribution patterns across the soil after a 427
period of drying which could help plants water acquisition in times of limited water supply. 428
Lateral root growth was found to be reduced in regions with increased macro aggregates with 429
roots growing through large inter-aggregate pores exhibiting loss of moisture that could 430
potentially limit root function. Our work highlights how soil heterogeneity may affect water 431
distribution and plant-soil interactions thus encouraging the further use of NCT technology to 432
answer questions related soil water distribution in heterogeneous media for better modelling 433
of soil water movement. 434
Funding and Acknowledgements
435
This research was funded as part of a PhD studentship by the Grantham Centre for 436
Sustainable Futures at the University of Sheffield. Neutron imaging beamline grant 437
(RB1820361) was provided by STFC ISIS Facility from Rutherford Appleton Laboratory, 438
UK (Mawodza et al., 2018). 439
Conflicts of Interest
22
The authors declare no conflict of interest. The funders had no role in the design of the study; 441
in the collection, analyses, or interpretation of data; in the writing of the manuscript, or in the 442
decision to publish the results. 443
References
444
Ahmed, M.A., Zarebanadkouki, M., Ahmadi, K., Kroener, E., Kostka, S., Kaestner, A., 445
Carminati, A., 2017. Engineering Rhizosphere Hydraulics: Pathways to Improve Plant 446
Adaptation to Drought. Vadose Zo. J. 0, 0. https://doi.org/10.2136/vzj2016.09.0090 447
Ahmed, S., Klassen, T.N., Keyes, S., Daly, M., Jones, D.L., Mavrogordato, M., Sinclair, I., 448
Roose, T., 2016. Imaging the interaction of roots and phosphate fertiliser granules using 449
4D X-ray tomography. Plant Soil 401, 125–134. https://doi.org/10.1007/s11104-015-450
2425-5 451
Alahmad, S., El Hassouni, K., Bassi, F.M., Dinglasan, E., Youssef, C., Quarry, G., Aksoy, 452
A., Mazzucotelli, E., Juhász, A., Able, J.A., Christopher, J., Voss-Fels, K.P., Hickey, 453
L.T., 2019. A Major Root Architecture QTL Responding to Water Limitation in Durum 454
Wheat. Front. Plant Sci. 10, 436. https://doi.org/10.3389/fpls.2019.00436 455
Bačić, G., Ratković, S., 1987. NMR studies of radial exchange and distribution of water in
456
maize roots: The relevance of modelling of exchange kinetics. J. Exp. Bot. 38, 1284– 457
1297. https://doi.org/10.1093/jxb/38.8.1284 458
Blunk, S., Malik, A.H., de Heer, M.I., Ekblad, T., Bussell, J., Sparkes, D., Fredlund, K., 459
Sturrock, C.J., Mooney, S.J., 2017. Quantification of seed-soil contact of sugar beet 460
(Beta vulgaris) using X-ray Computed Tomography. Plant Methods 13, 1–14. 461
https://doi.org/10.1186/s13007-017-0220-4 462
Bois, J.F., Couchat, P.H., 1983. Comparison of the Effects of Water Stress on the Root 463
23
Systems of Two Cultivars of Upland Rice (Oryza satíva L . ). Ann. Bot. 52, 479–487. 464
Borlaug, N., Dowswell, C., 2003. Feeding a world of ten billion people: a 21st century 465
challenge. … Int. Congr. Wake … 3–23.
466
Brown, D.P., Pratum, T.K., Bledsoe, C., Ford, E.D., Cothern, J.S., Perry, D., 1991. 467
Noninvasive studies of conifer roots: nuclear magnetic resonance (NMR) imaging of 468
Douglas-fir seedlings. Can. J. For. Res. 21, 1559–1566. 469
Burca, G., Kockelmann, W., James, J.A., Fitzpatrick, M.E., 2013. Modelling of an imaging 470
beamline at the ISIS pulsed neutron source. J. Instrum. 8. https://doi.org/10.1088/1748-471
0221/8/10/P10001 472
Burca, G., Nagella, S., Clark, T., Tasev, D., Rahman, I.A., Garwood, R.J., Spencer, A.R.T., 473
Turner, M.J., Kelleher, J.F., 2018. Exploring the potential of neutron imaging for life 474
sciences on IMAT. J. Microsc. 00, 1–6. https://doi.org/10.1111/jmi.12761 475
Burr-Hersey, J.E., Mooney, S.J., Bengough, A.G., Mairhofer, S., Ritz, K., 2017. 476
Developmental morphology of cover crop species exhibit contrasting behaviour to 477
changes in soil bulk density, revealed by X-ray computed tomography. PLoS One 12, 1– 478
18. https://doi.org/10.1371/journal.pone.0181872 479
Carminati, A., Moradi, A.B., Vetterlein, D., Vontobel, P., Lehmann, E., Weller, U., Vogel, 480
H.J., Oswald, S.E., 2010. Dynamics of soil water content in the rhizosphere. Plant Soil. 481
https://doi.org/10.1007/s11104-010-0283-8 482
Cassman, K.G., 1999. Ecological intensification of cereal production systems: yield potential, 483
soil quality, and precision agriculture. Proc. Natl. Acad. Sci. U. S. A. 96, 5952–9. 484
https://doi.org/10.1073/pnas.96.11.5952 485
Couchat, P., Moutonnet, P., Houelle, M., Picard, D., 1980. In situ study of corn seedling root 486
24
and shoot growth by neutron radiography. Agron. J. 72, 321-324 ST-In situ study of 487
corn seedling root. 488
Crestana, S., Cesareo, R., Mascarenhas, S., 1986. Using a computed tomography miniscanner 489
in soil science. Soil Sci. 142, 56–61. 490
Dierick, M., Masschaele, B., Van Hoorebeke, L., 2004. Octopus, a fast and user-friendly 491
tomographic reconstruction package developed in LabView. Meas. Sci. Technol. 15, 492
1366–1370. https://doi.org/10.1088/0957-0233/15/7/020 493
Esser, H.G., Carminati, A., Vontobel, P., Lehmann, E.H., Oswald, S.E., 2010. Neutron 494
radiography and tomography of water distribution in the root zone. J. Plant Nutr. Soil 495
Sci. 173, 757–764. https://doi.org/10.1002/jpln.200900188 496
FAOSTAT, 2019. FAOSTAT database [WWW Document]. Food Agric. Organ. United 497
Nations, Rome, Italy. URL http://www.fao.org/faostat/en/#home 498
FEI, 2015. User’s guide Avizo ® 9 [WWW Document].
499
Figueroa-Bustos, V., Palta, J., Chen, Y., Siddique, K., 2018. Characterization of Root and 500
Shoot Traits in Wheat Cultivars with Putative Differences in Root System Size. 501
Agronomy. https://doi.org/10.3390/agronomy8070109 502
Flavel, R.J., Guppy, C.N., Rabbi, S.M.R., Young, I.M., 2017. An image processing and 503
analysis tool for identifying and analysing complex plant root systems in 3D soil using 504
non-destructive analysis : Root1 1–18. https://doi.org/10.7910/DVN/DXG4AH.Funding 505
Flavel, R.J., Guppy, C.N., Tighe, M., Watt, M., McNeill, A., Young, I.M., 2012. Non-506
destructive quantification of cereal roots in soil using high-resolution X-ray tomography. 507
J. Exp. Bot. 63, 2503–2511. https://doi.org/10.1093/jxb/err421 508
Flavel, R.J., Guppy, C.N., Tighe, M.K., Watt, M., Young, I.M., 2014. Quantifying the 509
25
response of wheat (Triticum aestivum L) root system architecture to phosphorus in an 510
Oxisol. Plant Soil 385, 303–310. https://doi.org/10.1007/s11104-014-2191-9 511
Furukawa, J., Nakanishi, T.M., Matsubayashi, M., 1999. Neutron radiography of a root 512
growing in soil with vanadium. Nucl. Instruments Methods Phys. Res. Sect. A Accel. 513
Spectrometers, Detect. Assoc. Equip. 424, 116–121. https://doi.org/10.1016/S0168-514
9002(98)01279-0 515
Gewin, V., 2010. An underground revolution. Nature 466, 522–533. 516
Grzebisz, W., Floris, W., van Noordwijk, M., 1989. Loss of dry matter and cell contents from 517
fibrous roots of sugar beet due to sampling , storage and washing * 57, 53–57. 518
IPCC, 2007. Climate Change 2007: The Physical Science Basis, in: Solomon, S.D., Qin, M., 519
Manning, M., Chen, Z., Marquis, M., Averyt, K.B., Tignor, M., Miller, H.L. (Eds.), 520
Contribution of Working Group I to the Fourth Assess- Ment Report of the 521
Intergovernmental Panel on Climate Change. Cambridge,UK and New York, USA. 522
Jenneson, P.M., Gilboy, W.B., Morton, E.J., Luggar, R.D., Gregory, P.J., 1999. Optimisation 523
of X-ray micro-tomography, in: 1999 IEEE Nuclear Science Symposium. Conference 524
Record. 1999 Nuclear Science Symposium and Medical Imaging Conference (Cat. 525
No.99CH37019). 526
Kar, S., Varade, S.B., Ghildyal, B.P., 1979. Pore size distribution and root growth relations of 527
rice in artificially synthesized soils. Soil Sci. https://doi.org/10.1097/00010694-528
197912000-00008 529
Keyes, S.D., Daly, K.R., Gostling, N.J., Jones, D.L., Talboys, P., Pinzer, B.R., Boardman, R., 530
Sinclair, I., Marchant, A., Roose, T., 2013. High resolution synchrotron imaging of 531
wheat root hairs growing in soil and image based modelling of phosphate uptake. New 532
26
Phytol. 198, 1023–1029. https://doi.org/10.1111/nph.12294 533
Khoury, C.K., Bjorkman, A.D., Dempewolf, H., Ramirez-Villegas, J., Guarino, L., Jarvis, A., 534
Rieseberg, L.H., Struik, P.C., 2014. Increasing homogeneity in global food supplies and 535
the implications for food security. Proc. Natl. Acad. Sci. U. S. A. 111, 4001–6. 536
https://doi.org/10.1073/pnas.1313490111 537
Knox, J., Hess, T., Daccache, A., Wheeler, T., 2012. Climate change impacts on crop 538
productivity in Africa and South Asia. Environ. Res. Lett. 7, 34032. 539
https://doi.org/10.1088/1748-9326/7/3/034032 540
Kockelmann, W., Zhang, S.Y., Kelleher, J.F., Nightingale, J.B., Burca, G., James, J.A., 2013. 541
IMAT - A new imaging and diffraction instrument at ISIS. Phys. Procedia 43, 100–110. 542
https://doi.org/10.1016/j.phpro.2013.03.013 543
Koebernick, N., Daly, K.R., Keyes, S.D., George, T.S., Brown, L.K., Raffan, A., Cooper, 544
L.J., Naveed, M., Bengough, A.G., Sinclair, I., Hallett, P.D., Roose, T., 2017. High-545
resolution synchrotron imaging shows that root hairs influence rhizosphere soil structure 546
formation. New Phytol. https://doi.org/10.1111/nph.14705 547
Lal, R., 2016. Feeding 11 billion on 0.5 billion hectare of area under cereal crops. 548
https://doi.org/10.1002/fes3.99 549
Lynch, J.P., 2007. Roots of the second green revolution. Aust. J. Bot. 55, 493–512. 550
https://doi.org/10.1071/BT06118 551
Mairhofer, S., Zappala, S., Tracy, S.R., Sturrock, C., Bennett, M., Mooney, S.J., Pridmore, 552
T., 2012. RooTrak: Automated Recovery of Three-Dimensional Plant Root Architecture 553
in Soil from X-Ray Microcomputed Tomography Images Using Visual Tracking. Plant 554
Physiol. 158, 561–569. https://doi.org/10.1104/pp.111.186221 555
27
Mawodza, T., Brooks, H., Burca, G., Menon, M., 2018. Understanding root architecture and 556
water uptake of water use efficient wheat mutants using neutron and X-Ray CT imaging. 557
STFC ISIS Neutron Muon Source Data J. 558
Menon, M., Robinson, B., Oswald, S.E., Kaestner, A., Abbaspour, K.C., Lehmann, E., 559
Schulin, R., 2007. Visualization of root growth in heterogeneously contaminated soil 560
using neutron radiography. Eur. J. Soil Sci. 58, 802–810. https://doi.org/10.1111/j.1365-561
2389.2006.00870.x 562
Metzner, R., Eggert, A., van Dusschoten, D., Pflugfelder, D., Gerth, S., Schurr, U., Uhlmann, 563
N., Jahnke, S., 2015. Direct comparison of MRI and X-ray CT technologies for 3D 564
imaging of root systems in soil: potential and challenges for root trait quantification. 565
Plant Methods. https://doi.org/10.1186/s13007-015-0060-z 566
Mooney, S.J., Morris, C., Berry, P.M., 2006. Visualization and quantification of the effects of 567
cereal root lodging on three-dimensional soil macrostructure using x-ray computed 568
tomography. Soil Sci. 171, 706–718. 569
https://doi.org/10.1097/01.ss.0000228041.03142.d3 570
Mooney, S.J., Pridmore, T.P., Helliwell, J., Bennett, M.J., 2012. Developing X-ray computed 571
tomography to non-invasively image 3-D root systems architecture in soil. Plant Soil 572
352, 1–22. https://doi.org/10.1007/s11104-011-1039-9 573
Moradi, A.B., Carminati, A., Vetterlein, D., Vontobel, P., Lehmann, E., Weller, U., 574
Hopmans, J.W., Vogel, H.-J., Oswald, S.E., 2011. Three-dimensional visualization and 575
quantification of water content in the rhizosphere. New Phytol. 192, 653–663. 576
https://doi.org/10.1111/j.1469-8137.2011.03826.x 577
Moradi, A.B., Conesa, H.M., Robinson, B., Lehmann, E., Kuehne, G., Kaestner, A., Oswald, 578
S., Schulin, R., 2009. Neutron radiography as a tool for revealing root development in 579
28
soil: Capabilities and limitations. Plant Soil 318, 243–255. 580
https://doi.org/10.1007/s11104-008-9834-7 581
Nakanishi, T.M., Matsumoto, S., Kobayashi, H., 1992. Morphological Change of Plant Root 582
Revealed Radiography by Neutron of Tokyo 641, 638–641. 583
Nakanishi, T.M., Okuni, Y., Hayashi, Y., Nishiyama, H., 2005. Water gradient profiles at 584
bean plant roots determined by neutron beam analysis. J. Radioanal. Nucl. Chem. 264, 585
313–317. https://doi.org/10.1007/s10967-005-0713-x 586
Niu, Y., Jin, G., Li, X., Tang, C., Zhang, Y., Liang, Y., Yu, J., 2015. Phosphorus and 587
magnesium interactively modulate the elongation and directional growth of primary 588
roots in Arabidopsis thaliana ( L .) Heynh 66, 3841–3854. 589
https://doi.org/10.1093/jxb/erv181 590
Octopus, 2019. Octopus reconstrsuction [WWW Document]. URL 591
https://octopusimaging.eu/octopus/octopus-reconstruction (accessed 3.1.19). 592
Oswald, S.E., Menon, M., Carminati, A., Vontobel, P., Lehmann, E., Schulin, R., 2008. 593
Quantitative Imaging of Infiltration, Root Growth, and Root Water Uptake via Neutron 594
Radiography. Vadose Zo. J. 7, 1035. https://doi.org/10.2136/vzj2007.0156 595
Passioura, J.B., Stirzaker, R.J., 1993. Feedforward Responses of Plants to Physically 596
Inhospitable Soil. Int. Crop Sci. I 715–719. 597
https://doi.org/10.2135/1993.internationalcropscience.c114 598
Pflugfelder, D., Metzner, R., Dusschoten, D. Van, Reichel, R., Jahnke, S., Koller, R., 2017. 599
Non-invasive imaging of plant roots in different soils using magnetic resonance imaging 600
( MRI ). Plant Methods 1–9. https://doi.org/10.1186/s13007-017-0252-9 601
Pierret, A., Moran, C.J., Doussan, C., 2005. Conventional detection methodology is limiting 602
29
our ability to understand the roles and functions of fine roots. New Phytol. 166, 967– 603
980. https://doi.org/10.1111/j.1469-8137.2005.01389.x 604
Rich, S.M., Watt, M., 2013. Soil conditions and cereal root system architecture: Review and 605
considerations for linking Darwin and Weaver. J. Exp. Bot. 64, 1193–1208. 606
https://doi.org/10.1093/jxb/ert043 607
Robinson, B.H., Moradi, A., Lehmann, E., 2008. Neutron Radiography for the Analysis of 608
Plant – Soil Interactions. Encycl. Anal. Chem. Appl. Theory Instrum. 1–8. 609
Rudolph-Mohr, N., Vontobel, P., Oswald, S.E., 2014. A multi-imaging approach to study the 610
root-soil interface. Ann. Bot. 114, 1779–1787. https://doi.org/10.1093/aob/mcu200 611
Sato, E.M., Hijazi, H., Bennett, M.J., Vissenberg, K., Swarup, R., 2015. New insights into 612
root gravitropic signalling. J. Exp. Bot. 66, 2155–2165. 613
https://doi.org/10.1093/jxb/eru515 614
Senapati, N., Semenov, M.A., 2019. Assessing yield gap in high productive countries by 615
designing wheat ideotypes. Sci. Rep. 9, 5516. https://doi.org/10.1038/s41598-019-616
40981-0 617
Southon, T.E., Mattsson, A., Jones, R.A., 1992. NMR imaging of roots: effects after root 618
freezing of containerised conifer seedlings. Physiol. Plant. 329–334. 619
Stingaciu, L., Schulz, H., Pohlmeier, A., Behnke, S., Zilken, H., Javaux, M., Vereecken, H., 620
2013. In Situ Root System Architecture Extraction from Magnetic Resonance Imaging 621
for Water Uptake Modeling. Vadose Zo. J. 0, 0. https://doi.org/10.2136/vzj2012.0019 622
Tötzke, C., Kardjilov, N., Manke, I., Oswald, S.E., 2017. Capturing 3D Water Flow in 623
Rooted Soil by Ultra-fast Neutron Tomography. Sci. Rep. 7, 6192. 624
https://doi.org/10.1038/s41598-017-06046-w 625
30
Tracy, S.R., Black, C.R., Roberts, J.A., Dodd, I.C., Mooney, S.J., 2015. Using X-ray 626
Computed Tomography to explore the role of abscisic acid in moderating the impact of 627
soil compaction on root system architecture. Environ. Exp. Bot. 110, 11–18. 628
https://doi.org/10.1016/j.envexpbot.2014.09.003 629
Tracy, S.R., Black, C.R., Roberts, J.A., McNeill, A., Davidson, R., Tester, M., Samec, M., 630
Korošak, D., Sturrock, C., Mooney, S.J., 2012. Quantifying the effect of soil compaction
631
on three varieties of wheat (Triticum aestivum L.) using X-ray Micro Computed 632
Tomography (CT). Plant Soil 353, 195–208. https://doi.org/10.1007/s11104-011-1022-5 633
Tracy, S.R., Black, C.R., Roberts, J.A., Mooney, S.J., 2013. Exploring the interacting effect 634
of soil texture and bulk density on root system development in tomato (Solanum 635
lycopersicum L.). Environ. Exp. Bot. 91, 38–47. 636
https://doi.org/10.1016/j.envexpbot.2013.03.003 637
Tumlinson, L.G., Liu, H., Silk, W.K., Hopmans, J.W., 2008. Thermal Neutron Computed 638
Tomography of Soil Water and Plant Roots. Soil Sci. Soc. Am. J. 72, 1234. 639
https://doi.org/10.2136/sssaj2007.0302 640
van Noordwijk, M., Floris, J., 1979. Loss of dry weight during washing and storage of root 641
samples. Plant Soil 53, 239–240. 642
Vlassenbroeck, J., Masschaele, B., Cnudde, V., Dierick, M., Pieters, K., Van Hoorebeke, L., 643
Jacobs, P., 2006. Octopus 8: A High Performance Tomographic Reconstruction Package 644
for X-ray Tube and Synchrotron micro-CT, in: Advances in X-Ray Tomography for 645
Geomaterials. ISTE, London, UK, pp. 167–173. 646
https://doi.org/10.1002/9780470612187.ch13 647
Waines, J.G., Ehdaie, B., 2007. Domestication and crop physiology: roots of green-revolution 648
wheat. Ann. Bot. 100, 991–8. https://doi.org/10.1093/aob/mcm180 649
31
Wang, M. Ben, Zhang, Q., 2009. Issues in using the WinRHIZO system to determine 650
physical characteristics of plant fine roots. Shengtai Xuebao/ Acta Ecol. Sin. 29, 136– 651
138. https://doi.org/10.1016/j.chnaes.2009.05.007 652
Warren, J.M., Bilheux, H., Kang, M., Voisin, S., Cheng, C.L., Horita, J., Perfect, E., 2013. 653
Neutron imaging reveals internal plant water dynamics. Plant Soil 366, 683–693. 654
https://doi.org/10.1007/s11104-012-1579-7 655
Willatt, S.T., Struss, R.G., 1979. Germination and Early Growth of Plants using neutron 656
radiography 415–422. 657
Willatt, S.T., Struss, R.G., Taylor, H.M., 1978. In situ Root Studies Using Neutron 658
Radiography 1–6. 659
Zarebanadkouki, M., Carminati, A., Kaestner, A., Mannes, D., Morgano, M., Peetermans, S., 660
Lehmann, E., Trtik, P., 2015. On-the-fly Neutron Tomography of Water Transport into 661
Lupine Roots, in: Physics Procedia. https://doi.org/10.1016/j.phpro.2015.07.041 662
Zarebanadkouki, M., Kim, Y.X., Carminati, A., 2013. Where do roots take up water? Neutron 663
radiography of water flow into the roots of transpiring plants growing in soil. New 664
Phytol. 199, 1034–1044. https://doi.org/10.1111/nph.12330 665
Zarebanadkouki, M., Kim, Y.X., Moradi, A.B., Vogel, H.-J., Kaestner, A., Carminati, A., 666
2012. Quantification and Modeling of Local Root Water Uptake Using Neutron 667
Radiography and Deuterated Water. Vadose Zo. J. 11. 668
https://doi.org/10.2136/vzj2011.0196 669