IEEE
Proof
Photon-Counting OTDR for Local Birefringence and
Fault Analysis in the Metro Environment
M. Wegmuller, F. Scholder, and N. Gisin
Abstract—Optical time domain reflectometery (OTDR) is one of the most used measurement techniques in the characterization of optical fiber links. In this paper, we present a thorough inves-tigation of an OTDR using a Peltier cooled photon-counting de-tector at 1.55 um. Due to its superior spatial resolution and the absence of classical dead-zones, it is well suited for detailed, high resolution analysis of problem zones. We give a detailed analysis of its performance, and also demonstrate that a polarization-sensitive photon-counting OTDR can be used to extract local birefringences too large to be measured with standard P-OTDR’s.
Index Terms—Birefringence, distributed detection, metrology, optical time-domain reflectometry, photon counting, polarization-sensitive backscattering technique.
I. INTRODUCTION
S
INCE its first demonstration in 1976 [1], optical time do-main reflectometry (OTDR) has seen a tremendous success and is today the technique of choice for nondestructive, spatially resolved optical fiber or system characterization. After the ini-tial achievements of monitoring strong reflective events (con-nectors, fiber cuts, etc.) along the fiber, people became soon in-terested in getting information on the whole fiber. This neces-sitates the detection of the weak Rayleigh backscattered signal (typically to dB/m), requiring to optimize the detec-tion scheme for higher sensitivity. An obvious soludetec-tion is to em-ploy a photon-counting detector capable of detecting single light quanta. Only 5 years after the first demonstration of an OTDR, such a photon-counting OTDR ( -OTDR), based on a liquid nitrogen cooled Ge avalanche photodiode, has been presented [2]. Its sensitivity was about dBm (at a wavelength of 1.32 m), which allowed to measure the Rayleigh backscattered signal along a 37 km long single-mode fiber (dynamic range of 20 dB) with a spatial resolution of 100 m. Comparison of the performance between the best standard and -OTDR detectors for near-IR wavelengths predicted a dB advantage for the -OTDR dynamic range [3], however at the cost of a liquid-ni-trogen cooling. As we recently demonstrated [4], technological progress in the InGaAs/InP avalanche photodiode detectors al-lows to conserve this advantage of a -OTDR now operated at C, a temperature that can be achieved from Peltier ele-ments yielding much more practicality.Manuscript received May 16, 2003; revised September 22, 2003. This work was supported by the Swiss Commission for Technology and Innovation CTI, and from EXFO Electro-Optical Engineering.
The authors are with the Group of Applied Physics, University of Geneva, Geneva 4 CH-1211, Switzerland (e-mail: mark.wegmuller@physics.unige.ch).
Digital Object Identifier 10.1109/JLT.2004.824355
The main advantage of a -OTDR with respect to its clas-sical counterpart is however not its larger dynamic range, but the better spatial resolution and dead-zone avoidance.
The 2-point spatial resolution in standard, analog detection OTDR’s is limited to m due to pulse duration and detector re-sponse time. A better resolution would require a faster detector response, i.e., larger detector bandwidth. Unfortunately, the de-tector noise is proportional to the square-root of its bandwidth (bw), so that the OTDR sensitivity becomes worse [3]
(1) is the noise-equivalent power of the receiver (in [W/ Hz]), and N the number of independent measurements. Although this tradeoff between spatial resolution and dynamic range (i.e., measurement distance) can in principle be eased by using more powerful lasers, there are tight practical limits to this remedy (safety regulations, reliability and cost of such lasers, nonlinearities, etc.). Moreover, especially after strong reflective events leading to detector saturation, avalanche photodetectors require a certain amount of time to recover to full sensitivity again, leading to the well-known dead-zones.
In a -OTDR, due to the signal sampling form the gated op-eration of the detector, there is no classical dead time. How-ever, as is shown in Section III, a similar effect, proper to photon counting, can occur. The detector noise, given by the dark count rate (number of spuriously triggered avalanches), does not de-pend on the gate duration determining the spatial resolution of the -OTDR. One is therefore tempted to believe that the desired spatial resolution can be chosen without affecting the dynamic range. Unfortunately, this is not true as the involved statistics of the counting process lead to the same relationship [4], [3] be-tween -OTDR sensitivity and spatial resolution as for the stan-dard OTDR (1)
(2) Here, is given by where is the dark count rate, h the photon energy, the quantum efficiency of the de-tector, the gate duration, and N the number of measurements. From the dB advantage in sensitivity for a 1.55 um -OTDR [4] over its classical counterpart, one can expect a spatial resolution that is better by a factor of 100 than its clas-sical counter-part (1 cm instead of 1 m). Among the very few reports on -OTDR’s operating at telecom wavelengths (1.3, 1.55 um), the best spatial resolution was 5 cm, obtained with a liquid-nitrogen cooled Ge detector [5]. The dynamic range was poor, allowing only to measure m of multimode fiber. The only demonstration of a practical -OTDR (i.e., without
IEEE
Proof
2 JOURNAL OF LIGHTWAVE TECHNOLOGY, VOL. 22, NO. 2, FEBRUARY 2004
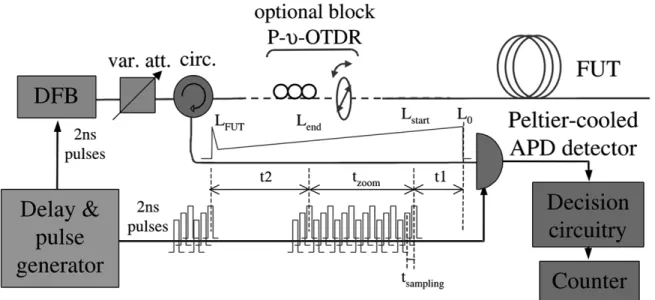
Fig. 1. Schematic setup of the-OTDR. DFB: distributed feedback laser, var. att.: variable optical attenuator, circ.: optical circulator, FUT: fiber under test. Shown is also the optional block for use as a P--OTDR (polarization controller and adjustable linear polarizer), and the use of gate trains (comb of detection gates to gather information on several locations for each laser pulse).
liquid-nitrogen detector cooling) at 1.55 um was reported in [6]. A respectable dynamic range of 25 dB (sensitivity of dBm) was obtained, however at the cost of a poor spatial resolution of just 100 m.
The lack of a practical -OTDR, operating at 1.55 um with sufficient spatial resolution and dynamic range for fault local-ization in the metro environment, is addressed in this paper. It is organized as follows. In Section II, we describe the set-up of our -OTDR, and motivate the choice of operating parame-ters with the targeted specs. We then report in Section III on the sources of signal deterioration important for the quality of fault characterization. Special emphasize is put on problems specific to near IR photon-counters in gated-mode operation, namely on the so-far largely neglected effect of charge subsistence. In Sec-tion IV, measurement examples illustrate fault localizaSec-tion for reflective and loss events. Further, using a P- -OTDR for the first time, we demonstrate the capacity to extract local birefrin-gence too large to be measured with standard P-OTDR’s. Sec-tion V finally summarizes our results.
II. -OTDR SETUP ANDOPERATINGPARAMETERS
Before describing the set-up of our -OTDR, let us briefly mention the targeted performance that should allow for a pos-sible application in metro systems. The goal is to be able to de-tect faults (reflective events, losses) with high spatial 2-point resolution ( cm) and no dead-zones, within the typical dis-tances of a metro ring network ( km). In order to reduce the measurement time, the system should allow to specify a mea-surement interval (zoom window) anywhere along the fiber.
We found that these requirements can be best met by a -OTDR in gated-mode operation [7], where the detector is only active during a short gate period. The corresponding set-up of our -OTDR is shown in Fig. 1. In what follows, the basic principle of operation of a -OTDR (see also [8]) is summarized for people not familiar with this technique
-specialists may directly want to jump to the next paragraph where the specificities of our set-up are given.
The key difference with respect to the well-known OTDR technique is—as the name implies—the use of the photon counting detector (in our case an InGaAs avalanche photodiode (APD)). It is used in the so-called gated Geiger mode, which means that the detector is only active (biased above breakdown) during a short time slot (“gate”). During this period, a single photon falling onto the detector can trigger an avalanche, which is then detected by discriminator electronics. Contrary to operation of the APD in the linear regime, this avalanche is no longer proportional to the optical input signal power, but largely independent of it. The detection is therefore a binary one: either there is an avalanche or not. In order to predict the optical power (or mean photon number) incident on the detector during its activation, the detection process (i.e., gate opening) has to be repeated many times in order to determine the detection probability with a sufficiently good precision. This probability is proportional to the incident signal power provided that it is smaller than about 40% (i.e., no detector saturation, [7]) and larger than the thermal detector noise (dark counts). In our set-up, this condition is obtained by properly adjusting the variable attenuator (see Fig. 1). From the detection probability for a certain gate position, set by the delay gener-ator, the reflectivity at the corresponding location in the fiber is readily obtained with a spatial 2-point resolution determined by the gate duration (1). For information on different locations
along the fiber, the gate delay has to be set accordingly. In our -OTDR, as depicted in Fig. 1, the user can specify a zoom interval for which the reflectivity is then automatically measured with a step size (sampling resolution) of s. As explained below, the measurement can be sped up by the use of gate trains.
1This is true for a DFB pulse duration shorter or equal tot , large SNR,
and a large number of counts (negligible statistical noise). Situations where the latter two requirements are not fulfilled are of little practical importance.
IEEE
Proof
TABLE I
SUMMARY OFOPERATINGPARAMETERS OF THE-OTDR PROTOTYPE. (x) INDICATESUSERADJUSTABILITY
The choice and operating point of the photon-counting de-tector is obviously the key-point of any -OTDR. Quite large performance differences exist among different state-of-the-art detectors [9], and their operation point (bias voltage, temper-ature) depends on several trade-offs. For the bias, detector ef-ficiency has to be trade-off against the dark count rate, and for the operating temperature, a good dark count rate means larger after-pulse probability [9], [10]. Another important as-pect in an environment where large signal reflections can occur is the so-called charge subsistence effect (see Section III). It in-creases the noise for a considerable distance after a strong re-flector, thereby covering the low Rayleigh signal within a cer-tain ‘dead-zone’. The extent of this dead-zone depends on the detector model, and increases for lower operating temperatures. As this last effect is hard to correct for, we finally selected the InGaAs APD (Epitaxx) with the least charge subsistence (and little dark count rate), but with somewhat nonideal afterpulse rate. It is typically operated at a bias voltage of 51.8 V and a temperature of C. This gives a quantum efficiency of 10% and a dark count rate of 20–30 kHz.
A specificity of our setup is the possibility to use gatetrainsin order to reduce the overall measurement time. The user defines the interval he wants to measure (e.g., km,
m), the number of gate openings (e.g., ), the sampling resolution (e.g., cm), and the gate frequency f (e.g., 2 MHz). According to the width of the zoom window and the gate frequency, a number of gates
, where is the group refractive index of the fiber, is employed for each laser pulse sent into the fiber (see Fig. 1). Consequently, one simultaneously obtains infor-mation for Ng different locations, separated by (50 m for the above numbers), and the overall measurement time de-creases by a factor of Ng with respect to the situation where only one gate per laser pulse is employed. The gate frequency f is essentially limited by afterpulses (Section III). According to the above parameters, the overall measurement time for long distances, where it is no longer limited by electronics (data transfer etc., min) but by physics (traveling time of a pulse), is given by
(3)
Fig. 2. Backreflected signal power as a function of time, for a 20-cm-length interval of SMF located at 14 km (fluctuating trace, black) and a 20 cm length interval of SMF comprising a FC/PC connector located at 14.2 km (flat trace, grey). Also shown is the statistical noise (dotted lines).
For the above example and a total system length of
km, min. Clearly, one has to pay the price for a large number of measurement points and good signal averaging.
Besides the detection scheme, another important choice con-cerns the laser source. Typically, Fabry–Pérot lasers are used for their large output powers and relatively low coherence, reducing the Rayleigh fluctuations (coherent speckle). Here, we opted for a highly coherent DFB source (1551 nm, 6 mW peak power at -OTDR exit). This has the advantage that large amounts of GVD can be tolerated without affecting the spatial resolution. It also allows for local birefringence analysis after high PMD sec-tions where the corresponding depolarization of sources with broader spectra would inhibit a proper measurement.
For clarity, the different operating parameters of the -OTDR and their user adjustability are summarized in Table I.
III. SOURCES OFSIGNALDETERIORATION
We now discuss the different noise sources leading to fluctu-ations in our -OTDR signal. Special emphasize is put on the signal deteriorations proper to the gated mode photon counting.
1) Coherent Fading (Coherent Speckle): Due to the large coherence of the employed DFB source. The signal fluctua-tions from the varying relative phases between the scattering centers (macroscopic refractive index variations) are illustrated
IEEE
Proof
4 JOURNAL OF LIGHTWAVE TECHNOLOGY, VOL. 22, NO. 2, FEBRUARY 2004
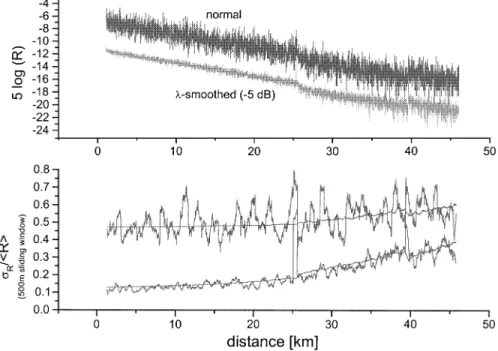
Fig. 3. Results for a link of 3 SMF. (a) reflected power as a function of distance with and without wavelength averaging (the-smoothed curve is shifted by 5 dB for clarity). (b) normalized standard deviation for a 500-m sliding window. The smooth curves give the values calculated from the measured mean values.
in Fig. 2. It shows the backscattered signal from a 20-cm in-terval of standard SMF fiber located at 14 and 14.2 km, re-spectively. A FC/PC connector, leading to a large reflection, was located at 14.2 km, and the source power had to be atten-uated accordingly (50 dB) to avoid detector saturation. Clearly, the Rayleigh backscattered signal is strongly fluctuating (up to 3 dB) during the measurement period of 30 min, whereas the light from the point reflection stays fairly constant. Coherent fading noise can be reduced by averaging independent mea-surement samples taken at different wavelengths [11]. This is readily achieved by controlling the temperature of our DFB laser with the on-chip Peltier element. Using a linear temper-ature sweep, we create a linear variation in wavelength over a nm interval for each measurement location. As Fig. 3 demonstrates, this is sufficient to reduce the relative Rayleigh fluctuations (std/mean) from 0.5 to 0.15. However, this works only on the Rayleigh noise, and little noise reduction is observed at longer distances ( km) where statistical noise becomes dominant.
2) Statistical Noise: Due to the quantum nature of light, and the binary photon-counting detection. The probability for a signal count per gate is Poisson distributed, and the one for a noise count follows a binomial statistics, which is however well approximated by a Poisson distribution. Consequently, the total number of counts p will fluctuate as . For the measurement example of the connector reflection of Fig. 2, %, leading to the error bars shown in the figure. For classical light sources, statistical noise can only be reduced by increasing the number of counts (either by reducing losses, boosting laser power, or by taking more measurements).
3) Polarization Noise: Both PDL in the internal -OTDR components (circulator, lead fibers) and the polarization depen-dent responsivity (PDR) of the photon-counter can lead to
arti-ficial, polarization dependent signal fluctuations. Consequently, care was taken in choosing low PDL components. Measure-ment of the Rayleigh backscattered light for different polariza-tion states equally distributed on the Poincare sphere showed a maximum variation of less than 0.6% (0.01 dB), demonstrating that polarization noise is negligible.
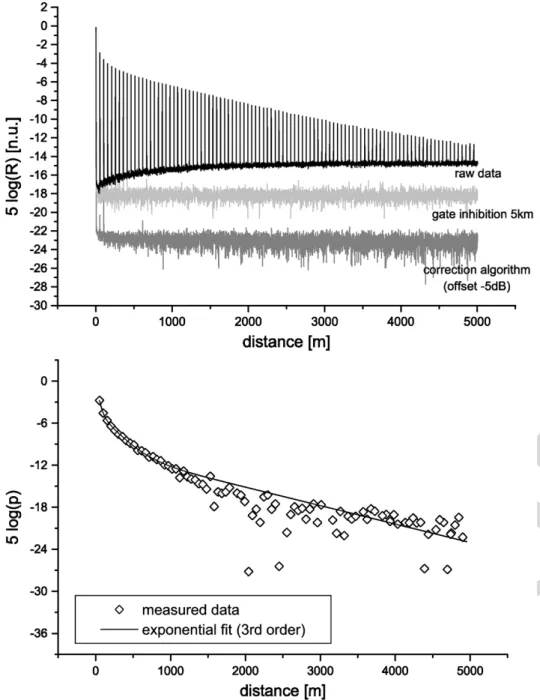
4) Afterpulses: Spurious counts from charges trapped during previous avalanches [10], [12], [9]. As is demonstrated in [9], the amount of the effect strongly varies for different state-of-the-art detectors, and persists longer in colder de-tectors. The effect for the detector in our -OTDR is shown in Fig. 4(a). A Fresnel reflection at 2.2 m, almost saturating the detector when using 50 dB internal attenuation, leads to a large afterpulse probability in the following gates of the train, separated by 50 m intervals. The figure shows that for such extreme cases, afterpulses can persist for km (decrease of 10 dB). From the reduction of the consecutive afterpulse peaks, the afterpulse probability can be extracted as a function of distance [see Fig. 4(b)].
The effect can be corrected for either by post-measurement signal correction algorithms, or by simply not activating a cer-tain number of gates after an avalanche. The effect of these two solutions is demonstrated in Fig. 4(a). Both methods work well, but some (low) spurious peaks persist. The correction al-gorithm is not perfectly working due to variations in the af-terpulse probability and a possible dependence on count prob-ability especially for strong saturation. The inhibition of gate openings on the other hand changes the temporal dynamics of the photon-counting detector which can lead to small variations in detector efficiency, and it also increases the statistical noise as less gates are opened (especially at locations corresponding to gates following a strong reflector). Moreover, for measure-ments covering the entire system length, it can be necessary to employ not the physical system length for Ltot, but to increase
IEEE
Proof
Fig. 4. Afterpulses after a Fresnel reflector for a distance of 50 m between adjacent gates in a train. (a) raw reflected power, reflected power for 5 km gate inhibition after an avalanche, and reflected power calculated from raw data using an afterpulse correction-algorithm (shifted by 5 dB for clarity). (b) noncumulated afterpulse probability. diamonds: as extracted from raw data, solid line: third-order exponential fit used for correction algorithm.
this parameter such that the time between two consecutive trains ( , see Fig. 1) is larger than about 50 ns (corresponding to 5 km round-trip). This assures that signal deteriorations from afterpulses from the previous train of gates are avoided.
5) Charge Subsistence: Spurious counts due to light falling on the detector before its activation. This signal deterioration, proper to gated mode photon-counting, is largely neglected, and no reports are found in the -OTDR literature. Although its origin is not exactly understood at this time, the most plausible explanation is that light falling on the detector before its acti-vation can create electron-hole pairs that are not rapidly dis-persed, but—similar to the afterpulse effect- are trapped and can consequently release a spurious avalanche during the fol-lowing detector activation. Its amount depends on the level of
light falling on the (inactivated) detector, on the time period to its activation, and on the detector temperature (the life-time of the trapped charges is longer for cooler detectors). The effect for our -OTDR is demonstrated in Fig. 5, showing the signal drop after the physical end of a test fiber for different end reflectivi-ties. For the worst case of a Fresnel reflection ( dB), it takes km for the charge subsistence inferred signal to drop into the detector noise floor (decrease of 3.8 dB/km). After a strong reflection, the Rayleigh light is therefore not accessible for some distance, similar to the dead-zone in a classical OTDR. The effect however decreases for the smaller reflectivities that are typically encountered in test systems, and for nonsaturating peaks, charge subsistence is completely absent. From a linear fit of the charge subsistence level at 3 m (i.e., one dB peak
IEEE
Proof
6 JOURNAL OF LIGHTWAVE TECHNOLOGY, VOL. 22, NO. 2, FEBRUARY 2004
Fig. 5. Charge subsistence after a point reflector located at a short distance of 2.2 m. Numbers give the reflectivity. After a sharp initial signal drop, charge subsistence drops with 3.8 dB/km (dashed lines). inset: blow-up of the region following the reflector.
Fig. 6. Results for a link of 3 SMF, measured with a standard OTDR and our-OTDR (standard OTDR curve is shifted vertically to account for the higher Rayleigh backscattering level due to its worse spatial resolution). Inset: difference of the two traces.
width away from the reflector, dotted vertical line in the inset of Fig. 5), one obtains a charge subsistence of about 0.39 R.
Unfortunately, if it is present, charge subsistence is hard to correct for. Postmeasurement signal correction does not work, as the number of photons hitting the detector before activation is not known outside the zoom-window and for saturating reflec-tion peaks (which are the ones critical for charge subsistence). The only solution is therefore to optically block the detector with a fast shutter. As we demonstrated in [4], using an ampli-tude modulator works fairly well. Although this costly and tech-nically challenging solution has not been realized in our actual -OTDR, it needs to be implemented if the primary application is to precisely localize losses or fiber breaks in close vicinity of strong reflections (as is, e.g., the case if a fiber break in a remote node of a metro ring-network has to be detected).
IV. FAULTLOCALIZATION
A. Reflection and Loss
A typical figure of merit for classical OTDRs is the dynamic range [8], as it essentially determines the maximum measure-ment distance. We consequently measure a series of 3 SMF fibers, connected by FC/PC connectors, of a total length of km. Both the length and the overall loss correspond to values that can be expected in metro links. The classical OTDR mea-surement of the system, using a spatial resolution of 100 m (1 pulses) is given in Fig. 6. The same system is then measured with our -OTDR (using afterpulse and dark count correction [4]). In order to decrease the statistical noise, a large number of 10 gate openings is employed. Due to the low sampling reso-lution of 5 m, the reflective peak heights are not correctly
re-IEEE
Proof
produced as they do not necessarily fall within the 20 cm gate windows. In fact, analysis with a smaller step size showed that the two reflections from the in-line FC/PC connectors (at 16 and 42 km, respectively) saturate the photon-counting detector ( dB). Consequently, charge subsistence is to be expected. Indeed, it clearly shows up for the peak at 40 km (see also inset of Fig. 6 showing the difference between classical and -OTDR signals). Otherwise, the classical and -OTDR traces agree to within 0.1 dB. As the figure demonstrates, the useful measurement distance for the presented example roughly co-incides with the system length (67 km), as afterwards signal and noise start to overlap. The corresponding dynamic range amounts to 20 dB.
As previously mentioned, the main interest (i.e., main advan-tage) of a -OTDR is its superior spatial resolution. This is ana-lyzed by measuring jumpers of varying length. As demonstrated by Fig. 7(a), applying the usual criterion of a 3 dB dip between peaks (on a scale), one obtains a 2-point resolution of 15 cm. Note that a slightly better 2-point resolution of 10 cm is ob-tained when using shorter optical pulses [7]. The optical power of these pulses is however reduced, limiting the measurement distance to 10 km. Fig. 7(b) illustrates that the 2-point resolution does not depend on measurement distance. At short (3 m) and long (81 km) distance, the traces are perfectly overlapping (the SNR is obviously reduced at 81 km). Due to the narrow DFB spectrum (modulated linewidth of MHz), GVD does not decrease the spatial resolution - the width of a reflection peak is increased by less than 10% for astronomical GVD values of 25’000 ps/nm in the absence of -smoothing. When applying -smoothing ( nm) however, ps/nm, i.e., ps/(nm km) for a 60 km long system.
Another important parameter is the loss resolution, i.e., the precision with which a loss can be measured. A well characterized artifact, consisting of a dB coupler and output arms with different lengths (see Fig. 8), is used for this purpose. The insertion loss and coupling ratio of the artifact coupler are 0.15 dB and 47.5/52.5% (short/long arm), respectively. With the -OTDR, the artifact is measured at short (0 m) and long (41 km SMF) distance. The corresponding results are shown in Fig. 8. As can be seen, the loss for the first signal drop is quite similar, and amounts to dB. For the second signal drop, a value of 1.32 dB is found from the short distance measurement, wheres the long distance one gives 1.52 dB. This latter value is however less trustworthy, as the SNR of the Rayleigh light from the longer coupler fiber is close to 1. From the signal drops of 1.66 and 1.32 dB, respectively, an insertion loss of 0.16 dB is obtained, with a coupling ratio of 47.8/52.2% between the short and long coupling fiber. These values are very close to the ones given above. However, due to the large Rayleigh noise, the presented high-coherence -OTDR is not well adapted for precise ( dB) loss measurements. Use of a -OTDR for such measurements can nevertheless be beneficial in situations where a standard OTDR has too little spatial resolution to resolve the features to be measured. In such cases ( m), the loss precision is characterized by the number n of independent measurement points (500 or less, depending on the chosen sampling resolution) and the Rayleigh standard deviation . For the SMF shown in Fig. 3, we have seen that for
Fig. 7. Measurement of SMF jumpers. (a) Reflected signal power for jumpers of different lengths, located at 3.3 m (curves are shifted vertically for clarity). (b) Reflected signal power for the 15 cm jumper located at 3.3 m (black curve and axis) and 81.2 km (gray curve and axis). vertical axes are normalized for correct loss.
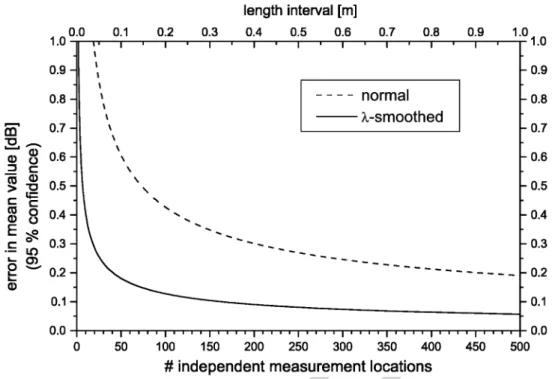
a Rayleigh dominated signal, (0.15 if -smoothed). Further, the error in determining the mean value of this signal (assuming a normal probability distribution) is (95% confidence). The corresponding results are shown in Fig. 9. Clearly, -smoothing is beneficial and permits to have e.g., a loss precision of 0.1 dB for 160 independent measurement points. As the spatial extent of coherent Rayleigh scatterers is of the order of [11], the corre-sponding minimum distance for samples to be independent can be estimated to 3 mm for our -smoothing with a wavelength variation over nm (per measurement location). Consequently, cm (see top axis of Fig. 9). For confirmation, a sliding window average of 160 points was performed on the -smoothed curve of Fig. 3. Deviations of less than dB from the linear fit of the curve (on a 10 km interval) were found, and the error for a corresponding loss measurement would consequently be smaller than 0.1 dB.
B. Birefringence
Implementation of a polarization sensitive detection for OTDR (P-OTDR) allows to extract the local birefringence of a fiber under test. A description of the method can be found, e.g., in [13], [14]. It is based on the fact that the measured signal power fluctuates with a spatial frequency characteristic for the
IEEE
Proof
8 JOURNAL OF LIGHTWAVE TECHNOLOGY, VOL. 22, NO. 2, FEBRUARY 2004
Fig. 8. Results for a measurement artefact. (a) Sketch of the artefact (all fibers are SMF). (b) Reflected signal power from artefact located at 0 m and 41 km, respectively.
amount of local birefringence at that location. The method is very fruitful as it allows to identify bad fibers in a link. One can also estimate [13], [15], [16] or even directly measure [17] the polarization coupling length, determining (in combination with the local birefringence) the PMD and its statistics.
A drawback of the standard P-OTDRs is that a spatial reso-lution of 1 m does not allow to detect large birefringence. For the case of large polarization mode coupling, beatlengths of less than 12 m can not be measured ([18], [14]), whereas this limit drops to 2 m in the absence of mode coupling ([18]). Conse-quently, standard P-OTDR’s are not ideal to identify PMD flaws in a fiber link, caused e.g., by too tight spooling of a fiber in a cabinet (e.g., m for a diameter of 5.3 cm), or by fibers subjected to pressure. Such high birefringence values can be readily measured using a P-OFDR [18], [19], whose measure-ment range is however limited to km.
Clearly, a P- -OTDR can fill this gap among the existing techniques. For our initial tries, we simply put a rotatable, linear polarizer at the -OTDR exit (see Fig. 1), along with an addi-tional polarization controller to keep the launch power maxi-mized. Fig. 10 shows the results obtained for a highly birefrin-gent elliptical core fiber with a beatlength of cm, which is about the maximum birefringence that can be measured with a spatial resolution of 15 cm. In Fig. 10(a), the reflected in-tensity is given as a function of length. Clearly, the expected periodic beating of the intensity can be discerned. The corre-sponding power spectral density (psd) of a 50 m measurement
interval is shown in Fig. 10(b). From the Gaussian fit of the psd peak, a beatlength of cm is obtained. When -smoothing is applied, the spurious peaks in the psd become smaller due to the reduced amplitude of the Rayleigh fluctua-tions. Fig. 10(c) gives a corresponding result for a measurement interval of 20 m. Interestingly, not only the characteristic bire-fringence peak shows up, but also a peak corresponding to the frequency of the wavelength variation (peak at 0.5 m ). Con-sequently, if using -smoothing for noise reduction, one has to be careful that the measurement speed and frequency of wave-length variation is chosen in such a way that the ‘smoothing peak’ does not interfere with the beatlength peak(s) of interest.
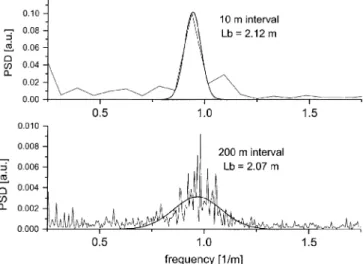
Results for an inner Ribbon fiber ( m, [16]), mea-sured after SMF lead fibers of 1, 26, and 41 km length, respec-tively, are shown in Fig. 11. For each of the three distances and the same measurement interval of 200 m, we performed three measurements using a different adjustment of the polarizer (0, 45, and 90 ). The corresponding, superposed psd are shown on the left side of Fig. 11, whereas the graphs on the right show their average. Note that -smoothing was employed only for the shortest distance measurement (inset), as it is of little help for the longer distances (see Section II). The psd peak visibility de-creases only little with distance, and the extracted beatlengths agree to within 6%.
To determine the maximum range for birefringence extrac-tion, one needs to look at the different effects that lead to a de-creased psd peak visibility. Decoherence from PMD is not an
IEEE
Proof
Fig. 9. Calculated error in estimating the mean value of the link shown in Fig. 3, from a limited number of (independent) measurements. top scale gives the length interval for the employed-smoothing.
Fig. 10. P--OTDR measurements of a high-birefringence elliptical core fiber. (a) Reflected signal power as a function of distance. inset: blow-up showing the polarization beats. (b) Corresponding power spectral density. From the Gaussian fit of the psd peak, a beatlength of 58 cm is obtained. (c) psd for a measurement of a smaller length interval of the same fiber with activated-smoothing.
issue for typical situations due to the narrow source spectrum. After a birefringent fiber (without polarization coupling), the mean angular difference (Poincare Sphere) between 2 initially parallel polarization states of different wavelength is given by
(4)
where the factor of comes from the averaging over all pos-sible input states. For (Sphere), one can conse-quently tolerate a huge DGD of ps. However, one needs to be careful when applying -smoothing: for nm and the same criterion as above, ps. Another perturbing effect for measurements after long distances are temporal fluc-tuations in the state of polarization during the acquisition time. It will reduce the visibility of the polarization beats if the polar-ization drifts considerably during the time required to measure an interval of say . For the above example of m (Fig. 11), the time to measure a 20-m interval at 50 km with a step of 0.2 m is 8 min. From polarimetric measurements of the output polarization state after a 50-km-long system (3 spooled SMF fibers in a lab without any temperature stabilization), we found an average drift of /min. These measurements of 30 min duration were performed for several different input polar-ization states and at different times of the day. We can there-fore expect a polarization drift of about 24 deg for the above example, explaining that we had abut the same psd peak visi-bility at short and long measurement distances.
The real limiting factor for the maximum range at which the local birefringence can still be extracted is therefore typically given by the required minimum SNR. If there are too few counts, the sampling of the characteristic beat signal becomes insuffi-cient, and it vanishes in the large statistical noise . With its present sensitivity, the P- -OTDR should allow for correct beatlength extraction up to km.
Similar to the loss determination over short measurement in-tervals described in Section IV.a, it can also be beneficial to measure the birefringence of such short stretches of fiber. In the metro environment, it can, e.g., happen that short lengths of fiber possess large birefringences from tight spooling in a cabinet. It
IEEE
Proof
10 JOURNAL OF LIGHTWAVE TECHNOLOGY, VOL. 22, NO. 2, FEBRUARY 2004
Fig. 11. P--OTDR results for a 200 m long inner Ribbon fiber with a beatlength of2m. Fiber was placed after (a) 1 km, (b) 26 km, (c) and 40.6 km of SMF. Left: superposed psd obtained for 3 different polarizer settings. Right: mean psd, numbers give the extracted beatlength. Inset: superposed spectra (grey) and mean psd (black) for activated-smoothing.
also allows to localize variations in the local birefringence with better spatial resolution.
To investigate this point, we analyzed the psd for decreasing interval lengths. Fig. 12 demonstrates that for an interval of only 10 m, the extracted beatlength ( m) is still very close to the one that was obtained from a 200-m-long interval located at the same position. The minimum interval length that can be used depends on the beatlength and on the desired precision for its extraction (the psd sampling resolution is .
V. CONCLUSION
We presented a practical photon-counting OTDR operating at 1.55 . It is based on a Peltier cooled InGaAs–InP avalanche detector operated in gated Geiger mode. Trains of gates are used to reduce the measurement time. With a dynamic range of 20 dB, a spatial 2-point resolution of 15 cm (10 cm up to 10 km), and its user-adjustable zoom-window, it is well suited for high resolution measurements in a metro environment.
Use of a DFB source leads to relatively large coherence noise, but allows for large values of GVD and PMD to be present in the system under test without affecting 2-point resolution. We illus-trated the performance for fault localization using different arte-facts. Closely spaced reflective events can be readily resolved, and a 50 cm length interval before and after a loss event was found sufficient for better than 0.1 dB loss determination. After a strong reflection leading to detector saturation, the Rayleigh backscattered light can however be covered by long tails caused by charge subsistence, leading to a dead-zone like behavior. This can only be corrected for by implementing a fast optical shutter. The good spatial resolution is also advantageous for local birefringence extraction—a P- -OTDR is capable of measuring much larger birefringences than a standard P-OTDR. This was illustrated with a fiber having a beatlength of just 60 cm, and we also successfully measured a Ribbon fiber ( ) after a distance of 40 km. We further showed that large birefringence
Fig. 12. P--OTDR results for inner Ribbon fiber located at 1.1 km. (a) psd for a 10 m long measurement interval. (b) psd for a 200 m long interval.
can be correctly determined from short measurement intervals m of the above Ribbon fiber, e.g., was sufficient to quantify its birefringence. This allows to identify metro problem zones like tightly spooled fibers of a cabinet or regions where the fiber is subjected to strong pressure.
ACKNOWLEDGMENT
The authors would like to warmly thank the team that con-tributed to the -OTDR prototype development: C. Barreiro, A. Haldimann, A. Fougères, and J.-D. Gautier.
REFERENCES
[1] M. K. Barnoski and S. M. Jensen, “Fiber waveguides: A novel technique for investigation attenuation characteristics,”Appl. Opt., vol. 15, no. 9, pp. 2112–2115, 1976.
[2] P. Healey, “Multichannel photon-counting backscatter measurements on monomode fiber,”Electron. Lett., vol. 17, no. 20, pp. 751–752, 1981.
IEEE
Proof
[3] P. Healey, “Optical time domain reflectometery—A performance com-parison of the analogue and photon counting techniques,”Opt. Quant. Electron., vol. 16, pp. 267–276, 1984.
[4] F. Scholder, J.-D. Gautier, M. Wegmuller, and N. Gisin, “Long-distance OTDR using photon counting and large detection gates at telecom wave-length,”Opt. Comm., vol. 213, pp. 57–61, 2002.
[5] A. Lacaita, P. A. Francese, and S. D. Cova, “Single-photon optical-time-domain reflectometer at 1.3 um with 5-cm resolution and high sensi-tivity,”Opt. Lett., vol. 18, no. 13, pp. 1110–1112, 1993.
[6] B. F. Levine, C. G. Bethea, and J. C. Campbell, “1.52 um room-tem-perature photon-counting optical time domain reflectometer,”Electron. Lett., vol. 21, no. 5, pp. 194–196, 1985.
[7] F. Scholder, A. Fougères, J.-D. Gautier, C. Barreiro, A. Haldimann, H. de Riedmatten, M. Wegmuller, and N. Gisin, “Photon-counting OTDR at telecom wavelength: High-resolution and long-distance measurements,” inProc. Symposium on Optical Fiber Measurements 2002, NIST Spec. Publ. 988, 2002, pp. 157–160.
[8] D. Derickson,Fiber Optic Test and Measurement. Upper Saddle River, NJ: HP Professionals Books, Prentice-Hall, 1998.
[9] D. Stucki, G. Ribordy, A. Stefanov, H. Zbinden, J. G. Rarity, and T. Wall, “Photon counting for quantum key distribution with Peltier cooled InGaAs/InP APDs,”J. Mod. Opt., vol. 48, no. 13, pp. 1967–1981, 2001. [10] A. Whilshire, “Digital time domain fault analysis techniques,” inProc. Int. Conf. on Measurements for Telecommunication Transmission Sys-tems, 1985, pp. 70–73.
[11] K. Shimizu, T. Horiguchi, and Y. Koyamada, “Characteristics and reduc-tion of coherent fading noise in Rayleigh backscattering measurement for optical fibers and components,”J. Lightwave Technol., vol. 10, pp. 982–987, July 1992.
[12] G. Ripamonti, F. Zappa, and S. D. Cova, “Effects of trap levels in single-photon optical time-domain reflectometry: Evaluation and correction,”
J. Lightwave Technol., vol. 10, pp. 1398–1402, Oct. 1992.
[13] F. Corsi, A. Galtarossa, and L. Palmieri, “Polarization mode dispersion characterization of single-mode optical fiber using backscattering tech-nique,”J. Lightwave Technol., vol. 16, pp. 1832–1843, Oct. 1998. [14] , “Beat length characterization based on backscattering analysis in
randomly perturbed single-mode fibers,”J. Lightwave Technol., vol. 17, pp. 1172–1178, July 1999.
[15] B. Huttner, B. Gisin, and N. Gisin, “Distributed PMD measurement with a polarization OTDR in optical fibers,”J. Lightwave Technol., vol. 17, pp. 1843–1848, 1999.
[16] M. Wegmuller, M. Legré, P. Oberson, O. Guinnard, L. Guinnard, C. Vinegoni, and N. Gisin, “Analysis of the polarization evolution in a ribbon cable using high resolution coherent OFDR,”IEEE Photon. Tech. Lett., vol. 13, pp. 145–147, Feb. 2001.
[17] A. Galtarossa, L. Palmieri, M. Schiano, and T. Tambosso, “Measurement of birefringence correlation length in long, single-mode fibers,”Opt. Lett., vol. 26, no. 13, pp. 962–964, 2001.
[18] M. Wegmuller, M. Legré, and N. Gisin, “Distributed beatlength mea-surements in single-mode optical fibers with optical frequency domain reflectometry,”J. Lightwave Technol., vol. 20, pp. 828–835, May 2002. [19] B. Huttner, J. Reecht, N. Gisin, R. Passy, and J. P. von der Weid, “Local birefringence measurements in single-mode fibers with coherent optical frequency-domain reflectometry,”IEEE Photon. Technol. Lett., vol. 10, Oct. 1998.
M. Wegmuller, Please provide plain text biography and photograph in tiff, eps, or ps format with at least 220 dpi resolution—ED.
F. Scholder, Please provide plain text biography and photograph in tiff, eps, or ps format with at least 220 dpi resolution—ED.
N. Gisin, Please provide plain text biography and photograph in tiff, eps, or ps format with at least 220 dpi resolution—ED.