UCRL-CONF-227293
Comprehending Software
Architecture using a Single-View
Visualization
T. Panas, T. G. W. Epperly, D. J. Quinlan, A.
Saebjoernsen, R. W. Vuduc
January 17, 2007
12th IEEE Int. Conference on Engineering of Complex
Computer Systems
Auckland, New Zealand
Disclaimer
This document was prepared as an account of work sponsored by an agency of the United States
Government. Neither the United States Government nor the University of California nor any of their
employees, makes any warranty, express or implied, or assumes any legal liability or responsibility for
the accuracy, completeness, or usefulness of any information, apparatus, product, or process
disclosed, or represents that its use would not infringe privately owned rights. Reference herein to any
specific commercial product, process, or service by trade name, trademark, manufacturer, or otherwise,
does not necessarily constitute or imply its endorsement, recommendation, or favoring by the United
States Government or the University of California. The views and opinions of authors expressed herein
do not necessarily state or reflect those of the United States Government or the University of California,
and shall not be used for advertising or product endorsement purposes.
Communicating Software Architecture using a Unified Single-View Visualization
Thomas Panas
Thomas Epperly
Daniel Quinlan
Andreas Sæbjørnsen
Richard Vuduc
Center for Applied Scientific Computing,
Lawrence Livermore National Laboratory
{
panas
|
epperly2
|
dquinlan
|
saebjornsen1
|
richie
}
@llnl.gov
Abstract
Software is among the most complex human artifacts, and visualization is widely acknowledged as important to under-standing software. In this paper, we consider the problem of understanding a software system’s architecture through vi-sualization. Whereas traditional visualizations use multiple stakeholder-specific views to present different kinds of task-specific information, we propose an additional visualization technique that unifies the presentation of various kinds of architecture-level information, thereby allowing a variety of stakeholders to quickly see and communicate current devel-opment, quality, and costs of a software system. For future empirical evaluation of multi-aspect, single-view architec-tural visualizations, we have implemented our idea in an existing visualization tool, Vizz3D. Our implementation in-cludes techniques, such as the use of a city metaphor, that reduce visual complexity in order to support single-view vi-sualizations of large-scale programs.
1. Introduction
Visualization techniques are widely considered to be im-portant for understanding large-scale software systems [15]; yet knowing what to visualize and how to present infor-mation are themselves daunting issues. The challenges are many. First, there are several stakeholders in a software project—architects, developers, maintainers, managers— each asking different questions about the software. An-swering a diverse set of questions will involve different ab-straction levels, such as the architecture, the middle level structure [15], or the source code itself. Each question may require a distinct analysis; multiple analyses can gen-erate huge volumes of data, which may be difficult to store, to manipulate, and to present. Having to manage multiple analyses, possibly through multiple visualizations (views), places a significant cognitive burden on any
indi-vidual stakeholder. Multiple views also tend to make it dif-ficult for separate stakeholders to communicate on subtle is-sues about a software architecture. These challenges make it hard for multiple stakeholders to reach a common under-standing or consensus about the project.
Different stakeholders often interact around questions about the software system’s architecture. For example, developers and project managers need to know where to make improve-ments,e.g., “which components do we have to modify in or-der to improve the performance or security of our system?” Project managers need to know how to allocate team mem-bers to each part of the system and answer questions such as, “can we meet the next deadline?” Additionally, both managers and vendors are interested in development hot spots (frequently modified components), which may indi-cate areas of high system maintenance cost. Designers and maintainers are more interested in the overall structure of the system; this knowledge helps them to identify reusable components, for instance.
We are investigating a visualization technique designed to help all stakeholders collectively understand and better communicate the architecture of a large-scale software sys-tem. Our particular technique represents the structure of the system using a graph-based model, following common convention [15], and we augment this model with a num-ber of static and dynamic analyses. Our specific choices of model and analyses help stakeholders answer a wide range of questions about the overall design, quality, and costs in development and maintenance (Section 2).
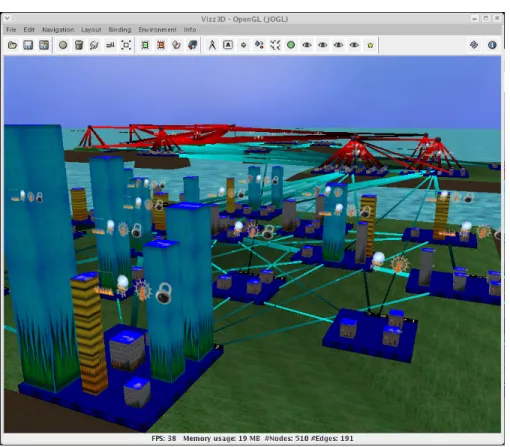
The central design goal of our approach is to visualize mul-tiple task- (or stakeholder-) specific aspects of a software ar-chitecture using just asingleview (Section 3),cf. Figure 1, to communicate problems, decisions and solutions between stakeholders. In contrast, existing approaches (Section 6) primarily rely on multiple views when visualizing multiple aspects of a system [1, 17, 30, 31]. Although multi-view approaches can be very effective, users may also have con-siderable difficulty managing and navigating through
dif-Figure 1. Architectural Program Visualization of a C++ Program.
ferent views [27, 28, 32]. In our current research, we are particularly interested in whether these difficulties can be overcome by judicious rendering within a single view. To help answer this question, we have implemented a single-view visualization tool (Section 4). We use a metaphor based on cities that provides users with an in-tuitive physical interpretation of the system. In addition, we use a layout algorithm that permits the system to be rendered consistently each time the visualization is per-formed. That is, the layout is designed to be insensitive to small structural changes, thereby helping users remember and navigate in the visualization. Our specific implemen-tation supports C and C++ programs, extending our earlier work for Java programs [20, 34].
Our overall approach allows multiple stakeholders to see and communicate about the same view, which facilitates the collective understanding and discussion of the system’s ar-chitecture (Section 5).
2. Visualizing Architectures
There are roughly three levels of program visualization, based on the level of abstraction [15, 26]:source code level,
middle level, andarchitecture level. This section explains
what we mean by architecture level, and describes our spe-cific model of the program and analyses in detail.
On the source code level, typical visualization tools clude program and aspect editors. Advanced tools may in-tegrate program editors with online debuggers and profilers. Source-level visualizations are very “low-level,” as they re-late directly to the underlying software artifact, and are pri-marily of interest to developers and maintainers.
On the middle level, visualizations are problem-specific. Developers and code maintainers have specific problems to solve, and they usually apply tailored algorithms and vi-sualizations to the program to better understand both the problem and the program. Typical middle level visualiza-tions include sequence diagrams, abstract syntax tree (AST) representations, dominance tree visualizations, concept lat-tices, control and data flow graphs.
The aim of architecture-level visualization is to rapidly summarize and communicate the architecture and design decisions of the overall software system. Architectural visu-alization is naturally more abstract than source- or middle-level visualizations, and therefore better suited to visualiza-tions in the large. Abstract visualizavisualiza-tions of software ar-chitectures combined with metrics can help different stake-holders to answer many questions about a software system.
For instance, project managers might use the visualizations to understand the aspects of a project that are most expen-sive, code designers can communicate current implementa-tion deviaimplementa-tions from original design plans, and code main-tainers may use the visualizations to better understand un-known software systems [7].
Common examples of architectural visualizations are func-tion call graphs, hierarchy graphs, and directory structures. There are many ways to present these graphs, such as UML diagrams, graph browsers, and component/connector graph drawings. Many tools support these visualizations [12, 26, 31]1. However, to the best of our knowledge, no tool exists that supports the visualization and communication of soft-ware architecture between different softsoft-ware development and maintenance stakeholders.
2.1. A graph-based program model
To support communication among various stakeholders through a single-view architecture visualization, a program model combining different aspects of a program (important to different stakeholders) is needed. We have merged sev-eral tools (Section 4) to retrieve the following architectural program models of C/C++ applications:
• AFunction Callgraph represents the call relationship between different (C/C++) functions.
• AClass Callgraph shows the interaction structure be-tween (C++) classes.
• A Class Contains graph holds information about classes and their functions.
• AClass Inheritance graph represents the inheritance structure of an (C++) application.
• A File Call graph shows the call structure between source files.
• AFile Contains graph shows functions in relation to their files. In C/C++, related functions may be imple-mented in (multiple) source as well as header files. The C++ specification does not enforce a standard imple-mentation style. As a result, File Contains and Class Contains graphs are most likely to be viewed together.
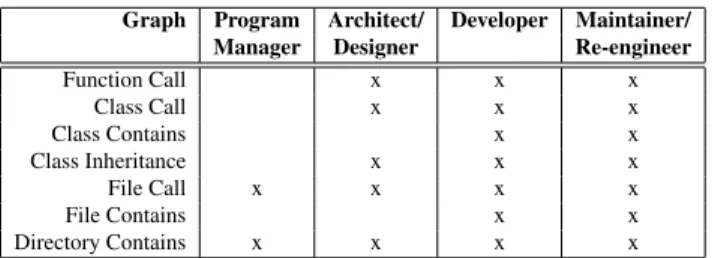
• ADirectory Containsgraph represents the relationship between files and their corresponding directories. Our graph-based program model is a union of the graphs implemented and described above. Table 1 shows examples of how various stakeholders might communicate software architecture through a particular set of graph types.
1We consider only graph-based tools and visualization approaches.
Graph Program Architect/ Developer Maintainer/ Manager Designer Re-engineer
Function Call x x x Class Call x x x Class Contains x x Class Inheritance x x x File Call x x x x File Contains x x Directory Contains x x x x
Table 1. Correlation Graphs - Stakeholders
Table 1 only suggests what information might be of interest to each stakeholder. Of course, we might modify the table to reflect the interest, expertise, or task at hand. The key point in Table 1 is that aunifiedarchitectural visualization more flexibly supports and encourages interaction among stakeholders, compared to visualizing and communicating multiple stakeholder-specific representations in various no-tations.
2.2. Augmenting the model with analyses
There is more information of interest to various stakehold-ers than plain structural graphs can represent. For instance, when investigating a Directory Contains graph, a project manager would also like to understand the complexity of the files being viewed with respect to other metrics, such as size. The additional program information can either be shown in tables and be related to the views, or more prefer-ably be integrated directly into the views themselves. For our prototype, we have implemented a number of anal-yses, the results of which can be attached to our program model. We list examples below; though not all-inclusive, this list can be extended easily:
Run-Time Analyses. We collect run-time information about C/C++ applications using thegprof profiling tool.
• Execution Time Analysis profiles the time spent in functions, identifying performance “hot spots,” or functions that execute for an exceptionally long time.
• Execution Frequency Analysis profiles the call quency of functions to determine exceptionally fre-quently called functions.
Metric Analysescollect program information about single entities such as functions.
• Lines of Code (LOC)is measured for each function.
• Unsafe Function Calls. Certain aspects of C++ (e.g., unchecked array access, raw pointers), can lead to low-level buffer overflows, page faults, and segmentation
faults. In this analysis, we detect calls to “unsafe” functions, such assprintf,scanf,strcpy.
• Global Variables. We traverse the program’s abstract syntax tree (AST) to check for public declared vari-ables (within the scope of classes) and global varivari-ables (outside the scope of classes). It is considered a good programming style to avoid global variables.
• New-Delete Analysis. In C++, when deleting scalar en-tities, the scalar C++deletestatement should be used to ensure correct program behavior. Similarly, dy-namically allocated arrays must be deleted with the
delete[]statement. Our analysis is based on data-flow and control-flow information.
• Cyclomatic Complexity (CC)indicates how much ef-fort is required to maintain a function. Our imple-mentation of McCabe’s Cyclomatic Complexity [19] counts the possible execution branches in a function for the following branching statements: if, for, while, do-while, and (switch-)case.
• Arithmetic Complexity. For each function, this analy-sis counts the number of arithmetic operations on float, int, float pointer, and int pointer types. Thus, functions and classes with large arithmetic operation counts can be detected. This is particularly important in scientific computing codes, since such functions should be the most robust and reliable pieces of the software.
Advanced Static Analyseshelp to recover various hidden aspects of software. In general, these analyses can not be interpreted alone; results indicate relations between entities.
• Pattern Matching is used to locate functional and non-functional properties of a software system, e.g., MPI [22] calls in high performance computing. This approach is similar to visualizing aspects from aspect-oriented programming (AOP) [13].
• Class Membership. This analysis annotates each mem-ber function with its associated class and source file it is implemented in. It discovers fragmented member functions,i.e., member functions declared in the same class but defined in different files. This analysis may uncover “bad” coding styles or refactoring efforts that were applied to split large source files.
• Strongly Connected Components (SCC). We detect cyclic dependencies between functions, classes or files. In general, nodes in a cyclic dependency may be merged to reduce call dependencies, and hence to reduce the structural complexity of the system.
Repository Analysesretrieve information from a source-code repository such as CVS or SVN and attach it to the current program model. In our current implementation of
C/C++ visualization, we have not attached this information yet. We base the need for such information on our previ-ous studies visualizing Java repository information [20, 24] using VizzAnalyzer [35] and Kenyon [3].
• Work Distribution is an analysis that determines the specific developers that are working on a specific part of a software system. This information gives an idea about the progress of the maintenance or development team and can also assist to estimate time to completion.
• Frequent Change. Entities changed frequently result in higher maintenance efforts and costs. Thus, it is essential to determine frequently changed components.
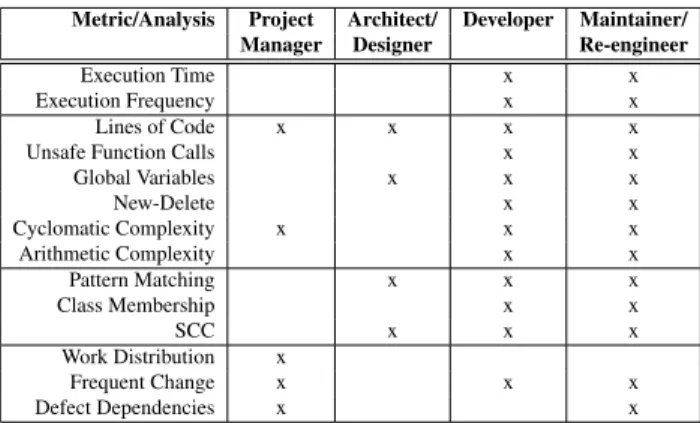
• Defect Dependencies show how certain defects and their bug-fixes relate [4, 6]. Defect analyses may help to predict software project/maintenance costs. Table 2 lists stakeholders and these analyses in which they might be particularly interested.
Metric/Analysis Project Architect/ Developer Maintainer/ Manager Designer Re-engineer
Execution Time x x
Execution Frequency x x
Lines of Code x x x x
Unsafe Function Calls x x
Global Variables x x x New-Delete x x Cyclomatic Complexity x x x Arithmetic Complexity x x Pattern Matching x x x Class Membership x x SCC x x x Work Distribution x Frequent Change x x x Defect Dependencies x x
Table 2. Correlation Analyses - Stakeholders
Table 2 only suggests what is possible. For our prototype, we have implemented all of the analyses above (except pat-tern matching and the repository analyses). The analysis results are attached to our model graph. With the model graph at hand, the user can now view, interactively select (reduce) and communicate information of interest.
3. Practical Single-View Visualization
We believe that single-view visualizations are better than multi-view visualizations when communicating about soft-ware architecture. First, single-view illustrations avoid the difficulties when managing and navigating through different views [27, 28, 32]; secondly, they rapidly summarize a sys-tem because all information is available within that view; and thirdly, having one view helps different stakeholders to easily communicate different concerns within the same familiar picture. Single-view visualizations do not replace
detailed stakeholder-specific visualizations. Rather, they unify different stakeholder-specific architectural visualiza-tions to a common image that can easily be communicated, as is done in the engineering industry where task-specific blueprints are unified to be understood by architects, electri-cians, civil engineers, and others. As an example, Kruchten introduced (software) architectural blueprints in which a logical view describes classes and associations for end users and a development view describes modules and compila-tion dependencies for developers and managers [16]. Both views are essential. Nevertheless, we believe that a single unified view combining both the logical and development view could support the communication between end users, developers and managers. We plan to evaluate this hypoth-esis in future work.
To study the effects of single-view visualizations, we have developed a tool prototype,cf.Section 4. For our prototype to work effectively (i.e., by reducing the cognitive over-load for a viewer [28, 32]), we need to handle the inher-ent complexity of multiple architectural aspects within one view. Below, we describe complexity reduction techniques we have selected and implemented from literature:
• Abstraction. To cope with a flood of information, we need mechanisms for filtering, aggregating, or merging low-level details into higher-level properties [25, 36]. Abstraction techniques are part of Vizz3D [20].
• Association with Source Code. The architectural vi-sualization should be easy to relate to the underlying software artifact [36]. Therefore, we have extended Vizz3D with the capability to interactively view the source code in association with any node of the archi-tectural view. This feature associates architecture and source levels,cf.Section 2.
• Metaphors. Many graphic designs lack an intuitive in-terpretation, requiring that a user be trained to under-stand them. We can alleviate this problem by selecting metaphors that are familiar to the user, such as those found in the real world. Tangible metaphors improve understanding and social interaction [8]. We have chosen and implemented the city metaphor [14, 24],
cf.Section 4.1, to increase program understandability.
• Predictability. Two different runs of a layout algo-rithm, involving the same graphs, should not lead to radically different visual representations. This prop-erty is also referred to as “preserving the mental map” of the user [23]. While force-directed layouts are usu-ally not predictable, hierarchical algorithms improve the situation, but they do not scale particularly well. For improved predictability and scalability, we have implemented a combination of force-directed and hi-erachical layout within our tool,cf.Section 4.2.
The items above do not constitute an all-inclusive list of complexity reduction techniques or features a tool should support. There are several other techniques discussed in the literature [31, 36]. Some techniques were not chosen be-cause of their minor impact. For instance, focus and con-text [9], in which a user focuses on a visual detail with-out losing the visual context, also aids program compre-hension. However, as Storey, et al., report in their user study, although focus and context (particularly fish-eye) views are thought to be useful, in practice they tend not to be used [32]. Moreover, it is not our primary goal to define a complete list, but rather to implement a reasonable number of techniques to support our goal to show that our single-view visualization can present all manners of architectural information.
4. Implementation: Vizz3D
Our prototype is based on Vizz3D [20, 34], a 3D informa-tion visualizainforma-tion system primarily developed for program visualization. Vizz3D is highly flexible and allows users to define and reassign layout algorithms and metaphors at run-time. Hence, visualizations can be configured on-line [20]. To reduce a user’s cognitive load, Vizz3D has a variety of operations, such as the aggregation and filtering of nodes. In addition, users may at run-time filter all nodes and edges of certain types, thereby allowing the visualization of ar-bitrary combinations of the graphs defined in Section 2.1. For instance, a user may interactively select several types of edges to display; the resulting same image might then represent a Function Call graph, a Class Call graph, a File Contains graph, or all graphs simultaneously.
We have enhanced Vizz3D with the ability to view the cor-responding source code when interactively selecting visual entities. In addition, to achieve predictable and consistent layouts and to provide an intuitive representation of our program model, we have configured our own layout and metaphor for Vizz3D. (Sections 4.1–4.2, below).
Our prototype works on real C and C++ applications [33]. To build our implementation, we have used, combined, and enhanced the following reverse engineering tools: ROSE [29], a C/C++ source-to-source code transformation tool used for program retrieval; ROSEVA, a program ana-lyzer developed to create and merge the various graphs de-scribed above; VizzAnalyzer [35], a framework for reverse engineering tool integration, allowing us the rapid integra-tion of various program analysis and visualizaintegra-tion tools; and for language interoperability between C/C++ (ROSE and ROSEVA) and Java (VizzAnalyzer), we use Babel [2].
4.1. An intuitive city metaphor
Metaphors help users to better understand complex situa-tions. For our architectural program visualization, we have chosen a city metaphor [14, 24]. Our metaphor comprises the following elements,cf. Figure 12. Buildings represent functions. Buildingtexturesrepresent source code metrics; for instance, the (tall) blue colored buildings in Figure 1 indicate aLOC>200. Similarly, other textures in this im-age indicate other thresholds. Cities(blue plates) indicate source files. Pillars(C++ only), shown perpendicular to cities in Figure 2, represent class definitions. The pillars are the foundation forwater towers(spheres), representing header files. In this way, a header file can have multiple class definitions. Finally, (green)landscapes, which carry cities and water towers, represent directories. The water and sky in Figure 1 and 2 are optional aesthetic decorations. Note that the above is an example of one visual configura-tion; to determine the most effective configuration, cogni-tive studies must be conducted. Vizz3D merely allows dif-ferent user defined mappings (from program model entities to visual entities). For more information see [20].
4.2. Computing consistent layouts
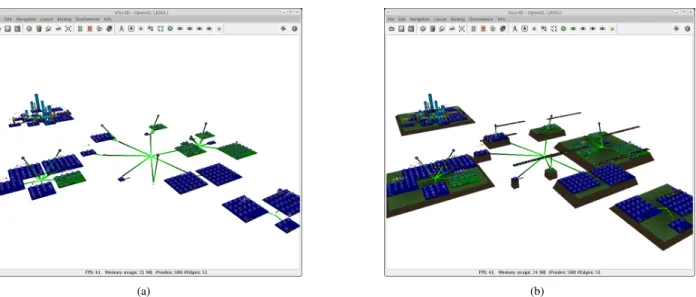
Our layout algorithm extends the force-directed algorithm of Huang and Eades [11] by combining it with a hierarchi-cal algorithm. Because force-directed layout algorithms can in general be rather slow, we calculate the forces for coarse-grained nodes first,i.e., for header files, source files, and di-rectories. Figure 3 a) shows the layout of 36 files. The edges
2Directed edges are color interpolated from a light to a dark color.
Figure 2. Architectural Visualization.
representDirectory Containsrelationships. Files belonging to the same directory, representing components by design, are laid out close together. The size of a source file reflects the number of functions defined within it. Buildings are laid out compactly next to each other,i.e., they are not part of the force-directed layout. The second step is to apply the landscapes (directory structure) for the cities (files),cf. Fig-ure 3 b). The height of the landscape (y-axis) represents the depth of the directory path. Therefore, cities or files in a deeper directory structure are represented on a higher hier-archical level. As a result of the force-directed layout, di-rectories containing subdidi-rectories are laid out more closely. As subdirectories are on a higher hierarchical level, subdi-rectories produce “visual mountains”, similar to 3D tree-maps [5], where directory structures are represented to the user in a hierarchical way.
Our layout provides predictable visualizations (see Sec-tion 3) in that different runs of the system produce fairly similar landscapes. Together with our 3D city metaphor, fa-miliar entities can quickly be rediscovered. The current lay-out predictability can even be improved if the initial random seed of our layout is kept constant across multiple runs.
4.3. Representing analysis results
Our single-view restriction means that all analysis results are displayed in one view, raising immediate concerns about information overload. To overcome this problem, we dis-play metrics either with 2Dicons[27] within our 3D scene (i.e., 2D icons are shown on top of each building and above each city to convey information), or we use visual proper-ties such as height, width, depth, and texture, among oth-ers. Analysis results may also be represented by color; this means, however, that only one analysis at a time can be rep-resented. For instance, all strongly connected components are colored red (the top roof of a building).
5. Application Examples
We envision a variety of scenarios in which our single-view architectural visualization would be particularly useful. We outline several such scenarios in this section, emphasizing the ways in which our approach can facilitate collaboration and discussion among stakeholders.
5.1. Quality Assessment
Project managers and developers can easily assess various aspects of a software system’s quality in our one-view
vi-(a) (b)
Figure 3. (a) layout algorithm between files (b) adding the directory structure
sualization. For instance, consider Figure 1, which com-bines a File Call-, Class Inheritance-, Class Contains-,
File Contains- and Directory Contains graph. In addi-tion, this figure shows software complexity information (fire texture), global variables (globe icon), oversized functions (blue buildings), unsafe functions (lock icon), and run-time information (the width and depth represents run-time infor-mation).
By interactively examining Figure 1, developers can com-municate concerns, such as global variables, new-delete de-viations, or unsafe functions, to managers, and help the managers understand where and why additional time must be spent to improve those components. Similarly, complex areas of the system, as indicated by cyclomatic or arith-metic complexity, can be easily illustrated via the common metaphor. Developers of all skill levels can use this kind of visualization to detect and communicate concerns, and they may do so over a variety of communication media, such as teleconferencing or virtual reality displays.
We anticipate that single-view collaboration will help stake-holders detect code quality problems earlier, make meetings more effective, and reduce project costs in general.
5.2. Componentization
Once a software system becomes large, it is essential to de-componentize it,i.e., to split it into smaller reusable compo-nents that eventually can be maintained or sold separately. A single-view architectural visualization may again help to communicate componentization issues and costs among management, developers, and re-engineers, using analyses
such as pattern matching, class membership, and SCC. For example, consider the analysis of class membership violations. As described in Section 2.2, a class member-ship analysis determines fragmented member functions,i.e., member functions declared in the same C++ class (usually header file) but defined in different source files. Suppose a file represents a component. From a reusability perspective, a “good” coding style might prefer that all member func-tions of one class be implemented in the same source file. A re-engineer might write a simple analysis to check this condition and print the results as text to the screen. Though this screen dump provides useful information, this information might be of limited use if the original devel-opers are not present to guide changes. An architectural visualization, on the other hand, might supply some of the developers’ expertise through additional metrics visualized at the same time. For instance, consider Figure 4, where the class membership relationship is indicated by assigning the same color to each member function of a class. In Figure 4, the directory “/wpp3D/” contains four source files and one header file. The header file contains one class (pillar) that contains eight member functions, indicated by their red col-oration. We see that one member function is defined in a dif-ferent source file,i.e., a fragmentation is present. However, due to the additional LOC information, even a non-expert could conclude that the exceptional member function has been refactored due to its size.
Our single-view architectural visualization helps us to un-derstand the specific analysis problem at hand. Moreover, it shows the entire context of all additional entities and relationships involved. For example, one can determine whether the exceptional method described above occurs in
Figure 4. Class Membership Visualization.
the same directory as the other methods in its class or not. Furthermore, call edges may be activated turning the Class Contains graph into a merge of the Class Contains and Function Call graphs. The additional information may help to investigate the purpose of certain functions in the context of the whole program.
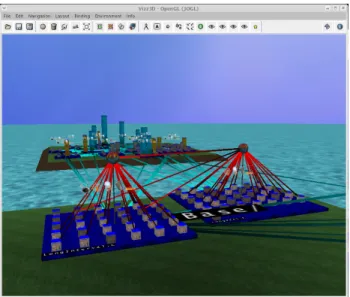
Another example is the detection of strongly connected components. Again, if only printed to the screen as a list, the context might be lost. For instance, Figure 5 shows an architectural visualization of a file call graph. The files themselves are color coded; a green color indicates a cy-cle. Seeing the analysis result in the context of the directory structure, one could assume that all files in the cycle be-long to the lower right directory. There are however two exceptions. It is now up to the developer or re-engineer to determine whether the exceptional files should be moved.
6. Comparison to Related Work
There is a large literature on existing architectural visual-ization tools. We can classify these approaches according to the number of aspects they visualize using how many views.
• Single-aspect, single-view. Illustrate only one aspect of a software architecture, e.g., CrocoCosmos [18], sv3D [21].
• Multi-aspect, single-view. Our work is an example of this class. Another example is SHriMP [31], allow-ing the interactive, sallow-ingle-view navigation between ar-chitecture and source code. SHriMP is a great tool for architectural browsing and understanding of source code. However, SHriMP was not developed with stakeholder communication in mind; it does not sup-port a natural metaphor or the ability to add multiple analysis and metric results within the view.
• Multi-aspect, multi-view. Illustrate multiple views of the architecture level, e.g., CodeCrawler [17], BLOOM [30]3.
Other approaches, such as ArgoUML [1], exist. However, these applications visualize not just architectural level infor-mation, but rather a combination of architecture and middle level. Further recommendations and cognitive studies on (architectural) multi-views can be found in [10, 16, 32]. We believe that multiple views are important for detecting and answering many problems, especially when depicting low-level analysis results in middle-level visualizations. In such cases, it is impossible to view all the possible aspects of software in one image. However, when illustrating the architecture of a software system to various stakeholders, we believe that showing the different architectural aspects
3Note that some architecture level tools might also be used for other
purposes,e.g., CodeCrawler supports also class blueprints and therefore could as well qualify as a multi-level, multi-view visualization tool.
Figure 5. Strongly Connected Components Visualization.
in the same view with the same metaphor and layout is de-sirable. In this paper, we have suggested how it is possible to merge and filter the essential information for different stakeholders. This helps stakeholders get precise answers to their questions and, moreover, enables them to commu-nicate the answers among themselves and others.
7. Conclusion and Future Work
Our tool is a proof-of-concept design for a multi-aspect, architectulevel, single-view visualizer. This paper re-views our philosophy and implementation, with particular emphasis on how different stakeholders can use such visu-alizations as an aid in collaborative understanding, devel-opment, maintenance, and re-engineering of a large-scale software system. The key features of our approach are the use of an intuitive city metaphor for representing the struc-ture of the system architecstruc-ture, a single view for visualizing multiple aspects and analysis results, and powerful filtering and focusing techniques built into the tool implementation. We have integrated and extended a variety of analysis and visualization tools, allowing us in future work to evaluate the trade-offs of using a unified single-view for architecture-level program visualization and communication. In prepa-ration for such future experiments, we have classified and implemented program analyses, identified and implemented
complexity reduction techniques for large scale visualiza-tions, and implemented a layout algorithm and metaphor in our visualization tool, Vizz3D.
8. Acknowledgments
This work was performed under the auspices of the U.S. De-partment of Energy by University of California, Lawrence Livermore National Laboratory under Contract W-7405-Eng-48, UCRL-CONF-227293. We thank Jeremiah Will-cock and Christian Iwainsky for numerous helpful discus-sions.
References
[1] ArgoUML. Available at: http://argouml.tigris.
org/, 2004.
[2] Babel. Available at: http://www.llnl.gov/CASC/
components/, July 2006.
[3] J. Bevan, S. Kim, and L. Zou. Kenyon: A common software
stratigraphy system. Available at: http://www.soe.
ucsc.edu/research/labs/grase/kenyon/,
2005.
[4] D. Beyer. Co-change visualization. InProceedings of the 21st IEEE International Conference on Software
Mainte-nance (ICSM 2005, Budapest, September 25-30), Industrial and Tool volume, pages 89–92, Budapest, 2005.
[5] T. Bladh, D. Carr, and J. Scholl. Extending tree-maps to three dimensions: a comparative study. In M. Masoodian, S. Jones, and B. Rogers, editors,6th Asia-Pacific Confer-ence on Computer-Human Interaction (APCHI 2004), New Zealand, June 2004.
[6] M. Burch, S. Diehl, and P. Weissgerber. Visual data min-ing in software archives. InSoftVis ’05: Proceedings of the 2005 ACM symposium on Software visualization, pages 37– 46, New York, NY, USA, 2005. ACM Press.
[7] S. Demeyer, S. Ducasse, and O. Nierstrasz.Object-Oriented Reengineering Patterns. Morgan Kaufmann Publishers, 2003.
[8] C. R. dos Santos, P. Gros, P. Abel, D. Loisel, N. Trichaud, and J. Paris. Metaphor-aware 3d navigation. InIEEE Sym-posium on Information Visualization, pages 155–65. Los Alamitos, CA, USA, IEEE Comput. Soc., 2000.
[9] G. W. Furnas. The FISHEYE view: A new look at struc-tured files. Technical Report 81-11221-9, Murray Hill, New Jersey 07974, U.S.A., 12 1981.
[10] J. C. Grundy, R. Mugridge, and J. Hosking. Visual specifica-tion of multi-view visual environments. InIEEE Symposium on Visual Languages, Halifax, Nova Scotia, Canada. IEEE CS Press, September 1998.
[11] M. L. Huang and P. Eades. A fully animated interactive sys-tem for clustering and navigating huge graphs. In6th Int. Symposium on Graph Drawing, pages 374–383. Springer LNCS 1547, 1998.
[12] M. J¨unger and P. Mutzel, editors.Graph Drawing Software. Springer, 2004.
[13] G. Kiczales, K. Lieberherr, H. Ossher, M. Aksit, and T. El-rad. Discussing Aspects of AOP. Communications of the ACM, 44(10), October 2001.
[14] C. Knight and M. C. Munro. Virtual but visible software. In
IV00, pages 198–205, 2000.
[15] R. Koschke. Software Visualization in Software Mainte-nance, Reverse Engineering, and Reengineering: A Re-search Survey. Journal on Software Maintenance and Evo-lution, 15(2):87–109, March 2003.
[16] P. Kruchten. The ”4+1” view model of architecture. IEEE Software, 12(6):42–50, November 1995.
[17] M. Lanza. Codecrawler a lightweight software visualiza-tion tool. InVisSoft 2003 (2nd International Workshop on Visualizing Software for Understanding and Analysis). IEEE Computer Society Press, 2003.
[18] C. Lewerentz and F. Simon. Metrics-based 3D Visualization of Large Object-Oriented Programs. In1st International Workshop on Visualizing Software for Understanding and Analysis, June 2002.
[19] W. Li and S. Henry. Maintenance Metrics for the Object Oriented Paradigm. InIEEE Proceedings of the 1st Interna-tional Software Metrics Symposium, May 1993.
[20] W. L¨owe and T. Panas. Rapid Construction of Software Comprehension Tools. International Journal of Software Engineering and Knowledge Engineering, December 2005.
[21] A. Marcus, L. Feng, and J. I. Maletic. 3D Representations for Software Visualization. InProceedings of ACM Sympo-sium on Software Visualization, 2003.
[22] Message Passing Interface Forum (MPIF). MPI: A
Message-Passing Interface Standard. Technical
Re-port, University of Tennessee, Knoxville, June 1995. http://www.mpi-forum.org/.
[23] K. Misue, P. Eades, W. Lai, and K. Sugiyama. Tree visuali-sation and navigation clues for information visualivisuali-sation.J. of Visual Languages and Computing, 6:183–210, 1995. [24] T. Panas, R. Berrigan, and J. C. Grundy. A 3d metaphor for
software production visualization. InIV03, London, UK, June 2003. IEEE.
[25] T. Panas, W. L¨owe, and U. Aßmann. Towards the unified re-covery architecture for reverse engineering. InInternational Conf. on Software Engineering Research and Practice, Las Vegas, USA, June 2003.
[26] T. Panas, J. Lundberg, and W. L¨owe. Reuse in reverse en-gineering. InInternational Workshop on Program Compre-hension, Bari, Italy, June 2004.
[27] G. Parker, G. Franck, and C. Ware. Visualization of large nested graphs in 3d: Navigation and interaction.Journal of Visual Languages and Computing, 9(3):299–317, 1998. [28] M. Petre, A. Blackwell, and T. Green. Cognitive questions
in software visualization.Software Visualization: Program-ming as a Multimedia Experience, pages 453–480, January 1998.
[29] D. Quinlan, S. Ur, and R. Vuduc. An extensible open-source compiler infrastructure for testing. InProc. IBM Haifa Ver-ification Conference, volume LNCS 3875, pages 116–133, Haifa, Israel, November 2005.
[30] S. P. Reiss and M. Renieris. The BLOOM Software Visual-ization System. InSoftware Visualization – From Theory to Practice, MIT Press, 2003.
[31] M.-A. D. Storey, F. D. Fracchia, and H. A. Mueller. Cogni-tive design elements to support the construction of a mental model during software visualization. InProc. of the 5th Int.
Workshop on Program Comprehension (WPC ’97),
Wash-ington, DC, USA, 1997. IEEE Computer Society.
[32] M.-A. D. Storey, K. Wong, and H. A. M¨uller. How do
program understanding tools affect how programmers un-derstand programs? Science of Computer Programming, 36(2–3):183–207, 2000.
[33] T. Panas. Quality Analysis of SMG2000. Technical report, CASC, Lawrence Livermore National Laboratory, Novem-ber 2006.
[34] Vizz3D. Available at: http://vizz3d.
sourceforge.net, July 2006.
[35] VizzAnalyzer. Available at:http://www.arisa.se/,
2006.
[36] P. Young and M. Munro. Visualising software in virtual re-ality. InProc. IEEE 6th Int. Workshop on Program Compre-hension, June 24-26, pp19-26. Ischia, Italy, IEEE Computer Society Press., 1998.