Selection of our books indexed in the Book Citation Index in Web of Science™ Core Collection (BKCI)
Interested in publishing with us?
Contact [email protected]
Numbers displayed above are based on latest data collected.For more information visit www.intechopen.com Open access books available
Countries delivered to Contributors from top 500 universities
International authors and editors
Our authors are among the
most cited scientists
Downloads
We are IntechOpen,
the world’s leading publisher of
Open Access books
Built by scientists, for scientists
12.2%
122,000
135M
TOP 1%
154
Image Processing based Classifier for Detection
and Diagnosis of Induction Motor Stator Fault
T. G. Amaral
1, V. F. Pires
2, J. F. Martins
3, A. J. Pires
4and M. M. Crisóstomo
51
Escola Superior Tecnologia de Setúbal / Instituto Politécnico de Setúbal
Institute of Systems and Robotics / University of Coimbra
2
Escola Superior Tecnologia de Setúbal / Instituto Politécnico de Setúbal
3CTS-UNINOVA and Departamento de Engenharia Electrotécnica Faculdade
de Ciências e Tecnologia / Universidade Nova de Lisboa
4
CTS-UNINOVA and Polytechnic Institute of Setúbal
5Institute of Systems and Robotics and DEECS/ University of Coimbra
Portugal
1. Introduction
Induction motors are one of the most widely used electrical machines. These motors play a very important role in the present industrial life. Therefore, the need to insure a continuous and safety operation for this motors, involves preventive maintenance programs with fault detection techniques. In general, condition monitoring schemes have concentrated on sensing specific failure modes. Electrical faults such as winding and rotor faults are responsible for an important percentage of total motor failures (Hadremi, 2000) (Bonnett et al., 2008). Preventive maintenance of three-phase induction motors also plays a very important role in the industrial life (Thorsen et al., 1995). This procedure requires monitoring their operation for detection of abnormal electrical and mechanical conditions that indicate, or may lead to, a failure of the system. In fact, in the last years monitoring induction motors becomes very important in order to reduce maintenance costs and prevent unscheduled downtimes. Therefore, there has been a substantial amount of research to provide new condition monitoring techniques for ac induction motors (Kliman et al., 1992) (Thomson, 1999). Several strategies have been proposed to access operation conditions of induction motors (Kliman et al., 1988) (Tavner et al., 1987) (Nandi et al. 1999) (Toliyat et al., 1985) (Riley et al., 1999) (Dister et al., 1998) (Henao et al. 2003) (Li 2006). However, the input stator currents represent the most widely used signal in identifying machine faults (Çolak et al., 2005) (Benbouzid, 2000) (Bayindir et al., 2007). There are several main reasons for this: most of the machine unbalances would reflect into the current waveform, the current is feasible and inexpensive to monitor and the monitoring technique is non-invasive. One of the most significant methods based on the analysis of the machine line currents is the motor current signature analysis (MCSA) (Schoen et al., 1995) (Çalis et al., 2008) (Thomson et al., 2001) (Bellini et al., 2001) (Pires et al., 2009). This method is based on the motor line current monitoring and consequent inspection of its deviations in the frequency domain. Another
approach based on the analysis of the machine line currents is the Park’s vector approach (Cardoso et al., 1995). This method is based on the identification of the stator current Concordia patterns, requiring the user to have some degree of expertise in order to distinguish a normal operation condition from a potential failure. A common fact to all of these techniques is that the user must have some degree of expertise in order to distinguish a normal operation condition from a potential failure mode. Therefore, fully automatic pattern recognition methods are required to identify induction motor stator fault. Thus some artificial intelligence tools have been introduced (Nejjari et al., 2000) (Zidani et al., 2003) (Haji et al., 2001) (Ondel et al., 2006) (Martins et al., 2007). However, many of these tools require a prior identification of the system, and only then they are able to identify some faulty situation. On the other hand, the presence of noise along with the nonlinear behaviour of the machine can make this task very difficult.
Under this context, this paper proposes new procedures for the detection of a three-phase induction motor stator fault. These procedures are based on the image identification of the stator current Concordia patterns, and will allow the identification of turn faults in the stator winding as well as its correspondent severity. The identification of the faulty phase is another important feature of the proposed algorithm.
2. Pattern recognition approach
The analysis of the three-phase induction motor can be simplified using the Clark- Concordia transformation (1).
(1)
This transformation allows reducing a three-phase system into an equivalent two-phase system (with a zero-sequence component). In three phase induction motors the connection to the mains does not usually use the neutral, implying that the mains current has no homopolar component. Under this situation the three-phase induction motor α line currents are then given by (2).
(2)
Considering ideal conditions for the motor and an unbalanced voltage supply, (3) can be obtained.
(3)
Figure 1 shows the structure of the stator currents acquisition, where they are transformed into two-phase equivalents using the Clark-Concordia transformation.
Fig. 1. Structure of the stator currents aquisition.
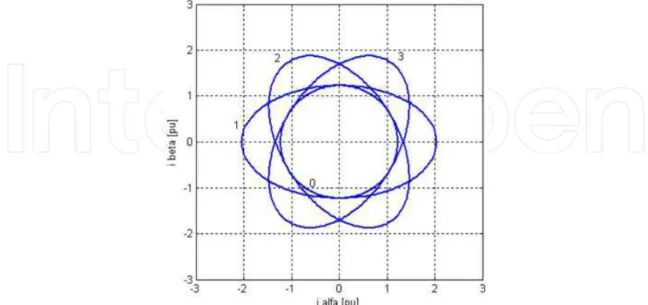
The obtained Clark-Concordia transformation results in a circular or an elliptic pattern, as can be seen in Figure 2. A healthy three-phase induction motor generates a circle (the radius of circle depends on load, being bigger for higher loads and vice versa). A fault in a stator
Fig. 2. Current Concordia vector pattern 0 - healthy motor, 1 - turn fault in the stator winding phase a, 2 - turn fault in the stator winding phase b 3 - turn fault in the stator winding phase c.
winding implies a distortion in the circle, assuming an elliptic pattern whose major axis orientation is associated to the faulty phase. This elliptic pattern changes according to the fault severity. For more severe faults the eccentricity of the ellipse increases.
The main idea is to implement a fully automatic pattern recognition process, which recognizes the presence of a fault, identifies the faulty phase and, furthermore, reports a severity index for that fault. The proposed algorithms deal with the diagnosis of stator winding faults by means of pattern recognition methods, based only on the acquisition of two input currents. The described algorithms will extract features of the obtained current patterns, in an automatic pattern recognition process that automatically discern the behaviour of the motor (faulty or healthy). This will allow the identification of turn faults in the stator winding and its correspondent severity.
3. Image processing based system
In order to implement a pattern recognition based fault detection, a feature-based recognition of the current stator pattern, independent of their shape, size and orientation must be obtained. Finding efficient invariants features is the key to solve this problem. Particular attention is paid to statistic moments and visual-based features obtained in the image processing system.
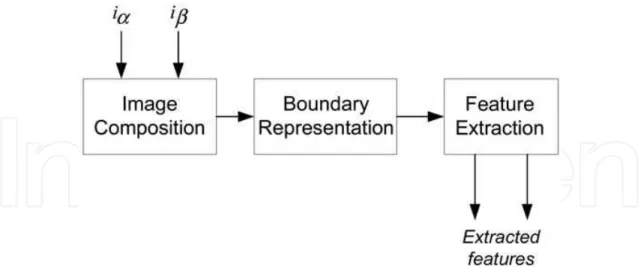
The proposed image-processing algorithm is divided in three stages: the image composition, the boundary representation and the feature extraction (Figure 3). The inputs for the image processing based system are the α stator currents. The feature extraction must identify the image characteristics that can be obtained from the image composition. It was possible to verify that the obtained images for a healthy or a faulty motor are different. These differences are obtained by the feature extraction block.
Fig. 3. Structure of the image processing based system.
3.1 Image composition
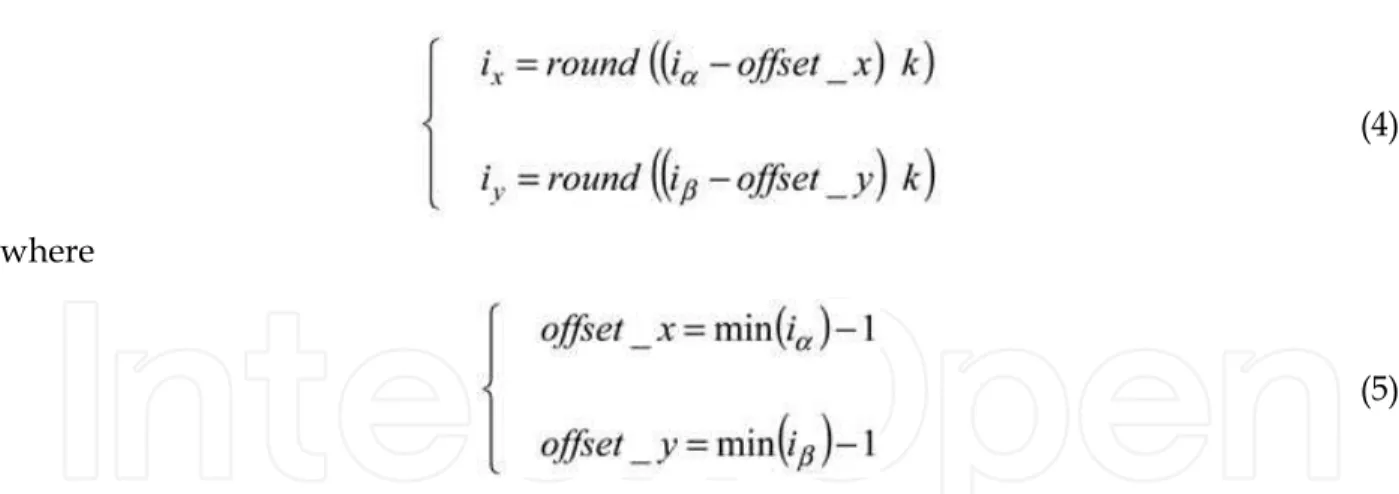
In the image composition stage, the α stator currents are first represented as an image in order to be used in the pattern recognition method. In this way, each sample α current value will be considered as a pixel belonging to the object contour with the coordinates (ix,
(4)
where
(5)
Consider an object with each pixel (ix, iy) as a gray level I(xi, yi). A binary image can be
considered as a particular case of a grey image with I(x,y)=1 for pixels that belong to an object, and I(x,y)=0 for pixels that belong to the background. Figure 4 shows the α stator currents represented in the image plan after the image composition process.
Fig. 4. Image plan for the three phase induction motor α line currents.
3.2 Boudary representation
To implement the pattern recognition method, after the image composition it is necessary to determine the shape of the region.
To represent the boundary of the region and at the same time obtain some properties that help feature extraction the chain code algorithm is used (Ballard et al., 1982). This algorithm leads to an efficient calculation of the region area and his contour perimeter. However, the right and left upper points (tr_p, tl_p) of the region must also be obtained (Figure 5). These two points corresponds to the first and last pixels present on the first line of the region.
4. Features extraction methodologies
The last stage of the image-processing algorithm is the features extraction. There are several feactures extraction methodologies. Here are presented two effective algorithms that can be used for the induction motor fault detection: Visual features and statistic based moments methods.
4.1 Visual features
The feature extraction stage uses the area of the object and the contour perimeter to compute the index of compactness. To obtain the distance between the xc coordinate of the gravity center of the region and the x coordinate of the mean upper point of the region it is necessary to compute the gravity center (xc, yc).
The index of compactness and the distance between the xc coordinate of the gravity center of the region and the x coordinate of the mean upper point of the region are the key features for the fault diagnosis procedure.
Assume that the pixels in the digital image are piecewise constant and the dimension of the bounded region image for each object is denoted by M×N, the visual features, area and perimeter, used to determine the I.O.C. can be obtained as (Amaral et al., 2001):
(6)
(7) where Arcxy is the length of the arc along the object contour where x and y are connected
neighbors. If the connectivity is type-4 then Arcxy=1, otherwise Arcxy= .
The index of compactness is then given by:
(8) Physically, the index of compactness denotes the fraction of maximum area that can be encircling by the perimeter actually occupied by the object.
The coordinate xc of the gravity center is given by:
(9)
where the yc coordinate it is not necessary to compute.
The distance between the xc coordinate of the gravity center of the I region and the x
coordinate of the mean upper point of the region is given by:
where tl_p and tr_p are the x coordinates of the top-left and the top-right points of the region.
In Figure 6 it is represented the distance between the xc coordinate of the gravity center of
the region and the x coordinate of the mean point between the top-left and top-right points of the region I.
Fig. 6. Distance used in the system classifier.
4.2 Statistic moments
Another possible approach to obtain efficient invariants features is based on the use of the statistic moments algorithm. This algorithm uses the regular and the central moments to obtain the features needed for the fault diagnosis (Amaral et al., 2007). The α stator currents are first represented onto an image in order to be used in the pattern recognition method. Again, each pixel belonging to the object contour represent each α sample current. Considering an object with each pixel (xi , yi) as a gray level I (xi , yi). The (p+q) order of the
regular moment is given by:
(11) where the sum is made over the image all M pixels.
The (p+q) order of the central moment is invariant to translation and is obtained considering the origin of the object at his gravity center (12).
(12)
The coordinates represent the gravity center of the object. These coordinates can be obtained using the regular moments of zero and first orders and are given by:
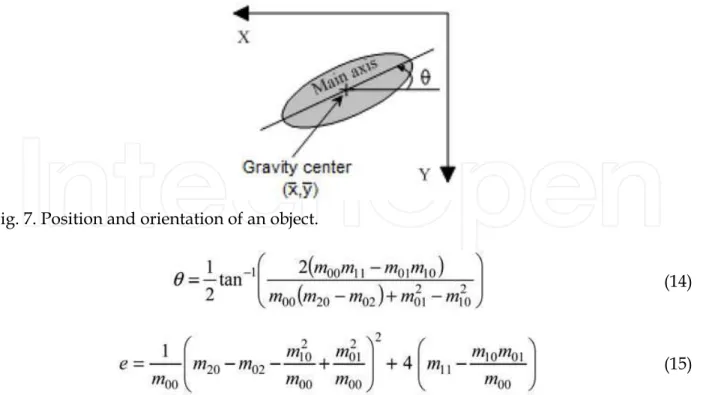
(13) The features used in the system recognition are the main axis angle of the α currents pattern and it’s eccentricity. The main axis angle (Figure 7) and the eccentricity can be obtained using six regular moments such as:
Fig. 7. Position and orientation of an object.
(14)
(15) These two features can be obtained more effective using only three and four central moments in the computation of the main axis angle and eccentricity, respectively. The relation between the regular and the central moments can be obtained by:
(16)
Using these relations, the main axis angle - θ- and the eccentricity - e - can be obtained using the following equations (Ballard et al., 1982):
(18) A binary image can be considered as a particular case of a grey image with I(x,y)=1 for pixels that belong to an object, and I(x,y)=0 for pixels that belong to the background. Using only the sum of all pixels that belong to a 2D object, the regular and central moments equations used to obtain the two features can now be obtained as:
(19)
(20)
5. Neuro-fuzzy classifier
Neural networks and statistical methods are particularly well adapted for data classification. However it is also possible to use a fuzzy system for the classification problem without replacing the aforementioned methods but as a different approach to achieve the same results, with the following advantages:
• vague knowledge can be used; • the classifier is interpretable;
• easy to implement, to use and to understand.
Since classifiers are usually derived from data, one method to obtain a fuzzy classifier is to use a neuro-fuzzy approach. The fuzzy classifier obtained by a learning procedure is called a neuro-fuzzy classifier but this “neuro-fuzzy” term strictly only applies to the creation or in the training phase. Afterwards, once the classifier is applied there only remains a fuzzy system for classification. This type of neuro-fuzzy system it is called a cooperative neurofuzzy system (Nauck et al., 1997).
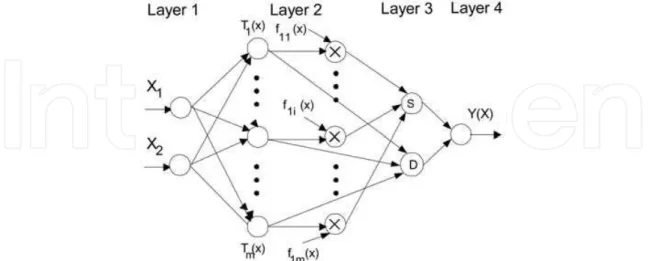
The interpretation of the classifier is often illustrated by representing it in a neural network structure. Figure 8 shows the structure of the neuro-fuzzy inference system used in data classification. This figure represents the structure example of a four-layered neuro-fuzzy system with two inputs and one output. This connectionist structure effectively performs the fuzzy inferencing with some minor restrictions. In a generalized architecture for the proposed approach, there can be n nodes in first layer (input layer) and m nodes in the second layer (pattern layer) corresponding to the input and rule numbers, respectively. The number of nodes in the third layer (summation layer) depends on the number of output nodes. As it happens in the Generalised Regression Neural Network (G.R.N.N.) configuration, the number of nodes in the third layer is equal to the nodes of the output layer plus one node (Specht, D. F., 1991), (Chen, C. H., 1996), (Tsoukalas et al., 1997). Observing Figure 8, if the output layer has one output node then the third layer must have two nodes.
Each layer has a specific functionality that contributes to the equivalence of the fuzzy inference system.
The input layer consists in the input of the data values derived from the input features. The output of each node is the degree to which the given input satisfies the linguistic label associated to the correspondent node.
Fig. 8. Adaptive neuro-fuzzy inference system.
The pattern layer represents the rule set of the fuzzy inference system. The number of nodes in this layer it is the same as the number of rules in the fuzzy inference system. Each node, called rule node, is a special type of radial basis function processor and represents a rule where the output of each basis function unit Ti (xj) is given by equation (21).
(21)
is the membership function of jth fuzzy set in the ith rule antecedent. Each membership function has four parameters and it can have different shapes and be asymmetric (Amaral et al., 2002b).
The summation layer has two different types of processing units: the summation and the division units. The function of the summation unit is essentially the same as the function of the output units in the radial basis function network. The division unit only sums the weighted activations of the pattern units without using any activation function. The number of the summation units is always the same as the number of the G.R.N.N. output units. Each node in the output layer consists in a simple division of the signal coming from the summation unit by the signal coming from the division unit, as defined by equation (22).
(22)
p denotes the number of output nodes in the output layer.
If the fuzzy inference system has one output then the linear function fpi (xj ) of the firstorder
Sugeno rule can be described by the following equation:
The number of layers of the adaptive neuro-fuzzy inference system and the function of each node in the four layers are also similar to the G.R.N.N.. Thus it was constructed an adaptive network that it is functionally equivalent to a type-3 fuzzy inference system (Takagi & Sugeno fuzzy if-then rules).
In the learning of the fuzzy inference system two learning algorithms are applied. An iterative grid partition algorithm tunes the four parameters of each antecedent membership function (Amaral et al., 2002a). The first three parameters correspond to the left, the center and the right position of each membership function and the fourth parameter to its shape. The parameters of local model f1i (x j)are learned by Least Square Error (L.S.E.).
6. Results
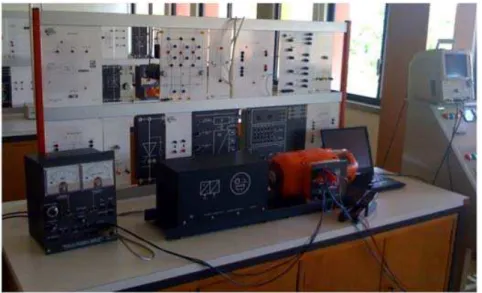
In order to obtain experimental results it was used and induction motor with the following characteristics: 1kW, 220/380V, 50Hz. The machine load is provided by means of an electromagnetic brake and the stator currents are acquired through a personal computer data acquisition board (Figure 9). After the acquisition of the stator currents, these currents are transformed into a 2D object using the α transformation.
Fig. 9. Experimental prototype for the proposed fault detection system.
6.1 Simulation results based on visual features
In order to verify the proposed algorithm, the fault diagnostic system was first simulated in the Matlab environment. The induction motor was initially simulated without any fault. In this case the corresponding vector pattern is a circle centered at the origin of the coordinates. Other simulations were considered. Initially, several tests were done in which the severity of the fault was rather small, then new tests were conducted in which the severity of the fault was higher. Table I presents the obtained results for the two features. When the induction motor has no fault the index of compactness is, approximately, 0.0726. Figure 10 presents the current vector pattern for the healthy motor, which does not present any eccentricity. For a small induction motor fault, the index of compactness decreases to 0.0720, denoting that the α pattern exhibits some eccentricity (Figure 11). As can be seen by the results presented in Table I the distance between the xc coordinate of the region gravity center and the mean point between the top-left and top-right points of the region
(DIST_XC_TLR), is different for each phase fault, denoting this distance value the faulty phase. As long the fault becomes more severe, the I.O.C decreases and the DIST_XC_TLR increase its absolute value. In Figure 12 a severe phase fault is presented.
Table I Simulation results
Fig. 10. Simulation result in the α current vector pattern for the healthy motor.
Fig. 12. Simulation result in the α current pattern for the motor with a severe fault.
6.2 Experimental results based on visual features
The induction motor was initially operated without any fault. In this case the corresponding
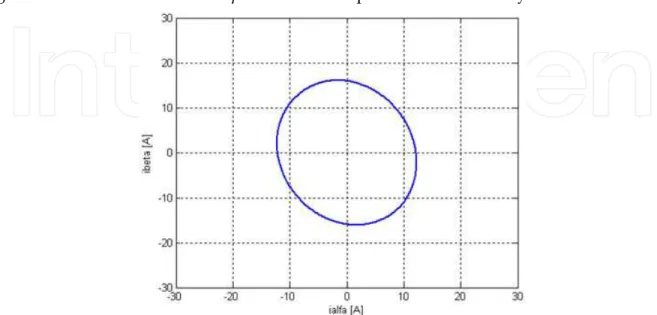
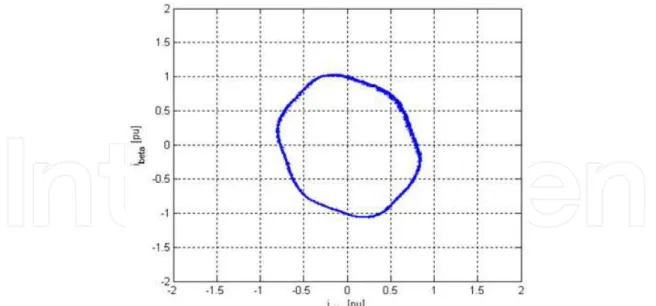
α vector pattern it is practically a circle centered at the origin of the coordinates, as presented in Figure 13. This pattern slightly differs from a perfect circle pattern because the supply voltage is not a perfectly unbalanced sinusoidal system (Zidani et al., 2003). Due to this problem, the I.O.C and the DIST_XC_TLR when the induction motor presents no fault are 0.0739 and –2.45, respectively.
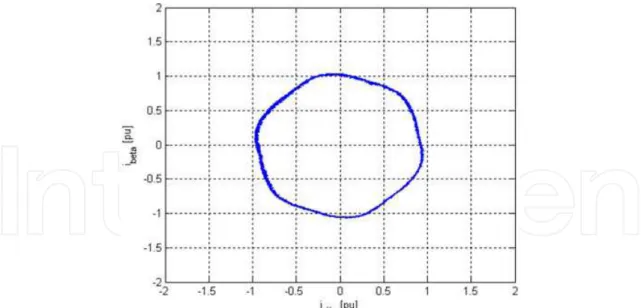
Fig. 13. Experimental result in the α current Park’s vector pattern for the healthy motor. Figure 14 presents the corresponding α vector representation, under an induction motor stator-winding fault. As expected, within faulty operation there is a distortion in the circle, assuming an elliptic pattern whose major axis orientation is associated to the faulty phase. In this case the I.O.C and the DIST_XC_TLR are 0.0705 and -3.95, respectively. The obtained negative distance value, indicate that the fault occurred in phase b.
Fig. 14. Experimental result in the α current Park’s vector pattern for the motor with a small stator fault.
6.3 Simulation results based on statistic moments
In order to verify the proposed method, the system shown in Figure 9 was first simulated in the Matlab environment. The induction motor was initially simulated without any fault. In this case the corresponding α vector pattern is a circle centered at the origin of the coordinates. Other simulations were considered. First, several tests were done in which the severity of the fault was rather small. Then new tests were conducted in which the severity of the fault was higher. Table II shows the obtained results by the statistic moments. The statistic excentricity moment when the induction motor has no fault is 0.99 (Figure 10). This means that the α current pattern does not present any eccentricity. For a small induction motor fault (Figure 11), the statistic eccentricity moment decreases to 0.75, showing that the
α pattern exhibits some eccentricity. As can be seen by the results presented in Table II the ellipse angle is different for each phase fault, denoting this angle the faulty phase. Also the statistic moment eccentricity increases as long the fault becomes more severe (Figure 12).
Table II Simulation results
6.4 Experimental results based on statistic moments
Initially the induction motor operated with no fault and the obtained α vector pattern differs slightly from a perfect circle. Due to this problem, the statistic eccentricity moment
when the induction motor presents no fault is 0.92. When the induction motor was operated within faulty there is a distortion in the circle, assuming an elliptic pattern whose major axis orientation is associated to the faulty phase. In this case the statistic eccentricity moment is 0.78. The obtained angle value is 14.1°, denoting that the fault occurred in phase b.
7. Conclusions
In this chapter an image processing based classifier for detection and diagnosis of induction motor stator fault was presented. This system is based on the obtained stator currents and the correspondent Clark-Concordia transformation. This results in a circular or an elliptic pattern, of the Clark-Concordia stator currents. From the obtained current patterns it was used an image processing algorithm to identify if there is a motor fault. The image processing algorithm is divided in three stages: the image composition, the boundary representation and the feature extraction. For the the features extraction it was used two effective algorithms that can be used for the induction motor fault detection: Visual features and statistic based moments methods. The extract features of the the obtained current patterns allows to identify the turn faults in the stator winding and its correspondent severity. Several simulation and experimental results have been presented. From these results it was possible to verify that the proposed image based classifier can effectively be used for the diagnosis of induction motors.
8. References
Amaral, T. G.; Crisóstomo, M. M.; Pires, V. F. & Almeida, A. T. (2001). Visual Motion Detection with Hand-Eye Manipulator Using Statistic Moments Classifiers and Fuzzy Logic Approach – Study, Application and Comparation. The 27th Annual
Conference of the IEEE Industrial Electronics Society, IECON’01, Denver, Colorado, USA, November 29 to December 2, 2001.
Amaral, T. G; Crisóstomo, M. M. & Pires, V. F. (2002a). Adaptive Neuro-Fuzzy Inference System for Modelling and Control”, The IEEE International Symposium of Intelligent Systems, Bulgária, September.
Amaral, T. G.; Crisóstomo, M. M. & Pires, V. F. (2002b). Helicopter Motion Control Using Adaptive Neuro-Fuzzy Inference Controller. The 28th Annual Conference of the IEEE
Industrial Electronics Society, IECON’02, pp.2090-2095, Sevilla, Spain, November 2002.
Amaral, T. G.; Pires, V. F.; Martins, J. F.; Pires, A. J. & Crisóstomo, M. M. (2007). Statistic Moment Based Method for the Detection and Diagnosis of Induction Motor Stator Fault. International Conference on Power Engineering, Energy and Electrical Drives,
POWERENG’07, pp.106-110, Setúbal, Portugal, April 2007. Ballard, D. H. & Brown, C. M. (1982). Computer Vision, Prentice-Hall.
Bayindir, R. & Sefa, I. (2007). Novel approach based on microcontroller to online protection of induction motors, Energy Conversion and Management, vol. 48, 3, pp. 850–856, March 2007.
Bellini, A.; Filippetti, F.; Franceschini, G. & Tassoni, C. (2001). Quantitative Evaluation of Induction Motor Broken Bars by Means of Electrical Signature Analysis,
IEEE Transactions on Industrial Applications, vol. 37, no 5, pp. 1248–1255, Sep./Oct. 2001.
Benbouzid, M. E. H. (2000). A review of induction motor signature analysis as a medium for faults detection, IEEE Transactions Industrial Electronics, vol. 47, no. 5, pp. 984–993, Oct. 2000.
Bonnett, A. H. & Yungb, C. (2008). Increased Efficiency Versus Increased Reliability, IEEE Industrial Applications Magazine, pp 29-36, Jan/Feb 2008.
Cardoso, A. J.; M. Cruz, S. M. A.; Carvalho, J. F. S. & Saraiva, E. S. (1995). Rotor Cage Fault Diagnosis in Three-Phase Induction Motors by Park’s Vector Approach, IEEE Industry Applications Conference 1995, vol. 1, pp. 642–646, 1995.
Çalis, H. & Çakır, A. (2008). Experimental study for sensorless broken bar detection in
induction motors, Energy Conversion and Management, vol. 49, 4, pp. 854–862, April 2008.
Chen, C. H. (1996). Fuzzy Logic and Neural Network Handbook, McGraw-Hill.
Çolak, I.; Çelik, H.; Sefa, I. & Demirbas, S. (2005). On line protection systems for induction motors, Energy Conversion and Management, vol. 46, 17, pp. 2773–2786, Octuber 2005.
Driankov D.; Hellendoorn H. & Reinfrank M. (1993). An Introduction to Fuzzy Control, Springer-Verlag.
Dister, C. J. & Schiferl, R. (1998). Using temperature, voltage, and/or speed measurements to improve trending of induction motor rms currents in process control and diagnostics, Proceedings of the IEEE – IAS annual meeting conference, vol. 1, pp 312-318, October 1998.
Hadremi, B. M. El (2000). A review of induction motor signature analysis as a medium for fault detection, IEEE Transactions on Industrial Electronics, vol. 47, pp 984-993, October 2000.
Haji, M. & Toliyat, H. A. (2001). Pattern recognition-a technique for induction machines rotor broken bar detection, IEEE Transactions on Energy Conversion, vol. 16, no 4, pp. 312–317, December 2001.
Henao, H.; Demian, C. & Capolino, G. A. (2003). A frequency domain detection of stator winding faults in induction machines using an external flux sensor, IEEE Transactions on Industry Applications, vol. 39, no 5, pp. 1272-1279, September/October 2003.
Kliman, G. B. & Stein, J. (1992). Methods of motor current signature analysis, Electric Machines and Power Systems, vol. 20, nº5, pp 463-474, September 1992.
Kliman, G. B.; Koegl, R. A.; Stein, J.; Endicott, R. D. & Madden, M. W. (1988). Noninvasive detection of broken rotor bars in operating induction motors, IEEE Transactions on Energy Conversion, vol. EC-3, no. 4, pp. 873–879, December 1988.
Li,W. (2006). Detection of Induction Motor Faults: A Comparison of Stator Current, Vibration and Acoustic Methods, Journal of Vibration and Control, vol. 12, no. 2, pp. 165–188, February 2006.
Martins, J. F.; Pires, V. F. & Pires, A. J. (2007). Unsupervised Neural-Network-Based Algorithm for an On-Line Diagnosis of Three-Phase Induction Motor Stator Fault,
Nandi, S. & Toliyat, H. A. (1999). Condition monitoring and fault diagnosis of electrical machines - A review, IEEE Industry Applications Conference 1999, vol. 1, pp. 197–204,
1999.
Nauck, D.; Klawon, F. & Kruse, R. (1997). Foundations of Neuro-Fuzzy Systems, John Wiley & Sons.
Nejjari, H. & Benbouzid, M. (2000). Monitoring and Diagnosis of Induction Motors Electrical Faults Using a Current Park’s Vector Pattern Learning Approach, IEEE Transactions on Industry Applications, vol. 36, pp. 730–735, May/June 2000.
Ondel, O.; Boutleux, E. & Clerc, G. (2006). A method to detect broken bars in induction machine using pattern recognition techniques, IEEE Trans. Industry Applications, vol. 42, no 4, pp. 916–923, July-August 2006.
Pires, D. F.; Pires, V. F.; Martins, J. F. & Pires, A. J. (2009). Rotor Cage Fault Diagnosis in Three-Phase Induction Motors Based on a Current and Virtual Flux Approach,
Energy Conversion and Management, vol. 50, 4, pp. 1026-1032, 2009.
Riley, C. M.; Lin, B. K.; Habetler, T. G. & Kliman, T. G. (1999). Stator Current Harmonics and their Causal Vibrations: A Preliminary Investigation of Sensorless Vibration Monitoring Applications, IEEE Transactions on Industry Applications, vol. 35, nº 1, pp. 94–99,January/February 1999.
Schoen, R. S.; Habetler, T. G.; Kamran, F. & Bartheld, R. G. (1995). Motor Bearing Damage Detection Using Stator Current Monitoring, IEEE Transactions on Industrial Applications, vol. 31, no 6, pp. 1274–1279, November/December 1995.
Specht, D. F. (1991). A General Regression Neural Network, IEEE Transactions on Neural Networks, vol. 2, nº. 6, pp. 568-576, November 1991.
Tavner P. J. & Penman, J. (1987). Condition Monitoring of Electrical Machines, New York: Wiley, 1987.
Thorsen, O. V. & Dalva, M. (1995). A survey of faults on induction motors in offshore oil industry, petrochemical industry, gas terminals, and oil refineries, IEEE Transactions on Industrial Applications, vol. 31, no 5, pp. 1186–1196, September/October 1995.
Thomson, W. T. (1999). A review of on-line condition monitoring techniques for three-phase squirrel cage induction motors—Past present and future, IEEE Symposium on Diagnostics for Electrical Machines, Power Electronics and Drives, vol. 7, pp. 3–18, September 1999.
Thomson, W. T. & Fenger, M. (2001). Current signature analysis to detect induction motor faults, IEEE Industry Applications Magazine, vol. 7, pp. 26–34, July-August 2001.
Toliyat, H. A. & Lipo, T. A. (1985). Transient analysis of cage induction machines under stator, rotor bar and end ring faults, IEEE Transactions Energy Conversion, vol. 10, pp. 241–247, June 1985.
Tsoukalas, L. T. & Uhrig, R. E. (1997). Fuzzy and Neural Approaches in Engineering, John Wiley & Sons, Inc..
Zidani, F.; Benbouzid, M.; Diallo, D. & Nait-Said, M. (2003). Induction Motor Stator Faults Diagnosis by a Current Concordia Pattern-Based Fuzzy Decision System, IEEE Transactions Energy Conversion, vol. 18, pp. 469–475, December 2003.
Zidani, F.; Benbouzid, M.; Diallo, D. & Nait-Said, M. (2003). Induction Motor Stator Faults Diagnosis by a Current Concordia Pattern-Based Fuzzy Decision System, IEEE Transactions on Energy Conversion, vol. 18, pp. 469–475, December 2003.
ISBN 978-953-307-026-1 Hard cover, 516 pages
Publisher InTech
Published online 01, December, 2009
Published in print edition December, 2009
InTech Europe
University Campus STeP Ri Slavka Krautzeka 83/A 51000 Rijeka, Croatia Phone: +385 (51) 770 447 Fax: +385 (51) 686 166 www.intechopen.com
InTech China
Unit 405, Office Block, Hotel Equatorial Shanghai No.65, Yan An Road (West), Shanghai, 200040, China Phone: +86-21-62489820
Fax: +86-21-62489821
There are six sections in this book. The first section presents basic image processing techniques, such as image acquisition, storage, retrieval, transformation, filtering, and parallel computing. Then, some applications, such as road sign recognition, air quality monitoring, remote sensed image analysis, and diagnosis of industrial parts are considered. Subsequently, the application of image processing for the special eye examination and a newly three-dimensional digital camera are introduced. On the other hand, the section of medical imaging will show the applications of nuclear imaging, ultrasound imaging, and biology. The section of neural fuzzy presents the topics of image recognition, self-learning, image restoration, as well as evolutionary. The final section will show how to implement the hardware design based on the SoC or FPGA to accelerate image processing.
How to reference
In order to correctly reference this scholarly work, feel free to copy and paste the following:
T. G. Amaral, V. F. Pires, J. F. Martins, A. J. Pires and M. M. Crisóstomo (2009). Image Processing based Classifier for Detection and Diagnosis of Induction Motor Stator Fault, Image Processing, Yung-Sheng Chen (Ed.), ISBN: 978-953-307-026-1, InTech, Available from: