Using Transformed Item Difficulty Procedure to Assess Gender
–Related Differential Item Functioning Of Multiple-Choice
Mathematics Items Administered In Nigeria
MADU, Barnabas. C. PhDDEPARTMENT OF SCIENCE EDUCATION UNIVERSITY OF NIGERIA, NSUKKA.
Email: [email protected], [email protected] ABSTRACT
This study investigated gender-related differential items functioning in multiple-choice mathematics items administered by National Examination Council (NECO) in 2011 in Nigeria. The method employed was Transformed Items Difficulty (TID). The samples used for the study were drawn from data set containing responses of 1600 examinees from 15 secondary schools randomly drawn from 20 co- educational senior secondary schools in Nsukka Local Government Area of Enugu state, Nigeria. The sample was made up of 774 males and 826 females. The study provides evidence that there are gender differences in performance in multiple-choice test items in mathematics that vary according to contents area even when the content is closely related to curriculum. However, very few items (8 out of 50 items) were in favour of males while non was in favour of females. The implication of this is that most of the items neither favour males nor females when subjected to analysis using TID. However, test items may carry with them demands other than those associated with gender. The significance of this study is that the results show an incorrect picture of the quality of education for different groups and this may likely lead to the resources for education being distributed in an unfair manner. From these results it is therefore recommended that test developers need to balance some aspects of content to reduce form-to-form variation in the effects of item properties on the performance of male and female examinees.
Keywords: Transformed item Difficulty, Differential Item functioning, Perpendicular distance, item difficulty, Delta value, Mathematics.
In recent years, policy makers, administrators and test developers have paid considerable attention to the issue of test fairness. A fair test is one that is comparably valid for all groups and individuals and affords all examinees an equal opportunity to demonstrate the skills and knowledge which they have acquired and which are relevant to tests purposes (Roever, 2005). Various aspects of fairness in testing have been highlighted in the literature, including fairness in regards to standardization, test consequence /score use, and item bias (Kunnan, 2000; Shohamy, 2000). Item bias has considerable ramifications at a policy, administrative, and classroom level. As such bias can lead to systematic errors that distort the inferences made in the classification and selection of students (Zumbo, 1999).
Items may be biased because they contain sources of difficulty beyond the one(s) of interest, possibly resulting in a discrimination against particular groups (Zumbo, 1999). For instance, it is possible that the results of an intelligent test are systematically lower for a specific minority group, not because the group is less intelligent, but because some items are related to specific knowledge and abilities that are shown more by the majority, while they are not intended to measure by the test.
Determining whether an item on a test displays bias or not has a number of significant implications for researchers, selection personnel, test takers and policy makers. The primary issue is one of consequential matters of test fairness and equity. Concern about equity with respect to male and female has generated considerable interest in educational achievement. Presumably, because of the complexity of gender-related issues,, results reported from a variety of studies are inconsistent and often even contradictory (Willingham & Cole, 1997).
Hyde (1991); Cleary (1992); Willingham & Cole (1997) suggest that such contradictory results may be accounted for by disentangling effects of different cohorts, construct selectivity of the sample. Hough (2003) examined the gender difference of US students and Chinese students in their solution processes of solving routine and non-routine mathematical problems. Results of the study showed that in overall there were statistically significant gender differences (favouring males) on both routine and non-routine problem solving for the US students, but not for the Chinese students.
Researcher consistently found out that the male students are superior in symmetry and visualization (Geary, 1996). On the hand, females show superiority in computation based on the data available. Gender differences in achievement in favour of boys have been found in standardized tests and are most prominent at the very high levels of achievement (Leder 1992). These differences that are likely to be both content and ability dependent are regarded as Differential Item Functioning (DIF). Gender related differences item functioning (DIF) is a constant concern on a large scale standardized achievement tests in mathematics such as the ones conducted by National Examination Council (WAEC) for National Senior School Certificate Examination (NASSCE), because differences between males and females are often found (Boughton, Gierl, & Khaliq, 2000; Bienlinski & Davison, 2001),
Differential item functioning (DIF) is a statistical technique that is used to identify differential item response patterns between groups of examinees such as male and female and this helps in verifying potentially biased test items. According, to Zumbo (1999) DIF occurs when examinees with the same underlying ability on the construct measured by the test, but who are from different groups have a different probability of correctly answering the item. He continues with a conceptualization of the basic principles of DIF: if different groups
of examinees (e.g males and females) have roughly the same level of knowledge then they should perform similarly on individual test items regardless of group membership. DIF is different from previous classical test theory techniques used to assess bias because DIF matches the groups on the latent variable of interest. Previous bias studies compared mean scores either without matching technique or simply compared the factor structure for the groups of interest (Zumbo, 2003; Zumbo & Koh, 2005). This implies that group differences on observed scores such as group comparison of scale or item means, may be misleading because respondents are not first matched on the construct of interest.
Various methods have been suggested for DIF. These methods include techniques that examine differences in
• Relative item difficulty across different groups
• Item discrimination across groupss
• The item- characteristic curves for different groups
• The distribution of incorrect response for various groups
• Multivariate factor structures across groups
Thus, the researcher wishing to select DIF method is confronted with many method and no clear guidelines for choosing among them. For this study, the researcher employed Transformed Item difficulty (TID) method.
2.Transformed Item Difficulty (TID) Method
This method is classified by many researchers and authors as a tool for detecting DIF (Joshua, 1990). This method is based on Item Response Theory (IRT) models in which the probability of a correct response is
related to person and item covariates. These covariates often are person and item indicators (Dummy covariates) weighted with parameters that are called ability and difficulty respectively. IRT model, the Probability of a correct response of a person J to an item i is regarded as a function of the person’s ability (θj) and the item difficulty (bi). The method involves computing of P-value (proportion of examinees getting the item right) for each item separately for each group. Using tables of the standardized normal distribution the normal deviate Z is obtained corresponding to the (I-P) the percentile of the distribution, ie Z is the tabled value having proportion (I-P) of the normal distribution below it. Then to eliminate negative Z-values, a delta (∆) value is from the Z-value by the equation
∆ = 4Z + 13 --- (1)
A large delta value indicates a difficult item. For two groups there will be a pair of delta values for each item. These pairs of delta values can then be plotted on a graph. A line can be fitted to the plot of points; and the deviation of a given point from the line is taken as measure of that items bias, large deviation indicating much bias (Subkoviak, Mark, Ironson & Crag, 1987).
In this study, the equation used for the major of the ellipse was Y = AX + B (the best fitting line) in which Y = Males delta values (Am)
X = Females delta vales (Al) B = µx-Aµy where
A = Line slope
B = Line sector of the Y-axis
µy = Mean of delta values for females (Al) µx = Mean of delta values for males (Am)
A =
(
) (
)
x x x y xy x x x y xy x x x y x x x y S S r S S r S S S S 2 4 2 2 + − ± − --- (2) Sx = Standard deviation of the deltas for male groupSy = Standard deviation of the deltas for female group rxy = The correlation between deltas for males and females The perpendicular distance (Di) that each point deviates from the major arise was calculated from the formula
Di = 1 2 + − A BYi AXi --- (3) Where
Xi = male’s delta for item i Yi = female’s delta value for item i
Those items with (Di) values in excess of ± one unit reveal DIF. The larger Di is, the more biased the item. A signed transformed difficulty measure of DIF, which preserved both direction and magnitude of DIF, was obtained by attaching a positive sign to Di if the item reveals DIF in favour of females and a negative sign if the item reveals DIF in favour of the males. For this study, a value of Di greater than one unit indicates DIF, favouring females, whereas a value Di less than minus one unit indicates DIF favouring males (Osterlind1983).
3. Samples
The samples used in this study included 774 males and 826 females giving a total of 1600 drawn from candidates of 15 secondary schools randomly selected from 20 co-education senior secondary schools in Nsukka Local Government Area. In each of the sampled schools, all the results of the entire students who wrote the Senior School Certificate Examinations (SSSCE) in June/July 2011 were studied.
The data were gathered from response of candidates in fifty multiple choice questions set and administered by National Examination Council (NECO), for 2011 Senior Secondary School Certificate Examination (SSSCE) in mathematics. Person-by-item response matrix obtained from NECO office was used to map out
the ability groups for each of the subgroups for the analysis of DIF. All the candidates from both the reference (male) and focal (female) groups were grouped into five score intervals with respect to the observed total test scores and gender. The reference group examinees serve as standard for comparison while focal group are examinees that are viewed as being disadvantaged on the test. From literature, it is assumed that the reference group is the group that is functioning at higher ability and the focal group is the group that is functioning at lower ability.
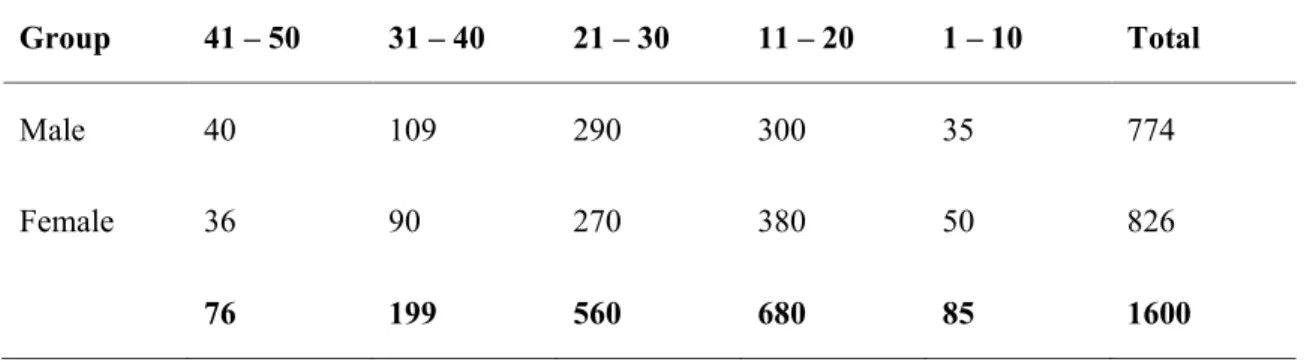
The distribution of the observed test scores by distinct groups and by gender is shown in table 1. INSERT TABLE 1 HERE
The multiple choice items were scored 1 for correct option and 0 for wrong option with maximum of 50 and minimum of 0. The method employed to test the hypothesis is Transformed Item Difficulty (TID).
3.1. Hypothesis: Item administered by NECO in mathematics do not function differentially between male and female students.
3.2. Research Questions: Which items in mathematics multiple choice questions administered by NECO show differential between male and female?
4 .Results
The results presented in table 2 are used to test the hypothesis and answer the research questions. INSERT TABLE 2
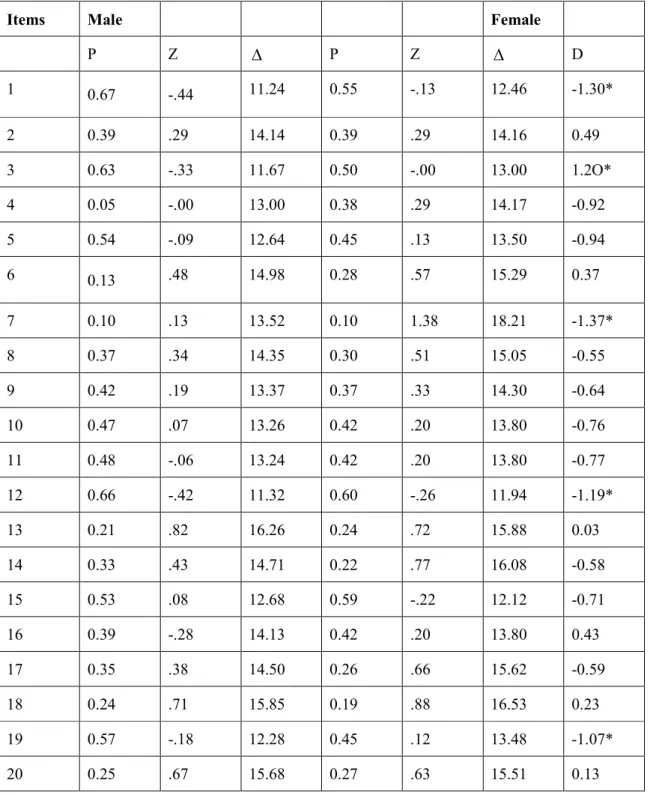
Table 2 shows the item difficulty, the z-values, the delta values and the DIF statistics for TID method for each of the 50 items at .05 level of significance. Eight items were in favour of males while none was in favour of females. The items in favour of males are: 1, 3, 7, 12, 19, 26, 27, and 46. The range of D that
signifies DIF in favour of males was from -1.37 to 1.01 whereas none was obtained for females. To identify possible content sources of this bias, table 3 is provided.
INSERT TABLE 3
5. Discussion
The study provides evidence that there are gender differences in performance on test items in mathematics that vary according to content even when the content is closely tied to curriculum. From Table 2, the items that are flagged in favour of males are 1, 3, 7, 12, 19, 26, 27 and 46 while non was in favour of females. Mathematics items indicating DIF in favour of males were found to involve Algebra, Number and Numerations and problems solving. For mathematics items revealing DIF in favour of male candidates the contents characteristics involved the use of more abstract mathematical concepts, such as, algebraic concepts, mathematical definitions and the expression of a number in expanded notation.
Both mean raw score and DIF index point to the conclusion that females had no advantage over males in any of the items, whereas males had a little advantage in items involving proportional reasoning number and computation and data analysis.
In previous studies, it has been shown that there is tendency for male to perform better than female on geometry and measurement and female to perform better on algebra but the findings of this study are not consistent with the previous studies since females did not in any way perform better than males in any of the items. The fact that this test was tied to a specific curriculum did not appear to help females performance. This might be that females benefit more only on instructional strategy that relies less on teaching algorithms. This tends to support the previous study that gender differences in performance on test items in
mathematics vary according to content even when the content is closely tied to curriculum (Abedalaziz, 2010).
Such a strong male advantage in algebra and problem solving as reflected in DIF indexes has not been previously noted. The advantage could perhaps be explained by noting that algebra items were very abstract and algorithmic, unlike the items in the other components Perhaps, these gender related differences in performance are as a result of both a reliance on routines learned in class as proposed by Gallagher (1992) and Bohlin (1994), and a lack of confidence on non- routine tasks as suggested by Seegers and Boekaerts (1996). This study indicates that males might benefit more than females from an instructional strategy that relies less on teaching algorithms and more on teaching problem solving and effective means of approaching non- routine problems.
6. Conclusion/Recommendations
The study is an exploratory study, using DIF data to reveal different performance characteristics of male and female examinees. The DIF analysis for this study were those contrasting male and female examinees. For the test studied, very few items had DIF statistics with sufficiently high values to be considered central of the type typically of interest. The features of items that are associated with these differences are likely also to be sources of variation in the difficulty of the types of items studied. The results suggest a possible need for balancing some aspects of content or other item features as part of test specifications in order to reduce form-to-form variation in the effects of these item properties on the performance of male and female examinees. The differences obtained illustrate that the results obtained in DIF analysis will vary, possible in important ways, according to the choice of criterion score for the analyses.
The DIF statistics should be seen as indicators of relative strengths and weaknesses of the two groups being compared when the overall ability that the test is intended to measure has been studied. An extreme DIF value may occur simply because of an unfortunate combination of item features, such as those examined as well as others that are yet to be discovered to produce an accumulation of small effects, each of which is related to the weaknesses of one of the groups being compared or strength of the other. Therefore, much additional work is needed in identifying sources of differential group performance before the developments can come about.
The limitation of this study is that if all the students have enough knowledge and skills in a particular topic, it is possible, if not probable that the balance in teaching between the topics varies between the schools and teachers. This may account for the variation in the differential performance of male and females students in the external examination.
REFERENCES
Abedalaziz, N.(2010). A Gender-related differential item functioning of mathematics test Items. The International Journal of Educational and Psychological Association,
5,101-116.
Bienlinski, J & Davison, M.L. (2001). A sex difference by item difficulty interaction multiple-choice mathematics items administered to National Probability samples. Journal of Educational Measurement, 38, 51 — 77.
Bohlin, C.F. (1994). Learning style factors and mathematics performance: Sex-related differences. International Journal ofEducational Researchers21, 387— 397.
Boughton, K. Gierl, M.J & Khalig, S.H. (2000). Differential bundle functioning on mathematics and science achievement tests. Paper presented at the annual meeting of the Canadian society in Education, Education, Alberta, Canado.
Cleary, T.A. (1999) Gender differences in aptitude and achievement test scores. Paper presented at the ETS invitational conference on sex equity in Educational opportunity, Achievement and Testing Princeton, NJ.
Gallagher, A.M. (1992) Sex differences in problem-solving strategies used by high-scoring examinees on the SAT-M New York: College Entrance Examination Board.
Geary, D.C (1996). Sexual Selection and Sex differences in mathematical abilities. Behavioural and Brain Science, 19, 229-284.
Hough, D. (2003). Exploring, gender differences of US and Chinese students in their solution processes of solving routine and non- routine mathematical problems. Research in Middle Level Education (RMLE), 26 (1), 132 — 163.
Hyde, J.S. (1991). Gender differences in mathematics performance: A meta analysis. Psychological Bulletin, 10 (792),139-155.
Joshua, M.T (1990). Test item bias in psychological testing, Unpublished Term Paper. Faculty of Education University of Calaber, Nigeria.
Kunnan, A.J. (2000). Fairness and justice for all. In A.J. Kunnen (Ed). Fairness and validation in language assessment: Selected papers from the 19th language Testing research Colloquim, Orlando Florida (pp 1 – 14). Cambridge, UK: Cambridge University press.
Leder, G.C (1992). Mathematics and gendc1: Charging perspectives, in D.A. Grouws (Ed), Handbook of research on mathematics teaching and learning New York: Macmilla.
National Examination Council (NECO) (2011).
Osterlind, S.D (1983). Test item bias. Berver1y Hills: Soye Publications
Roever, C. (2005). “That’s not fair!” Fairness, bias, and differential item functioning in language testing. website:http://www2hawaii.edu/ roeverbrowinbog.pdf retrieved November, 2010. Seegers, G., & Boekaerts, M. (1996). Gender-related difference in self- referenced cognitions in relation to mathematics. Journal for Research in Mathematics Education, 2 7(3), 215 – 240.
Shohamy, E. (2000). Fairness in language testing. In A.J. Kunnan (Ed.) Fairness and validation in language assessment: Selected papers from Language Testing Research colloquium, Orlando, Florinda (pp 15 - 19). Cambridge, UK: Cambridge University press.
Subvokiak, M., Mack, J., Ironson, G., & Craig, R. (1987). Empirical comparison of selected item bias detection procedures with bias manipulation. Journal of Educational Measurement, 21, 49- 58. Willingham, W.W., & Cole, N.S. (1997). Gender and fair assessment. Mahwah, N.J.; Lawrence Erlbaum Associates.
Zumbo, B.D. 91999). A handbook on the theory and methods of differential item functioning (DIF) Logistic regression modeling as a unitary framework for binary and Likert. Like (ordinal) item scores. Ohawa, Canada: Directorate of Human Resources Research and Evaluation.
Zumbo, B.D. (2003). Does item-level DIF manifest itself in scale-level Analyses?: Implications for Translating Language Tests. Language Testing, 20, 136- 147.
Zumbo, B.D., & Koh, K.H. (2005). Manifestation of Differences in Itemlevel characteristics in scale-level measurement invariance tests of multi-group confirmatory Factor Analyses. Journal of Modern Applied Statistical Methods, 4, 275-282.
Acknowledgement.
I appreciate the assistance of the officials of NECO for making available the results of the students used for this study.
Table 1: distribution of the observed test scores by distinct groups by gender.
Group 41 – 50 31 – 40 21 – 30 11 – 20 1 – 10 Total Male Female 40 36 109 90 290 270 300 380 35 50 774 826 76 199 560 680 85 1600
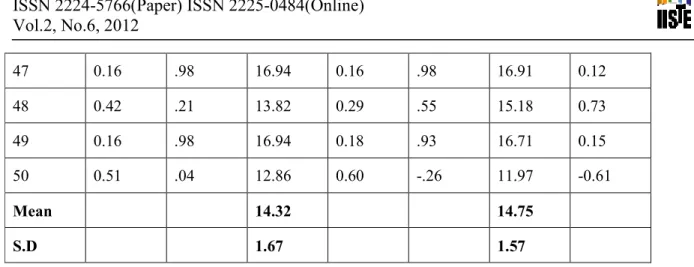
Table 2: Analysis of gender DIF in NECO 2011 June/July Multiple-choice mathematics test items using Transformed Item Difficulty (TID).
Items Male Female
P Z ∆ P Z ∆ D 1 0.67 -.44 11.24 0.55 -.13 12.46 -1.30* 2 0.39 .29 14.14 0.39 .29 14.16 0.49 3 0.63 -.33 11.67 0.50 -.00 13.00 1.2O* 4 0.05 -.00 13.00 0.38 .29 14.17 -0.92 5 0.54 -.09 12.64 0.45 .13 13.50 -0.94 6 0.13 .48 14.98 0.28 .57 15.29 0.37 7 0.10 .13 13.52 0.10 1.38 18.21 -1.37* 8 0.37 .34 14.35 0.30 .51 15.05 -0.55 9 0.42 .19 13.37 0.37 .33 14.30 -0.64 10 0.47 .07 13.26 0.42 .20 13.80 -0.76 11 0.48 -.06 13.24 0.42 .20 13.80 -0.77 12 0.66 -.42 11.32 0.60 -.26 11.94 -1.19* 13 0.21 .82 16.26 0.24 .72 15.88 0.03 14 0.33 .43 14.71 0.22 .77 16.08 -0.58 15 0.53 .08 12.68 0.59 -.22 12.12 -0.71 16 0.39 -.28 14.13 0.42 .20 13.80 0.43 17 0.35 .38 14.50 0.26 .66 15.62 -0.59 18 0.24 .71 15.85 0.19 .88 16.53 0.23 19 0.57 -.18 12.28 0.45 .12 13.48 -1.07* 20 0.25 .67 15.68 0.27 .63 15.51 0.13
21 0.43 .18 13.70 0.43 .17 13.68 -0.57 22 0.16 1.00 17.02 0.19 .89 16.55 0.21 23 0.43 +.19 13.75 0.43 .17 13.66 0.55 24 0.45 +.1 13.45 0.48 .06 13.24 -0.60 25 0.24 .70 15.80 0.34 .42 14.68 0.05 26 0.65 -.39 11.44 0.50 -.00 13.00 -1.31* 27 0.61 -.28 11.90 0.45 .12 13.48 -1.23* 28 0.42 .20 13.79 0.41 .23 13.92 0.58 29 0.37 .35 14.38 0.33 .44 14.76 -0.49 30 0.41 .23 13.94 0.36 .36 14.42 -0.02 31 0.15 1.05 17.21 0.11 1.20 17.82 0.07 32 0.36 .37 14.48 0.35 .35 14.52 0.42 33 0.39 .27 14.08 0.44 .13 13.53 -0.41 34 0.29 .55 15.22 0.28 .56 15.36 -0.28 35 0.39 .29 14.16 0.36 .35 14.42 -0.52 36 0.19 .86 16.45 0.20 .74 15.94 0.09 37 0.13 1.5 17.58 0.13 1.11 17.43 0.28 38 0.22 .77 16.07 0.19 .89 16.57 -0.15 39 0.28 .58 15.31 0.24 .70 15.81 -0.31 40 0.22 .76 16.05 0.25 .68 15.72 -0.02 41 0.33 .43 14.74 0.32 .47 14.88 -0.38 42 0.34 .41 14.62 -.29 .55 15.18 -0.47 43 0.57 -.17 12.32 0.52 -.05 12.80 -0.95 44 0.23 .74 15.94 0.21 .79 16.18 -0.14 45 0.19 .86 16.45 0.15 1.09 17.36 -0.14 46 0.56 -.16 12.36 0.48 .06 13.25 -1.01*
47 0.16 .98 16.94 0.16 .98 16.91 0.12 48 0.42 .21 13.82 0.29 .55 15.18 0.73 49 0.16 .98 16.94 0.18 .93 16.71 0.15 50 0.51 .04 12.86 0.60 -.26 11.97 -0.61 Mean 14.32 14.75 S.D 1.67 1.57
Table 3: Content source, number of items in each source and number of item that favour each groups. Content Source No of items in each
source No of items that favour males No of items that fvour female Algebra 14 2 -
Geometry & Trigonometry 19 - -
Number & Numeration 7 2 -
Problem Solving 8 4 -
Statistics & Probability 2 - -