Can System Dynamics Help?
Soroosh Nalchigar, Eric Yu, and Steve Easterbrook Department of Computer Science, University of Toronto{soroosh,eric,sme}@cs.toronto.edu
Abstract. Business intelligence (BI) and data analytics provide modern
enterprises with insights about internal operations, performance, as well as environmental trends, and enable them to make data-driven decisions. Insights resulting from these systems often suggest several alternative changes or corrective actions within the enterprise. In this context, to trade-off and find the most proper action(s) is a non-trivial task due to existing dynamics and complexities of the enterprise. This paper pro-poses a model-based approach to support the analysis and selection of best alternative actions in adaptive enterprise contexts. The proposed approach links and synthesizes two existing modeling frameworks, the Business Intelligence Model (BIM) and System Dynamics, in a system-atic step-by-step way to assist decision makers in finding best response action(s) from a given set of alternatives, and hence to make BI more actionable and understandable. The applicability of this approach is il-lustrated in a scenario adapted from literature.
Key words: Business Intelligence, Analytics, Goal-oriented
Require-ments Engineering, System Dynamics, Enterprise Modeling, Simulation
1 Introduction
Goal-oriented modeling frameworks, such asi∗[25, 27], have been introduced for modeling and analyzing the socio-technical contexts of enterprise. These frame-works can be used to model and analyze existing actors in the enterprise, their goals, dependencies, as well as internal operations. Moreover, such frameworks can capture alternative course of actions for achieving goals, express their im-pact on the strategic goals, and can support assessing whether the goals are met. Recently, the Business Intelligence Model (BIM) [4, 14, 7] extends goal modeling to incorporate business intelligence (BI) and analytics related concepts such as indicators in order to assist business users to utilize the vast amounts of data about the enterprise and its external environment. Although these frameworks represent various aspects of enterprise, they do not capture the temporal fea-tures and notions of time. In other words, these frameworks do not model the behaviour and changes of the enterprise over time.
Consider a global restaurant chain that, by using BI tools, realizes there is a declining trend in total sales in some of their market segments. In such a con-text, BIM modeling can help enterprises make sense of their data and gain a
better understanding of business operations and its environment. It conceptual-izes strategic goals (e.g., increase market share) as well as performance indicators (e.g., total sales), and provides analysts with an understanding of how well they are doing with respect to their strategic goals. However, the BIM framework does not deal with the actions that the restaurant chain may take in response to improve its situation. Moreover, the changes in indicators over time and the long term and short term impacts of those actions are not addressed. For ex-ample, to improve performance, restaurant decision makers may come up with various proposals such as introducing a new product, improving the marketing campaign, or lowering prices. In such a context, the decision makers need to examine how strongly each of the potential actions will improve the desired in-dicators over time. How much time does it take for each alternative to improve the performance indicators? What are the side effects of the actions on the other strategic goals and metrics of the company?
Today’s business environment is characterized by its dynamic nature, in-creasing uncertainties, and rapid changes. To survive and remain competitive in such a context, modern enterprises need tosense the environmental trends and
respond to them proactively. They need to adjust their internal structures and processes in response to changes in the environment [13, 21]. BI and data analyt-ics solutions play a crucial role in realizing the vision of the Sense-and-Respond enterprise [13]. These systems serve as sensing mechanism of the enterprise by assisting business users to identify business situation, monitor the strategic goals, and track performance indicators [26]. A critical challenge in these contexts is to make BI solutions actionable, i.e., to link BI-derived insights to business strate-gies and organizational processes to take the right action at the right time [17]. Insights resulting from BI and data analytics usually suggest several alternative changes within various parts of the enterprise. Business managers then face the challenge of choosing the best corrective actions.
Analyzing and making trade-offs among enterprise actions is a nontrivial task. This difficulty arises, partially, from the fact that it is very hard to under-stand how each of the potential actions would influence enterprise strategic goals over time and also how it is influenced by existing contextual factors. Towards overcoming this difficulty, modeling and analysis of dynamic behaviour of alter-native actions and their influence on enterprise performance indicators is a major step. This paper proposes a model-based approach that integrates and links the BIM modeling framework with System Dynamics [12, 22], to support decision making on alternative enterprise actions. System Dynamics is a method for mod-eling and analyzing the behaviour of complex systems over time. The proposed approach utilizes the complementary advantages of BIM and System Dynamics framework to conceptualize enterprise actions and their impact on business situ-ation over time, to facilitate decision making over BI-derived insights, and hence to make BI and analytics systems more actionable. The approach includes a set of suggestive heuristics to derive System Dynamics models from BIM models. Also, the proposed approach assists BI analysts to elicit new requirements for adapting the BI systems to the new enterprise context resulting from the change.
In previous work [18], we proposed a model-based methodology for closing the gap between what an enterprises senses from BI insights and the consequent actions and corrective changes. The second and third phases of that methodology includes generating alternative actions and selecting the most appropriate one(s). Although the models and criteria proposed in that methodology help users to analyze the alternatives, the dynamics of the indicators, the notion of time, and complexities of the context are left unconsidered. In this paper we examine how System Dynamics modeling and simulations can be used to analyze the dynamics of the enterprise and to examine how well each of the alternative corrective actions would affect the strategic goals and the situation of the enterprise. The practices that are proposed in this paper would be useful in the second and third phase of our previous methodology whose goal is to make BI system more actionable.
The rest of this paper is organized as follows. Section 2 reviews the baseline of the paper, including BIM modeling language and System Dynamics approach. Section 3 presents a case scenario to motivate the research problem. Section 4 presents the proposed approach and shows its applicability in the motivating scenario. Section 5 presents a set of suggestive heuristics for deriving System Dynamics models from BIM models. Section 6 reviews related work to this study. Section 7 concludes the paper and presents directions for future work.
2 Baseline
The baseline of this work includes the BIM modeling language and System Dy-namics modeling. Our goal is to present a systematic approach that links and synthesizes these two to facilitate decision making on the BI and analytics-driven insights, and hence to achieve actionable BI and analytics.
2.1 Business Intelligence Model (BIM)
BIM is a modeling language for representing the strategic goals of the enterprise. Aiming to bridge the gap between business-level understanding of the enterprise with its representation in databases and data warehouses for BI purposes, BIM makes use of well established business concepts to support decision making dur-ing strategic business analysis [15, 14]. The primitive BIM concepts are goals, tasks/processes, indicators, situations, and influences. This modeling language facilitates understanding of the enterprise and provides a business-friendly way to use huge amounts of enterprise data [7]. It assists enterprise users to keep track of enterprise performance and sense how well they are doing with regard to their strategic goals. References [6, 5] provide real world case studies of this modeling language.
2.2 System Dynamics
System Dynamics, initially proposed by Forrester [12] and later extended by Sterman [22] and others, is an approach for understanding and modeling the
dy-namics and behaviour of complex systems over time. The main concepts in this modeling approach are causality and feedback loop, stock or level (the accumu-lation of resources in the system), and flow or rate (dispersal of those resources). Two major modeling and representation types in System Dynamics are Causal Loop Diagrams and Stock and Flow Diagrams. While Causal Loop Diagrams allow qualitative modeling of the system variables and their causal effects, the Stock and Flow Diagrams use differential equations for quantitative modeling and simulation of the system. In this study, we illustrate how System Dynamics could be used to facilitate the connection between what an enterprise senses from BI insights to the consequent actions and corrective changes.
3 Motivating Example
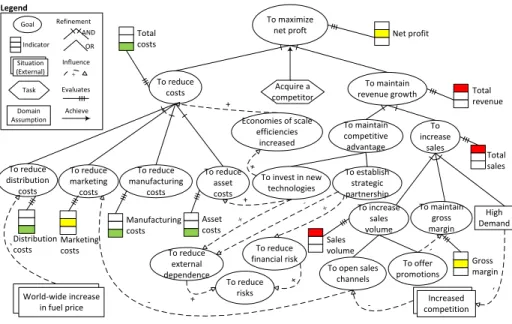
In order to motivate the research problem and to show applicability of our ap-proach, we adapt a running example from previous research [14, 7]. Using real-world reports, they created a business scenario and applied the BIM modeling and reasoning techniques on that. The example presents BestTech Inc., a generic company that manufactures and sells consumer electronics. Figure 1 is part of the BIM model for this company, representing structure of the strategic goals and their refinements along with corresponding indicators (red on top, yellow on middle, green on bottom) and current business situation. It indicates that the root strategic goal of the BestTech company is To increase shareholder value. This goal is AND-decomposed into two subgoalsTo maintain revenue growth,To reduce costs and the taskAcquire a competitor. Similarly, theTo maintain com-petitive advantagegoal is OR-decomposed into two alternative sub-goals, namely
To invest in new technologies andTo establish strategic partnership. To trace the business situation and monitor the performance, the company has defied some indicators, e.g.,Marketing costsfor the goalTo reduce marketing costs andSales volume for the goalTo increase sales volume. Moreover, the BIM model shows how the strategic goals would influence each other. For example, the goals To offer promotions has negative influences on the goalTo maintain gross margin. The model also shows that there is a domain assumption ofHigh demand, which must be true in order for the goal To increase sales to be achieved. In addi-tion, this model indicates how external situations are influencing the company’s strategic goals, e.g.,World-wide increase in fuel pricenegatively affects the goal
To reduce distribution costs.
Currently, using the BIM model in Figure 1, the company finds that it has an average performance (yellow indicator) with respect to its top goal. Moreover. the marketing department finds that theSales volumeindicator is below the defined threshold, i.e., deficient performance with regarding to the goalTo increase sales volume. In addition, the BIM model indicates that the levels ofGross marginand
Marketing costsare not satisfactory. On the other hand, theTotal costsindicator is green which means that the total level of costs is below the defined threshold. Having these signals about current business situation, BestTech executives decide to initiate some changes within the company in order to improves the sales
To maximize
net proft Net profit
To maintain revenue growth To reduce costs To increase sales To maintain competitive advantage To increase sales volume To maintain gross margin Economies of scale efficiencies increased To open sales channels To offer promotions Sales volume To establish strategic partnership To invest in new technologies + Total costs Total revenue Increased competition Gross margin High Demand -+ To reduce risks To reduce external dependence To reduce financial risk + + + + -Acquire a competitor To reduce marketing costs To reduce manufacturing costs Total sales Goal + Task Situation (External) Indicator AND OR Influence Refinement Evaluates Domain Assumption Legend Marketing costs Manufacturing costs To reduce distribution costs World-wide increase in fuel price - Distribution costs Achieve To reduce asset costs Asset costs +
Fig. 1: BIM schema for the BestTech Inc.
and revenues while keeping total costs at the satisfactory level (as it is now). They want to make the red and yellow indicators green while keeping the green indicators as they are. Towards these ends, the executives initiate brainstorming sessions and motivate the members to find a best actions that the company should take. As a result, they come up with two alternative solutions as follows: (1) Lower the price of products to increase sales and revenues, and (2) Improve product quality levels by training the production lines personnel. Each of these options are possible responses that BestTech could adopt based on what it has sensed from the BI system.
In this situation, to select the best response action(s) is not an easy task due to existing dynamics and rapid changes inside and outside of the company. There are lots of factors to be taken into account and finding the most proper alternative is a great challenge. The decision makers want to know: How and to what extent each alternative would help company to achieve the goals whose indicators are not at the satisfactory level? How fast each alternative would help the company to improve its condition? What are long term effects of each alter-native on the strategic goals? How and to what degree each alteralter-native would influence other strategic goals of the company in which they have a good perfor-mance at the current time? What are possible influences of existing contextual factors (e.g., World-wide increase in fuel prices) to each alternative? The main contribution of this paper is to link and to synthesize System Dynamics modeling with the BIM to use their complementary advantages for making connections between the sensing accomplished through BI and consequent enterprise actions.
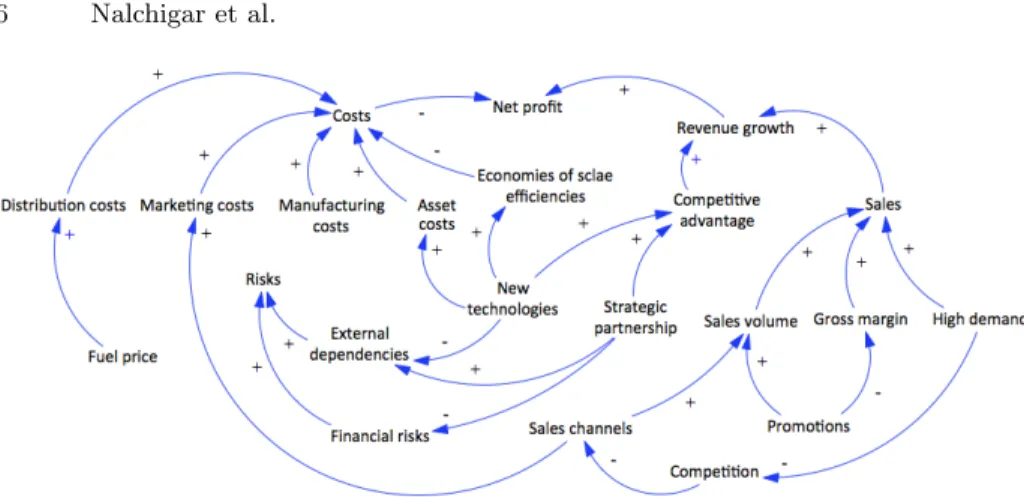
Fig. 2: Initial Causal Loop Diagram derived from the BIM schema
4 Proposed Approach
This section explains the steps and activities of the proposed approach and illustrates its application on the motivation example of previous section. The approach assumes that the enterprise analysts have constructed a BIM schema (to measure the performance indicators) and also have a set of alternative actions from which they want to choose the best one(s).
Step 1: Understanding the Decision Context.The main task in this step is to model the dynamic interactions of elements and factors within the enterprise and to formulate the cognitive model of enterprise decision makers. In other words, the main goal in this step is to represent how various enterprise related concepts and variables are interrelated. For these purposes, we use Causal Loop Diagrams. Section 5 presents a conceptual connection between the BIM framework and Causal Loop Diagrams. Proposed guides could be used in this step for constructing a skeleton of Causal Loop Diagram from the initial BIM model that was an input of the approach. After having the initial Causal Loop Diagram, analysts can add extra variables to enrich that for a better modeling of the context. In this step, the simplicity of Causal Loop diagrams will result in improved communication and comprehensiveness among decision makers.
Figure 2 shows the Causal Loop Diagram derived from the BIM schema of Figure 1. This model shows how different contextual variables and elements would interact and influence each other. For example it shows that a rise in
Competitive advantage of company will lead to higherRevenue growth and con-sequently will result in an increase toNet profit. Moreover, it shows the higher the Fuel price, the higher the Distribution costs becomes and hence the Costs
increases. Additionally, it shows changes inSales channels andPromotions will reflect in changes in the same direction toSales volume.
The main output of this step is a Causal Loop Diagram, derived from the BIM model, to represent the interactions of enterprise elements and factors within decision context.
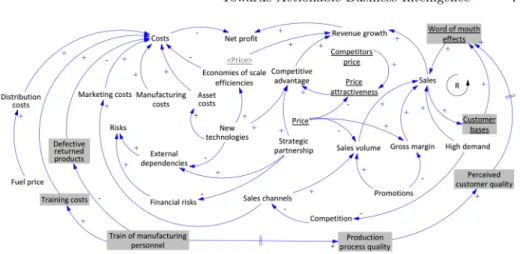
Fig. 3: Causal Loop Diagram with alternatives. Variables with underlined name and their associated links represent the first alternative. Variables with grey background represent the second alternative.
Step 2: Conceptualization of the Alternatives.The next step of our approach is to add the alternative actions as new variables to the Causal Loop Diagram, and to model the causal relationships between each alternative and the existing variables in the model. In this way, the decision makers hypothesize the influences of each alternative to the rest of variables, specially those that are related to strategic goals. In order to achieve a better modeling and under-standing of the relationship between each alternative and strategic goals of the enterprise, at this step new intervening variables are added to the model by the analyst. Intervening variables are those that moderate the relationship between each alternative and strategic variables of the enterprise. By adding them, the analyst improves the validity and certainty of these models for later analysis in the approach. It should be noted that as the enterprise adapts to the changing environment, the BI system needs to be adapted accordingly to satisfy new re-quirements of the users. The new variables that are introduced into the Causal Loop Diagram in this step can be new requirements for the BI and analytics platforms in the enterprise.
Figure 3 shows how the alternative actions of the BestTech company are rep-resented in Causal Loop Diagram in terms of new variables and influence links. Due to lack of space, both alternatives are illustrated in a single diagram. Re-garding the first alternative, the variablePrice attractiveness is affected by the variablesPrice andCompetitors price. Moreover, as thePrice of the company’s products increases, the Revenue growth and Gross margin increases, while the
Sales volume decreases. Regarding the second alternative,Train of manufactur-ing personnel will increase theTraining costs and causes a reduce in number of
Defective returned products. This variable, after a delay, will increaseProduction process quality and as a result thePerceived customer quality will be increased. An increase in Perceived customer quality, after a delay, will positively affect
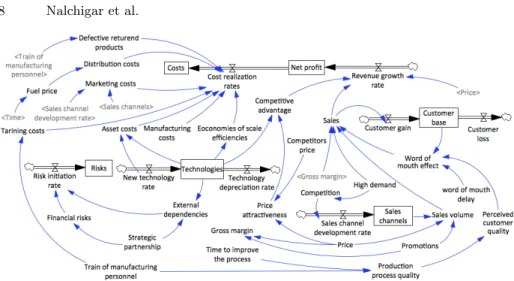
Fig. 4: Stock and Flow Diagram for BestTech Inc.
Word of mouth effects, and consequently the Sales will increase. Finally, the reinforcing loop R shows how existing customers’ word of mouth would affect the sales over time. An increase in Customer base would increase the Word of mouth effects, meaning that current customers would influence and encourage other potential customers to buy electronic products from BestTech and join the customer base. The main output of this step is two-fold. First, a Causal Loop Di-agram is created that includes the alternative actions and their influences on the enterprise variables. Second, a set of new variables is identified which represents the new requirements for the BI and analytics systems.
Step 3: Construction of Stock and Flow Diagrams.In this step, the Causal Loop Diagram generated in previous step is transformed into a Stock and Flow Diagram. Stock and Flow Diagrams are more detailed and complex than Causal Loop Diagram and enable quantitative analysis and simulation. In this step, the analyst distinguishes the Causal Loop Diagram variables into stock, flow, and auxiliary variables and also decides about the information or flow links. Moreover, the analyst can add new variables and factors to the Stock and Flow Diagram for a more detailed analysis of the system. Similar to previous step, all these new variables represent new requirements for the BI and analytics systems. Within the literature of System Dynamics, there exist some methods and rules for developing Stock and Flow Diagram from Causal Loop Diagrams. For example, Binder et al. [8] presents a systematic four steps process for trans-forming Causal Loop Diagrams to Stock and Flow Diagrams. Also, Burns [10] provides a formal description of relationships between Causal Loop Diagram and Stock and Flow Diagrams.
Figure 4 indicates the Stock and Flow Diagram created for the BestTech Inc. case study. Because of space limitations, both alternatives are represented in a single model, while all analyzes and simulations of the alternatives (in the next step) are performed separately. This model shows theRevenue growth rate
of the company, calculated fromPrice,Sales, andCompetitive advantage, is ac-cumulated in the stock of Net profit. As the company spends for various costs with the rate ofCost realization rate, those money leaves the stock ofNet profit
and flow into the stock of Costs. The model indicates as the company invests on technologies with New technology rate, the technologies are accumulated in the stock ofTechnologies. This stock influences theEconomies of scale efficien-cies and its value is reduced at the rate of Technology depreciation rate. The
Asset costs, influenced byNew technology rate and costs of maintaining current
Technologies, contributes toCost realization rate. The variablesTime to improve the process andWord of mouth delay are added to the model to quantitatively represent the time delays. Moreover, the Fuel price is considered as a function ofTime and influences theDistribution costs. The main output of this step is a Stock and Flow Diagram that could be used for simulation and analysis.
Step 4: Simulation and Analysis.The main activity in this step is to add parameters, initial values, and formulas to the Stock and Flow Diagram. The BI and analytics platforms can contribute to this step by providing many of these information, and hence by assisting the analyst to have a more valid and realistic Stock and Flow Diagram. For example, the initial level of stock variables such as Net profit, could be retrieved from BI dashboards. Moreover, at this step, existing System Dynamics validation methods could be used by the analyst to verify if the model is in line with actual enterprise behaviour. Forrester and Senge [11] present several validation tests of System Dynamics models in three categories, namely model structure, model behaviour, and policy implications. In this step, Matlab or Vensim [23] are used to simulate the business actions with differential equations. These simulations assist business users to examine the impact of the alternative actions on the strategic goals and indicators over time, and hence to facilitate business decision supports.
Figure 5 shows results of simulations of the alternatives with regarding to three strategic performance indicators, namely costs, net profit, and revenue over three months. For the sake of illustration, we have added hypothetical equations and parameters to the Stock and Flow Diagram of the previous step. While Figure 5 (a) shows the alternatives are similar in terms of Costs, Figure 5 (b) compares the alternatives with regarding to Net profit, and shows the second alternative will outperform other options. This figure indicates that during the first month, the first alternative is better due to the time delays that second alternative needs for changing the Production process quality and customer’s word of mouth. However, the second alternative will outperform starting from the second month. Figure 5 (c) shows that while all the three alternatives have increasing revenue growth, due to high demand in the market (coming from domain assumptions in BIM), the second alternative performs better than others in long term. Based on these simulations, the BestTech Inc. decides to follow the second alternative, i.e. to invest on training of manufacturing personnel to improve the quality of products.
Finally, some of the characteristics of the proposed approach are discussed. The proposed approach aims to make BI and analytics systems more actionable
(a) (b) (c)
Fig. 5: Comparison of alternatives over three months: (a) Total costs; (b) Net profit; and (c) Revenues.
by supporting users to make sense of their enterprise data and to find the best response actions for their situation. This approach utilizes the complementary advantages of the BIM framework and System Dynamics to facilitate decision making on the BI-derived insights, and to find the best corrective action among a given set of alternatives, for improving business situation and achieving strategic goals. This approach comes with a set of guides that assist users to draw a Causal Loop Diagrams from a given BIM model to facilitate faster decision making and hence enterprise adaptiveness. Finally, the approach aids BI analysts in finding new requirements for the BI system to adapt them to the changing enterprise context.
5 From BIM to Causal Loop Diagram
In this section, we propose a set of general guides for developing Causal Loop Diagrams from BIM models. These guides are useful in the first step of the pro-posed approach (See Section 4) and can assist users to draw a skeleton of a Causal Loop Diagram from a BIM model. It should be emphasized that BIM models and Causal Loop Diagrams express and convey different aspects and elements of the system under consideration and there could not be a mechanistic and automated transformation between them. While the BIM framework represents the intentional aspects of the enterprise, Causal Loop Diagrams represent the enterprise in terms of variables and their interrelated changes over time. Due to inherent differences in purpose and semantics of modeling constructs, we advo-cate a series of guides and suggestions rather a formalized procedure to convert BIM models to Causal Loop Diagrams. It should be mentioned that developing Causal Loop Diagrams is a context-dependent task which requires understand-ing and knowledge about the domain. Usunderstand-ing the proposed guides would result in an initial skeleton of a Causal Loop Diagram which needs to be further enriched by adding additional variables and links.
Goals: In the BIM framework, goals represent intentional desires towards important contextual concepts in the enterprise. Hence, a goal in the BIM model suggests that there is a corresponding variable in the Causal Loop Diagram. The variable could be extracted from the name of the goal or the indicator connected to it. For example the goalTo increase salesin the BIM model suggests a variable such asSales in the Causal Loop Diagram. It should be noted that not all goals in the BIM model need to become a variable in the Causal Loop Diagram. Also, there could be variables in the Causal Loop Diagram that are not goals in the BIM.
Decomposition links:Goals can be decomposed into and pursued through sub-goals. When a goal is decomposed into its sub-goals in a BIM model, it is likely that there is a causal link between their corresponding variables in the Causal Loop Diagram. We suggest that the “AND-decomposition” and “OR-decomposition” links between goals in a BIM model can be shown as positive links between corresponding variables in the Causal Loop Diagram. For an ex-ample, see the decomposition link between the goalsTo maintain revenue growth
andTo increase sales in Figure 1 and its corresponding causal link in Figure 2. Influence links:An influence link between two elements in a BIM model represents a relationship between them in a probabilistic or causal sense [4]. This suggests that there is a causal link between corresponding elements in the Causal Loop Diagram. The polarity of the link in the Causal Loop Diagram could be same as the sign of the influence link in BIM model, unless in cases where one side of the influence link in the BIM model is a goal that refers to lowering the value or level of a variable. In such cases the sign should be reversed. For example, in the BIM model of Figure 1, the goalEconomies of scale efficiencies increased has a positive influence on the goal To reduce costs. In the Causal Loop Diagram of Figure 2, that influence link is represented as a negative causal link between variablesEconomies of scale efficiencies andCosts.
Situations:The situations are partial state of the world and represent the internal and external factors that influence achievement of strategic goals [14, 4]. A situation in BIM model could be represented as a variable in Causal Loop Diagram. For example the situationWord-wide increase of fuel pricein the BIM model of Figure 1 is represented as the Fuel price variable in the Causal Loop Diagram of Figure 2.
Domain Assumptions: In the BIM framework, assumptions are propo-sitions assumed to be true for purposes of achievement of a goal [4]. These assumptions are about concepts related to the domain and can be represented as a variable in the Causal Loop Diagram. This variable will be constant during the simulation analyzes.
These proposed guides were used in Section 4 to arrive at a Causal Loop Diagram from the BIM schema of the motivating example. These guides are, indeed, a series of heuristic connections and correspondences between the BIM schema and Causal Loop Diagram. The enterprise analyst can use them to con-struct a skeleton of a Causal Loop Diagram from a given BIM model, but it would typically need to be enriched with additional variables, links, and delays.
Some of these additional variables and links are indeed new requirements for the BI platform. By making connection between BIM and Causal Loop Diagram, this approach helps BI analysts to elicit new requirements of the BI system and to adapt it to the changing business environment. The suggested guides could be used as a connection between BI systems and System Dynamics models to enable feeding data from a BI platform to the System Dynamics modeling and simulations tools. This will allow BI platforms and System Dynamics modeling to complement each other and assists enterprises to take advantage of this. For the BI side, the System Dynamics models can offer various “what-if” analyses to better serve users’ needs. For the System Dynamics side, the BI could offer realistic data to test, validate, and improve the model structures.
6 Related Work
This section reviews related work in three categories.
System Dynamics for Managerial Decision Making. System Dynam-ics practices have been widely used in managerial decision support. An et al. [1] illustrated how System Dynamics could be used to model and understand the dynamic behaviours of performance indicators in the adaptive enterprise. They introduced optimization elements into the formalism of System Dynamics and embedded it in a technical Sense-and-Respond supply chain architecture. Schoeneborn [20] linked the Balanced Scorecard (BSC) to System Dynamics modeling and showed how it could be used to perform extensive analysis of strategic measures using simulations on a hypothetical example. He argued that BSC considers only simple cause and effect relationships between measures and it leaves the time delays unconsidered. Similarly, Nielsen and Nielsen [19] used Sys-tem Dynamics modeling to develop time and dynamics dimension into BSC and to examine the effects of skills, customers, and work in process variables on the return on capital employed. Yim et al. [24] used System Dynamics to propose a knowledge-based decision making method for supporting strategic planning and high-level decision making in the enterprise. Our approach is different from these works in that it uses System Dynamics to provide decision support on the BI and analytics driven insights, and hence to facilitate closing the gap between what an enterprise senses from BI insights to its response actions.
Reasoning on BIM Models. The BIM modeling language comes with a set of reasoning techniques to support analysis and answering strategic questions. While the forward/bottom-up reasoning techniques evaluate the impact of dif-ferent alternative goals on the top goal, the backward/top-down reasoning tech-niques find a set of goals with minimum costs to be satisfied in order to guarantee achievement of a given top goal [4]. Barone et al. [2] proposed three techniques for deriving values of composite indicators from values of their component using conversion factor, range normalization, and qualitative reasoning. Later, they implemented an Eclipse-based prototype tool supporting these techniques [3]. Horkoff et al. [15] provided a formal semantics of BIM concepts in descrip-tion logics and used that semantics for supporting “what-if” analyses over BIM
models. Reference [14] presents a hybrid reasoning technique which supports reasoning with incomplete indicators. While these techniques facilitate strategic decision making, they do not support decision making on enterprise actions and corrective changes. Moreover, they do not consider the time dimension. Our ap-proach connects the BIM framework to System Dynamics modeling to facilitate decision making on alternative actions resulted from BI insights and to support elicitation of new requirements for the BI system.
Adaptive Enterprise Architecture.In 1995, Stephan Haeckel defined the no-tion of adaptive enterprise and described a transformano-tion model from a Make-and-Sell enterprise to a Sense-and-Respond enterprise [13]. Motivated by his work, Buckley et al. [9] and Kapoor et al. [16] proposed technical frameworks for implementing Sense-and-Respond business performance management. Yu et al. [26] presented some research challenges and directions for adaptive enterprise architecture and highlighted the need for a systematic framework that supports modeling, analyzing, and designing adaptive enterprise. In another study, Yu et al. [28] examined capabilities of two existing requirements modeling tech-niques, namely goal-based social modeling (i∗) and process modeling, in captur-ing the dynamics and changes of application settcaptur-ings, found their inadequacies and modeling challenges, and finally outlined a set of desired features for a new comprehensive modeling framework. This work continues this line of research by integrating two existing modeling frameworks in a systematic way for facilitating decision making on response actions in adaptive enterprise.
7 Conclusion and Future Work
BI and analytics systems play a critical role in modern enterprises by providing insights about business progress towards strategic goals, internal operations, as well as external environment. BI-driven insights often suggest alternative correc-tive actions and changes within various parts of the enterprise. To trade-off and choose the most proper action(s) is a challenging task due to enterprise dynamics and complexities. This paper linked and synthesized the BIM modeling language with System Dynamics modeling and proposed a systematic approach for deci-sion making on BI-driven insights. The results indicate that System Dynamics modeling offers a range of potential benefits and contribution to making BI sys-tems more actionable that are currently not well catered for by existing tools and platforms. Evidently, the proposed approach needs to be evaluated in real-world case studies. Moreover, using System Dynamics requires the analyst to add new assumptions about the context (e.g., parameters, initial values, formulas) into the analysis. Finding appropriate mathematical equations of quantitative behaviour of the enterprise is not an easy task. BI can alleviate this challenge by providing real data of the variables to make it more realistic and valid.
This paper is part of a broader research agenda whose goal is to propose an enterprise architecture framework for adaptive enterprises. In future, we plan to extend the existing System Dynamic models by adding social modeling ele-ments, such as actors fromi∗ modeling framework, and to investigate how these
frameworks could complement each other for supporting enterprise adaptiveness. Currently, we are investigating conceptual connections and compliances between the goal-oriented frameworks and Stock and Flow Diagrams. Moreover, we are developing a new modeling language to be used for requirements engineering of data mining and business intelligence projects. This modeling language will sup-port organizational use of data mining and analytics tools, connects the insights to enterprise actions, and hence facilitates closing the Sense-and-Respond loops in adaptive enterprise.
References
1. Lianjun An, JJ Jeng, Markus Ettl, and J-Y Chung. A system dynamics frame-work for sense-and-respond systems. In E-Commerce Technology for Dynamic
E-Business, 2004. IEEE International Conference on, pages 6–13. IEEE, 2004.
2. Daniele Barone, Lei Jiang, Daniel Amyot, and John Mylopoulos. Composite indi-cators for business intelligence. InConceptual Modeling–ER 2011, pages 448–458. Springer, 2011.
3. Daniele Barone, Lei Jiang, Daniel Amyot, and John Mylopoulos. Reasoning with key performance indicators. In Paul Johannesson, John Krogstie, and AndreasL. Opdahl, editors,The Practice of Enterprise Modeling, volume 92 ofLecture Notes
in Business Information Processing, pages 82–96. Springer Berlin Heidelberg, 2011.
4. Daniele Barone, John Mylopoulos, Lei Jiang, and Daniel Amyot. The business intelligence model: Strategic modelling. Technical report, University of Toronto, April 2010.
5. Daniele Barone, Liam Peyton, Flavio Rizzolo, Daniel Amyot, and John Mylopou-los. Towards model-based support for managing organizational transformation. In Gilbert Babin, Katarina Stanoevska-Slabeva, and Peter Kropf, editors,
E-Technologies: Transformation in a Connected World, volume 78 ofLecture Notes in
Business Information Processing, pages 17–31. Springer Berlin Heidelberg, 2011.
6. Daniele Barone, Thodoros Topaloglou, and John Mylopoulos. Business intelligence modeling in action: a hospital case study. InAdvanced Information Systems
Engi-neering, pages 502–517. Springer, 2012.
7. Daniele Barone, Eric Yu, Jihyun Won, Lei Jiang, and John Mylopoulos. Enterprise modeling for business intelligence. In Patrick Bommel, Stijn Hoppenbrouwers, Si-etse Overbeek, Erik Proper, and Joseph Barjis, editors,The Practice of Enterprise
Modeling, volume 68 ofLecture Notes in Business Information Processing, pages
31–45. Springer Berlin Heidelberg, 2010.
8. T. Binder, A. Vox, S. Belyazid, H. Haraldsson, and M. Svensson. Developing system dynamics models from causal loop diagrams. 2004. Proceedings of the 22nd International Conference of the System Dynamics Society. Oxford, Great Britain, July 25–29, 2004.
9. Steve Buckley, Markus Ettl, Grace Lin, and Ko-Yang Wang. Sense and respond business performance management. In Chae An and Hansjrg Fromm, editors,
Supply Chain Management on Demand, pages 287–311. Springer Berlin Heidelberg,
2005.
10. James R Burns. Simplified translation of CLDs into SFDs. InProceedings of the 19. International Conference of the System Dynamics Society, Atlanta, GA, July 2001, 2001.
11. Jay W. Forrester and Peter M. Senge. Tests for building confidence in system dyamics models. TIMS Studies in the Management Sciences, 14:209–228, 1980. 12. Jay Wright Forrester.Industrial dynamics, volume 2. MIT press Cambridge, MA,
1961.
13. Stephen H Haeckel. Adaptive enterprise design: the sense-and-respond model.
Strategy & Leadership, 23(3):6–42, 1995.
14. Jennifer Horkoff, Daniele Barone, Lei Jiang, Eric Yu, Daniel Amyot, Alex Borgida, and John Mylopoulos. Strategic business modeling: representation and reasoning.
Software & Systems Modeling, pages 1–27, 2012.
15. Jennifer Horkoff, Alex Borgida, John Mylopoulos, Daniele Barone, Lei Jiang, Eric Yu, and Daniel Amyot. Making data meaningful: The business intelligence model and its formal semantics in description logics. In On the Move to Meaningful
Internet Systems: OTM 2012, pages 700–717. Springer, 2012.
16. S Kapoor, K Bhattacharya, S Buckley, P Chowdhary, M Ettl, K Katircioglu, E Mauch, and L Phillips. A technical framework for sense-and-respond business management. IBM Systems Journal, 44(1):5–24, 2005.
17. Steve LaValle, Michael Hopkins, Eric Lesser, Rebecca Shockley, and Nina Kr-uschwitz. Analytics: The new path to value. How the smartest organizations are embedding analytics to transform insights into action. MIT Sloan Management
Review, 2010.
18. Soroosh Nalchigar and Eric Yu. From Business Intelligence Insights to Actions: A Methodology for Closing the Sense-and-Respond Loop in the Adaptive Enterprise. In Janis Grabis, Marite Kirikova, Jelena Zdravkovic, and Janis Stirna, editors,
The Practice of Enterprise Modeling, volume 165 of Lecture Notes in Business
Information Processing, pages 114–128. Springer Berlin Heidelberg, 2013.
19. Steen Nielsen and Erland H Nielsen. System dynamics modelling for a balanced scorecard: Computing the influence of skills, customers, and work in process on the return on capital employed. Management Research News, 31(3):169–188, 2008. 20. Frank Schoeneborn. Linking balanced scorecard to system dynamics. In
Preceed-ings of the 21st System Dynamics Conference, 2003.
21. Bohdana Sherehiy, Waldemar Karwowski, and John K Layer. A Review of En-terprise Agility: Concepts, Frameworks, and Attributes. International Journal of
Industrial Ergonomics, 37(5):445–460, 2007.
22. John Sterman. Business dynamics. Irwin-McGraw-Hill, 2000. 23. Vensim, November 2013. http://www.vensim.com.
24. Nam-Hong Yim, Soung-Hie Kim, Hee-Woong Kim, and Kee-Young Kwahk. Knowl-edge based decision making on higher level strategic concerns: system dynamics approach. Expert Systems with Applications, 27(1):143–158, 2004.
25. Eric Yu. Modelling strategic relationships for process reengineering. PhD thesis, Toronto, Ont., Canada, 1995.
26. Eric Yu, Stephanie Deng, and Divyajyoti Sasmal. Enterprise architecture for the adaptive enterprise–a vision paper. InTrends in Enterprise Architecture
Re-search and Practice-Driven ReRe-search on Enterprise Transformation, pages 146–
161. Springer, 2012.
27. Eric Yu, Paolo Giorgini, Neil Maiden, and John Mylopoulos. Social modeling for
requirements engineering. MIT Press, 2011.
28. Eric Yu, Alexei Lapouchnian, and Stephanie Deng. Adapting to uncertain and evolving enterprise requirements: The case of business-driven business intelligence.
InResearch Challenges in Information Science (RCIS), 2013 IEEE Seventh