Eastern Illinois University
The Keep
Masters Theses
Student Theses & Publications
2017
Export-Oriented Entrepreneurship Intensity and
Economic Growth in Developing and Developed
Countries
Xueting Sun
Eastern Illinois University
This research is a product of the graduate program inEconomicsat Eastern Illinois University.Find out more about the program.
This is brought to you for free and open access by the Student Theses & Publications at The Keep. It has been accepted for inclusion in Masters Theses by an authorized administrator of The Keep. For more information, please [email protected].
Recommended Citation
Sun, Xueting, "Export-Oriented Entrepreneurship Intensity and Economic Growth in Developing and Developed Countries" (2017). Masters Theses. 2689.
The Graduate
School�
EAS'"fEl\N ILLINOIS UNIVERSITY Thesis Maintenance and Reproduction Certificate
FOR: Graduate Candidates Completing Theses in Partial Fulfillment of the Degree Graduate Faculty Advisors Directing the Theses
RE: Preservation, Reproduction, and Distribution of Thesis Research
Preserving, reproducing, and distributing thesis research is an important part of Booth Library's responsibility to provide access to scholarship. In order to further this goal, Booth Library makes all graduate theses completed as part of a degree program at Eastern Illinois University available for personal study, research, and other not-for-profit educational purposes. Under 17 U.S.C. § 108, the library may reproduce and distribute a copy without infringing on copyright; however, professional courtesy dictates that permission be requested from the author before doing so.
Your signatures affirm the following:
• The graduate candidate is the author of this thesis.
• The graduate candidate retains the copyright and intellectual property rights associated with the
original research, creative activity, and intellectual or artistic content of the thesis.
• The graduate candidate certifies her/his compliance with federal copyright law (Title 17 of the U. S. Code) and her/his right to authorize reproduction and distribution of all copyrighted materials included in this thesis.
• The graduate candidate in consultation with the faculty advisor grants Booth Library the non exclusive, perpetual right to make copies of the thesis freely and publicly available without restriction, by means of any current or successive technology, including by not limited to photocopying, microfilm, digitization, or internet.
• The graduate candidate acknowledges that by depositing her/his thesis with Booth Library, her/his work is available for viewing by the public and may be borrowed through the library's circulation and interlibrary loan departments, or accessed electronically.
• The graduate candidate waives the confidentiality provisions of the Family Educational Rights and Privacy Act (FERP A) (20 U. S. C. § 1232g; 34 CFR Part 99) with respect to the contents of the thesis and with respect to information concerning authorship of the thesis, including name and status as a student at Eastern Illinois University.
I have conferred with my graduate faculty advisor. My signature below indicates that I have read and agree with the above statements, and hereby give my permission to allow Booth Library to reproduce and distribute my thesis. My adviser's signature indicates concurrence to reproduce and distribute the thesis.
Graduate Candiaate Signature Faculty A
d
visJI'
Signalll
rJ
x�t1(\�
�\kn
Printed Name
fV\_o...ftfvr"
cl
�
/±rts,
tnfu
>10fntc_�Export-oriented Entrepreneurship Intensity and Economic Growth in Developing and Developed Countries
(TITLE)
BY
Xueting Sun
THESIS
SUBMITTED IN PARTIAL FULFILLMENT OF THE REQUIREMENTS FOR THE DEGREE OF
Master of Arts in Economics
IN THE GRADUATE SCHOOL, EASTERN ILLINOIS UNIVERSITY CHARLESTON, ILLINOIS
2017
YEAR
I HEREBY RECOMMEND THAT THIS THESIS BE ACCEPTED AS FULFILLING THIS PART OF THE GRADUATE DEGREE CITED ABOVE
f
_.!:J-S-17
THESIS COMMITTEE CHAIR DATE
THFSIS r.OMMITTFF MFMRFR DATE
6-5"-17
THESIS COMMITIEE MJ2MBER DATE
DEPARTMENT/SCHO�AIR
OR CHAIR'S �IGNEE
THESIS COMMITTEE MEMBER
THESIS COMMITTEE MEMBER
DATE
DATE
Export-oriented Entrepreneurship Intensity and Economic Growth
in Developing and Developed Countries
Xueting Sun
Dep.artment of Economics
Eastern Illinois University
2017
Thesis Committee:
Dr. Mukti P Upadhyay (Chair) Dr. Ahmed S Abou-Zaid
'
J
...
..
Copyright © 20 1 7 by Xueting Sun All rights reserved
Abstract
This paper analyzes the impact of export-oriented entrepreneurship intensity on national economic growth using data for 64 countries over the 2006-20 1 3 period. We draw on entrepreneurship, entrepreneurship and economic growth, export-oriented
entrepreneurship and economic growth, and export intensity of entrepreneurship and economic growth theories to affirm that export-oriented entrepreneurship and export oriented entrepreneurship intensity is profound for the national economic growth of countries.
The findings suggest that greater total entrepreneurial activity (TEA) is associated with a higher rate of economic growth in developed countries but not in developing countries. Also, greater export-oriented entrepreneurial activity (EEA) is associated with a higher rate of economic growth in both developing and developed countries. This paper classifies entrepreneurial activity into low, medium, and high levels of export orientation, produces evidence of differential growth impact between developing and developed countries. A rise in entrepreneurial activity with the low orientation group, for instance, raises growth in developing countries, but not in developed countries. In the case of medium export orientation, however, greater entrepreneurship is associated with higher growth in both developing and developed countries.
However, the high level of total early-stage export-oriented entrepreneurial activity (E _high) is not associated with a higher rate of economic growth. In developing countries, when E _high is greater than 9%, the percentage of all the TEA business entities in the E _high group has a significantly negative impact on economic growth. In
developed countries, in contrast, when E _High is greater than 8%, the TEA business entities with a high level of EEA has a positive impact on economic growth.
Key words: Export, Entrepreneurship Intensity, economic growth, developing countries,
Acknowledgements
I would like to take this opportunity to thank
My thesis chair Dr. Mukti P Upadhyay for his constant support and immense guidance during the thesis process. I could not have come this far without his understanding and effort.
My thesis committee members Dr. Ahmed S Abou-Zaid and Dr. Ali Moshtagh for their encouragement and support during this process as well as for their valuable feedback.
My mother Ying Cao and father Chengjian Sun for supporting me unconditionally in every possible way at all stages of my journey.
Table of Contents
Chapter 1 INTRODUCTION ... 1
Chapter 2 LITERATURE REVIEW ... 4
2. 1 Entrepreneurship ... 4
2.2 Entrepreneurship and Economic growth ... 5
2.3 Export-oriented Entrepreneurship and Economic growth ... 9
2.4 Export Intensity of Entrepreneurship and Economic Growth ... 1 1 Chapter 3 METHODOLOGY ... 1 3 3.1 Framework ... 1 3 3.1.1 Entrepreneurship and Economic growth ... 1 4 3 . 1 .2 Export-oriented Entrepreneurship and Economic growth ... 1 6 3 . 1 .3 Export Intensity of Entrepreneurship and Economic Growth ... 1 6 3 .2 Data and Sample ... 1 8 3 .2.1 Descriptive statistics ... 2 1 Chapter 4 RESULTS ... 25
4. 1 Entrepreneurship and Economic growth ... 25
4.2 Export-oriented Entrepreneurship and Economic growth ... 26
4.3 Export Intensity of Entrepreneurship and Economic Growth ... 27
Chapter 5 CONCLUSION AND DISCUSSION ... 33
5.1 Main Findings ... 33
5.2 Policy implications ... 3 4 5.3 Limitations and future research ... 34
References ... . . ... 3 6 Appendix ... . . ... 42
List of Tables
Table 1 List of Countries . . . .1 9
Table 2 Definition of variables and sources of data . . . 20
Table 3 Descriptive statistics . . . 22
Table 4 D eveloped countries correlation matrix (N=228) . . . 23
Table 5 Developing countries correlation matrix (N= 1 42) . . . 24
Table 6 The effect of entrepreneurship variables on economic growth: Developed Countries . . . 29
Table 7 The effect of entrepreneurship variables on economic growth: Developing Countries . . . 30
Table 8 The effect of percentage of business entities with E _High on economic growth: Developing Countries . . . 3 1 Table 9 The effect of percentage of business entities with E _High on economic growth: Developed Countries . . . 32
Chapter 1
INTRODUCTION
In recent decades, entrepreneurship has been recognized as a profound factor in affecting economic growth. Among others, Many scholars (Braunerhj elm, Acs, Audretsch, & Carlsson, 20 1 0; Toma, Grigore, & Marinescu 20 1 4; Kritikos, 20 1 4) have devoted
considerable attention to the relationship between entrepreneurship and economic growth in general, while other scholars (Almeida Couto, Borges Tiagio, Vieira, & Fortuna, 2006; Lages & Montgomery, 2004; Zahra, Sapienza, & Davidsson, 2006) have described and examined the relationship between export-oriented entrepreneurship and economic growth. The topic of export intensity of entrepreneurship and economic growth has been increasingly discussed in scholarly research (Bilkey & Tesar, 1 977; Gonzalez-Pemia & Pena-Legazkue, 20 1 5 ; Fryges & Wagner, 2008).
Hessels and van Stel (2009) explore the connection between a nation's pervasiveness of export-related new ventures and the economic development rate by using data from 36 countries in 2002. The outcomes propose that a nation's predominance of export-driven new ventures is significantly and positively related to economic
development (Hessels & van Stel, 2009). Hessels and van Stel (20 1 1 ) also studied the connection between a country' s prevalence of entrepreneurship and its economic growth rate. Hessels and van Stel (20 1 1 ) concentrated on the national level and used a specimen of 3 4 countries during the period of 2002-2008 . Their outcomes show a positive relation between entrepreneurial activity and growth rate of an economy. An extra beneficial outcome of export related early-stage entrepreneurship is also observed in higher-income
countries, but there is no such impact in lower-income countries (Hessels & van Stel, 20 1 1 ).
Pen a-Legazkue and Gonza'mezerein' (20 1 5) examine the influence of export oriented entrepreneurship on regional economic growth in 1 7 Spanish regions throughout the period of 2003-20 1 3 . Pen-a-Legazkue and Gonza'lez-Pem1' (20 1 5) find that Spanish regions with a large amount of opportunity-driven entrepreneurial activity display higher rates of economic growth. Also, areas with a higher rate of the adult population occupied with export-oriented entrepreneurial activity demonstrate higher Gross Domestic Product (GDP) growth rates (Gonzalez-Pemia & Pena-Legazkue, 20 1 5). This impact too seems to be powerful as the intensity of export-related entrepreneurial activities expands up to the threshold level (Gonzalez-Pemia & Pena-Legazkue, 201 5).
But, in light of the dynamic qualities of entrepreneurship intensity and economic growth, there remains a need for additional review and bringing together of research on export-oriented entrepreneurship intensity and economic growth. This paper conducts a regression analysis using data on 64 developing and developed countries over a period of 2006 -20 1 3 . It examines the effect of export-oriented entrepreneurship on economic growth. Also, this paper adds to the extant literature on entrepreneurship by further analyzing the intensity degrees of export-oriented entrepreneurial activity on national economic growth with a focus on developing and developed countries and a longer period of time. To my best knowledge, no previous studies have analyzed the economic impact of export-oriented entrepreneurship intensity at a national level with such a large data sample of 64 countries (36 developed and 28 developing countries) . The present study contributes to the extant literature by analyzing this issue at a national level with a
larger sample and longer period. Also, no previous studies analyze the threshold of the percentage of all the total early-stage entrepreneurial activity (TEA) business entities with a high level of total early-stage export-oriented entrepreneurial activity in detail for both developing and developed countries.
This paper begins by reviewing the literature on entrepreneurship,
entrepreneurship and economic growth, export-oriented entrepreneurship and economic growth, and export intensity of entrepreneurship and economic growth. The literature review leads to the development of four propositions to examine whether narrower or broader definitions of entrepreneurial activity would be most relevant for growth. Research design adopted in this paper is strengthened by the inclusion of several variables that are found in the literature to be good controls in a study of growth. The main results of this thesis support the hypothesis that entrepreneurial activity is positively associated with growth in developed countries but not in less developed countries. The findings also indicate that entrepreneurial activity that is highly oriented toward domestic rather than export markets hurts growth in both higher and lower income countries.
Following introduction, a review of the literature leading to the propositions is presented in section two. The subsequent section develops empirical framework and provides details of the data. Next, in section four, the results of empirical analysis are presented and discussed. Finally, in section five, conclusions and implications of the results are discussed.
Chapter 2
LITERATURE REVIEW 2.1 Entrepreneurship
Entrepreneurship is an internationally perceived concept without a general definition. Entrepreneurship means "the processes of starting and continuing to expand new businesses" (Hart, 2003 , p. 5). Global Entrepreneurship Monitor (GEM) defines entrepreneurship as "any attempt at new business or new venture creation, such as self employment, a new business organization, or the expansion of an existing business, by an individual, a team of individuals, or an established business" (GEM, 20 1 7). There are five dimensions of an entrepreneurial orientation: autonomy, innovativeness, risk taking, proactiveness, and competitive aggressiveness (Lumpkin & Dess, 1 996). Schumpeter ( 1 934) states that entrepreneurship creates value by creating new combinations. Martin, Picazo, and Navarro (20 1 0) suggest that entrepreneurship has the following
characteristics: ( 1 ) entrepreneurship does not mean an occupation but a movement that considers the diverse conditions and aspects of the people; (2) Entrepreneurships have to think about instability and a few obstacles that are inherent in the creation process; (3) They should have data or thought regarding the effective creation forms, and additionally new structures. They must have the idea and they can ask information or advice to experts to create the firm; and (4) Entrepreneurs can be additionally experienced in big
companies.
Hebert and Link (1 989), following the ideas contributed by several generations of scholars, define entrepreneur as "someone who specializes in taking responsibility for
and making judgmental decisions that affect the location, the form, and the use of goods, resources, or institutions" (Hebert & Link, 1 989, p. 3 9). Hebert and Link ( 1 989) identify twelve different topics on entrepreneur in the economic literature: the entrepreneur is the person who assumes the risk associated with uncertainty, supplies financial capital, innovator, decision maker, industrial leader, a manger or superintendent, an organizer and coordinator of economic resources, the owner of an enterprise, an employer of factors of production, a contractor, an arbitrageur, and an allocator of resources among alternative
uses.
2.2 Entrepreneurship and Economic growth
The connection between entrepreneurship and economic development has been drawn closer mainly from an economic outlook, both theoretically and empirically,
concentrating on economic growth instead of on development (Rocha, 2004). Rocha (2004) discussed entrepreneurship and development from both theoretical and empirical standpoints. From the theoretical outlook, Gonzalez-Pernia and Pena-Legazkue (20 1 5) point out that knowledge spillover theory of entrepreneurship associated with other authors (e.g. Acs, Braunerhjelm, Audretsch, & Carlsson, 2009; Agarwal, Audretsch, & Sarkar, 2007; Braunerhjelm, Acs, Audretsch, & Carlsson, 20 1 0) considers that economic growth does not come about exclusively from increments in labor or capital, as
recommended by neoclassical growth models (Solow, 1 956), nor does it come naturally from investment in knowledge activities, as proposed by endogenous growth models (Romer, 1 986). As indicated by them, entrepreneurship -as an instrument of knowledge spillover-constitutes a critical missing connection between general knowledge and economic knowledge that has been disregarded in conventional development models
(Gonzalez-Pemia et al. 201 5). Reynolds, Hay, and Camp ( 1 999) explicitly included entrepreneurship in a formal model to describe economic growth in the GEM model (Rocha, 2004) . Toma, Grigore, and Marinescu (20 1 4) give a theoretical model that highlights a portion of the primary elements involved in the connection between entrepreneurship and economic development.
Entrepreneurship helps economic growth by presenting innovative technologies, products, and services (Kritikos, 20 1 4) . Also, entrepreneurial activities increase the competition and productivity among industries (Callej6n & Segarra, 1 999; Kritikos, 20 1 4). In addition, entrepreneurial activities create new j ob opportunities as well as skilled jobs (Van Stel & Storey, 2004; Kritikos, 20 1 4) . Moreover, entrepreneurs quicken structural change by replacing established, sclerotic companies and creating new
combinations (Kritikos, 20 1 4).
From the empirical point of view, the connection between entrepreneurship and economic growth has been investigated and shown since the spearheading work of Birch (Rocha, 2004) . Birch went through a longitudinal examination and displayed that small and medium-sized enterprises were the primary source of employment creation in the U.S. (Birch, 1 98 1 ; Rocha, 2004). As oflate, this drive was followed by policy makers and scholars on entrepreneurship to economic growth (Acs, 2006; Malchow-M0ller, Schj eming, & S0rensen, 20 1 1 ). Casson and Wadeson (2007) examined the part of entrepreneurs in forming markets for novel products.
Longitudinal researches are the most profound ones in the investigation of
entrepreneurship development relationship because of the time lag between the formation of new ventures and the variety in rates of economic growth and development (Rocha,
2004) . Audretsch and Fritsch (2002) used data of 74 areas in West Germany over a two decade time frame to investigate whether regional economic development policy ought to be focused towards new businesses or nurturing large, incumbent enterprises. They conclude that different growth regimes exist crosswise over both time and space (Audretsch & Fritsch, 2002) .
Contribution of entrepreneurship to economic growth is highly varied across nations with various degrees of economic improvement because of the distinctions in attributes of the macroeconomic condition, presence of various entrepreneurial structures et cetera (Lepojevie, Dukie, and Mladenovie, 20 1 6) . Lepojevie, Dukie, and Mladenovie (20 1 6) look at the effect of various sorts of entrepreneurship, such as high-expectations entrepreneurship (HEA), opportunity-based entrepreneurship (OEA), and necessity-based entrepreneurship (NEA) on economic development by using the comparative analysis of 22 developing and developed nations over three years. The point of their research is to explore the distinctions in economic impacts of entrepreneurship in light of opportunity and entrepreneurship in view of necessity. The outcomes displayed that the
entrepreneurship contribution to economic improvement is higher in developed countries than in developing countries. The explanation is that the mastery of HEA and OEA entrepreneurship whose significance for GDP growth is higher in connection to the significance of NEA, which is dominant in developing countries (Lepojevie, Dukie, and Mladenovie, 20 1 6).
Valliere and Peterson (2009) introduce an augmentation to the economic development model by Wong, Ho, & Autio (2005) to reflect contrasts in the economic impacts of opportunity- and necessity-based entrepreneurship in both developed and
emerging countries by using data from 44 nations for the years 2004 and 2005 . Data gathered by Global Entrepreneurship Monitor (GEM) research and Global
Competitiveness Report (GCR) research are utilized to identify indicators of GDP growth for developed and emerging countries. This study argues that a critical segment of
economic growth rates can be attributed to high-expectation entrepreneurs using national investments on knowledge creation and administrative flexibility. Nonetheless, this impact is absent in emerging countries (Valliere & Peterson, 2009) .
Productive entrepreneurship is by and large thought to be conducive to economic development through new business openings and creation of new occupations (Zaki & Rashid, 20 1 6). Today, emerging countries are beginning to coordinate their strategies towards empowering entrepreneurship (Zaki & Rashid, 20 1 6) . In addition, a great number of studies have centered on entrepreneurship as a vehicle for development (Zaki & Rashid, 20 1 6). Zaki and Rashid (20 1 6) explore the effect of entrepreneurship on economic development in seven developing countries. The results exhibit a significant negative connection between entrepreneurship and economic development. This result indicates the significance of the role of other variables. For example, they consider institutional systems and putting resources into "new economy" areas, in influencing this relationship.
The expanding support for the positive association between entrepreneurship and economic growth appears to lessen the significance of some negative effects ascribed to entrepreneurship; for example, entrepreneurship could not flourish in an overregulated economy (Kritikos, 20 1 4), and entrepreneurship may disrupt research proj ects, thus decreasing the incentive for companies to put resources into human capital (Florida and
-Keeney, 1 990) . However, given the significance of entrepreneurship in changing the financial and social structure of the economy, the entrepreneurship field would benefit from more studies on the effect of entrepreneurship on development (Rocha, 2004) .
The examination of previous studies and entrepreneurship and economic growth literature shows the important influence of entrepreneurial activity to economic growth and leads us to make the following proposition.
Proposition 1: Greater entrepreneurial activity is associated with a higher rate of
economic growth, in both developing and developed countries.
2.3 Export-oriented Entrepreneurship and Economic growth
Exporting as a type of internationalization, including a procedure of adapting to and gaining from new markets, is important for the economic development of countries and regions ( Girma, Greenaway, & Kneller, 2004; Lages & Montgomery, 2004; Zahra, S apienza, & Davidsson, 2006) . Exports have positive influence on the development of national businesses, improvement of productivity, and creation of j obs (Hessels & van Stel, 2 0 1 1 ). Besides, exporting companies perform superior to non-exporting firms in terms of exporting companies having a tendency to be more productive, more creative, more capital intensive, and more effective (Clerides, Lach, & Tybout, 1 99 8 ; Hessels & van Stel, 20 1 1 ; Kneller & Pisu, 2007) . Contrasted with managers of more developed firms, entrepreneurs may have more advantages in global markets because of
entrepreneurs confronting less psychological, political and social boundaries to adapting new foreign knowledge (Autio, Sapienza, & Almeida, 2000) . Also, entrepreneurs learn through less tedious processes so they may have a learning advantage contrasted with older companies (Zahra et al., 2006).
However, Hessels and van Stel (20 1 1 ) cite Audretsch and Thurik (2000) who argue that previous studies concentrated on large multinational businesses and
corporations and do not give much attention to the role of new ventures in global markets. The following studies attempt to address this gap empirically by exploring the connection between export-oriented new ventures and national and regional economic growth.
Hessels and van Stel (2009) explore the relationship between a nation's export orientation of new ventures and economic development by using data from 3 6 countries in 2002 . Their results suggest that a nation's predominance of export-driven new ventures
is significantly and positively related to economic development. However, predominance of domestic-driven new ventures is not significant to national development. It is by and large recognized that new venture formation and export may both be vital factors for accomplishing national economic development (Hessels & van Stel, 2009).
Hessels and van Stel (20 1 1) also study the connection between a country's prevalence of entrepreneurship and its economic growth rate based on their sample of 34 countries during the period of 2002-200 8 . Their results indicate a positive relation between entrepreneurial activity and subsequent macroeconomic growth. Additionally, there is an extra beneficial outcome of export-related early-stage entrepreneurship in higher-income countries, but there is no such extra impact in lower-income countries though (Hessels & van Stel, 20 1 1 ).
Pen-a-Legazkue and Gonza'lez-Pem1' (20 1 5) examine the influence of export oriented entrepreneurship on regional economic growth using data for Spanish regions throughout the period of 2003-20 1 3 . These authors focus on economic growth,
export-oriented entrepreneurship is vital for the economic development of sub-national reg10ns. Consistent with past research, Pen-a-Legazkue and Gonza'lez-Perm' (20 1 5) find that Spanish regions with a large amount of opportunity-driven entrepreneurial activity display higher rates of economic growth. Also, areas with a higher rate of the adult population occupied with export-oriented entrepreneurial activity demonstrate higher
GDP growth rates (Gonzalez-Pemia & Pena-Legazkue, 20 1 5).
The preceding argument leads to the following two propositions:
Proposition 2: Greater export-oriented entrepreneurial activity is associated with a higher rate of economic growth, in both developing and developed countries.
Proposition 3: Greater domestic-oriented entrepreneurial activity is associated
with a lower rate of economic growth, in both developing and developed
countries.
2.4 Export Intensity of Entrepreneurship and Economic Growth
Gonzalez-Pemia and Pena-Legazkue (20 1 5) contend that the advantages derived from selling to foreign markets depend on the intensity of export orientation. Low levels of export intensity may result in lower economic growth (Bilkey & Tesar, 1 977; Gonzalez Pemia & Pena-Legazkue, 20 1 5).
Proprietors of new ventures with a small rate of sales from global markets
commonly sell their products and services to just a couple of outside customers, who give constrained access to new knowledge (Gonzalez-Pemia & Pena-Legazkue, 20 1 5). Often, low foreign income may reflect immaterial or random events rather than strategic
decisions by entrepreneurs to effectively approach international markets (Gonzalez Pemia & Pena-Legazkue, 20 1 5). On the other hand, entrepreneurs who acquire higher rates of foreign income commonly have access to a more extensive scope of clients and gather new knowledge from multiple sources (Gonzalez-Pemia & Pena-Legazkue, 20 1 5) . Thus, when exports are a common and significant part o f the company's activities, the degree of export-related entrepreneurship is higher and the subsequent improved
knowledge attained from a more extensive foreign client base can be expected to benefit the local economy by means of upgraded knowledge spillover impacts (Gonzalez-Pemia & Pena-Legazkue, 20 1 5).
Fryges and Wagner (2008) utilize generalized propensity score (GPS)
methodology and an expansive panel data set for German manufacturing companies to evaluate the connection between a company's export-sales ratio and its labor efficiency growth rate. Fryges and Wagner (2008) find that there is a causal impact of firms' export activities on labor productivity growth. Pen a-Legazkue and Gonza'lez-Pem1' (20 1 5) examined the influence of export-oriented entrepreneurship on regional economic growth and found that Spanish regions a with large amount of opportunity-driven
entrepreneurial activity display higher rates of economic growth (Gonzalez-Pemia & Pena-Legazkue, 20 1 5).
This discussion leads to our fourth and final proposition.
Proposition 4: A greater degree of export intensity of entrepreneurial activity is
associated with a higher rate of economic growth, in both developing and developed countries.
Chapter 3
METHODOLOGY
3 .1 Framework
This paper discusses the impact of emerging and developed countries' export-oriented entrepreneurship and of the intensity of export-oriented entrepreneurship on economic growth. Since both entrepreneurship and the elements underlying the GCI are thought to be structural qualities of an economy (Hessels & van Stel, 20 1 1 ), following Hessels and van Stel (20 1 1 ), this thesis explains economic growth in short-term rather than in the medium term. Thus, this study chooses the average annual real GDP growth for a period of four years as the dependent variable. As we know as catch-up effects, a less developed country per capita income has the tendency to grow at a faster rate than a developed country. Consequently, all countries should eventually converge regarding to per capita income. To correct for catch-up effects, this study uses the log of GDP (Hessels & van Stel, 20 1 1 ). The entrepreneurship is one kind of economic activity and it might
endogenous in the economic growth. So this study uses lagged real GDP growth and lagged independent variables to correct for reversed causality impacts (Hessels & van Stel, 20 1 1 ). After controlling for lagged dependent variable, lagged real GDP growth can't much to explain growth form that variable. This study expands on the empirical analysis by Hessels and van Stel (2009) and Hessels and van Stel (20 1 1 ), so the preceding discussion leads to the following modified models:
3 .1.1 Entrepreneurship and Economic growth
The baseline model that examines the entrepreneurship-growth-relationship can be set up as follows :
6GDPi (t, t-3) = Po+ P1 log (GDPC i, 1-4) + P2 GCI i, t-4 + p3 6GDP i, (t-4, t-7) + p4 GFCF i, t-4
+ Ps LFP i, t-4 + P 6 TEA i, t-4 + Eit ( 1 )
Equation ( 1 ) can b e understood to b e in the spirit o f Solow ( 1 956), an augmented to include the income catch-up effect and, of course, to highlight the role of entrepreneurial activity in economic growth, where 6GDPi (t, t-3) is four-year average of real GDP growth for country i. This study uses GDP growth as the dependent variable which is measured by the four-year average (i.e., the average over years t to t-3) of real GDP growth for country i. Real GDP growth (Annual percent change) data are available from the International Monetary Fund (IMF) World Economic Outlook database (October 20 1 6 version).
TEA i, t-4 is total early-stage entrepreneurial activity in country i in year t-4. Total early-stage entrepreneurial activity (TEA) is used to measure entrepreneurial activity in country i and year t-4. TEA is defined as "percentage of adults aged 1 8-64 setting up a business or owning-managing a young firm" (Reynolds et al. , 2005, p. 2 1 6) . Total early stage entrepreneurial activity data are taken from GEM Adult Population Survey (APS) using global national level data.
log (GDPC i, t-4) is natural logarithm of Gross domestic product per capita in country i in year t-4. Gross domestic product per capita (GDPC) is gross domestic product (GDP) divided by midyear population. GDP is the summation of gross value
added by all resident producers in the economy plus any product taxes and minus any subsidies not included in the value of the products (WDI, 201 7). GDP is calculated without making deductions for depreciation of fabricated assets or for depletion and degradation of natural resources (WDI, 20 1 7). Data are in constant 20 1 0 U . S . dollars. These data are taken from World Bank.
GCI i, t-4 is global competitiveness index (GCI) in country i in year t-4. Global
Competitiveness Index (GCI) is "a comprehensive tool that measures the microeconomic and macroeconomic foundations of national competitiveness" (Sala-i-Martin et al. 20 1 6) . The Global Competitiveness report defines competitiveness a s "the set o f institutions, policies, and factors that determine the level of productivity of a country" (Schwab et al., 20 1 4, p. 4) . Data on the GCI are available from The Global Competitiveness Report. GCI is including a weighted average of many different components : institutions, infrastructure, macroeconomic environment, health and primary education, higher education and
training, goods market efficiency, labor market efficiency, financial market development, technological readiness, market size, business sophistication, and innovation (Schwab et al., 20 1 4, p. 4) .
fl GDP i, (t-4, t-7) is lagged average real GDP growth over the period t-4 to t-7.
GFCF i, t-4 is gross fixed capital formation in country i in year t-4, Gross fixed capital formation (GFCF) is expressed in % of GDP . It (previously gross domestic fixed investment) includes land improvements (fences, ditches, drains, etc.); plant, machinery, and equipment purchases; and the construction of roads, railways, and the like, including schools, offices, hospitals, private residential dwellings, and commercial and industrial buildings (WDI, 20 1 7). These data are taken from World Bank.
LFP i, t-4 is labor force participation rate in country i in year t-4. Labor force participation rate (LFP) is the percentage of the population ages 1 5 -64 that is
economically active, which means all people who provide labor to produce goods and services during a specified period (WDI, 20 1 7). These data are also taken from World Bank.
3 .1.2 Export-oriented Entrepreneurship and Economic growth
L1GDPi (t, t-3) = Po+ P1 log (GDPC i, 1-4) + P2 GCI i, t-4 + p3 L1GDP i, (t-4, t-7) + p4 GFCF i, t-4 +
Ps LFP i, t-4 + P 7 TEA_ export i, t-4+ £it (2)
L1GDPi (t, t-3) = Po+ P1 log (GDPC 1, t-4) + P2GCI i, t-4 + p3 L1GDP i, (t-4, t-7) + p4 GFCF i, 1-4 +
Ps LFP i, t-4 +Ps TEA_ domestic i, t-4 + £it (3)
Equation (2) and (3) simply replace overall TEA with export or domestic orientation of TEA, where TEA_ export i, t-4 is percentage of all TEA business entities that have 1 - 1 00% customers outside the country in country i and year t-4. Total early-stage export-oriented entrepreneurial activity (TEA_ Export) means percentage of all TEA business entities (within each country) that have one or more of their customers outside the country. This data is also taken from the GEM Adult Population Survey using global national level.
TEA_ domestic i, 1-4 is percentage of all TEA business entities that have no customers outside the country in country i and year t-4 (Bosma, 2007) . This data is also taken from the GEM Adult Population Survey using global national level.
3 .1.3 Export Intensity of Entrepreneurship and Economic Growth
Ps LFP i, t-4 + p9E _low i, t-4 + cit (4)
6GDPi (t, t-3) = Po + P2 log (GDPC i, 1-4) + P2GCI i, t-4 + p36GDP i, (t-4, t-7) + p4 GFCF i, t-4 +
Ps LFP i, t-4 + P10 E _medium i, t-4 +cit (5)
6GDPi (t, t-3) = Po + P1log (GDPC i, t-4) + P2 GCI i, t-4 + p3 6GDP i, (t-4, t-7) + p4 GFCF i, 1-4 + Ps
LFP i, t-4 + PII E _high i, t-4 + cit (6)
Due to the availability of data, and following the literature this thesis uses percentage of customers outside the country to measure export-oriented entrepreneurship intensity rather than using volume of sales. E _low i, t-4 is percentage of all TEA business entities that have 1 -25% customers outside the country in country i and year t-4. The low level of total early-stage export-oriented entrepreneurial activity (E_Low) considers the
"percentage of all TEA business entities (within each country) that have 1 -25% [of] customers outside the country" (Bosma, 2007, P .7). Data on this as well as on E_medium and E _high are taken from the global national level GEM Adult Population Survey.
E _medium i, t-4 is percentage of all TEA business entities that have 26-7 5% customers outside the country in country i and year t-4. The medium level of total early stage export-oriented entrepreneurial activity (E _Medium) reflects the "Percentage of all TEA business entities (within each country) that have 26-75% [of] customers outside the country" (Bosma, 2007, P.7). This data is available from the global national level GEM Adult Population Survey.
E _high i, t-4 is percentage of all TEA business entities that have76- 1 00% customers outside the country in country i in year t-4. The high level of total early-stage
export-oriented entrepreneurial activity (E _High) reflects the "Percentage of all TEA business entities (within each country) that have 76- 1 00% [of] customers outside the country" (Bosma, 2007, P . 7). This data is also available from the global national level GEM Adult Population Survey.
3 .2 Data and Sample
This research analyzes 64 countries over the 2006-20 1 3 period. The entrepreneurship activities have different effects on developed and developing countries (Lepojevic, :Dukie, and Mladenovic, 20 1 6; Valliere & Peterson, 2009) . Countries are classified into
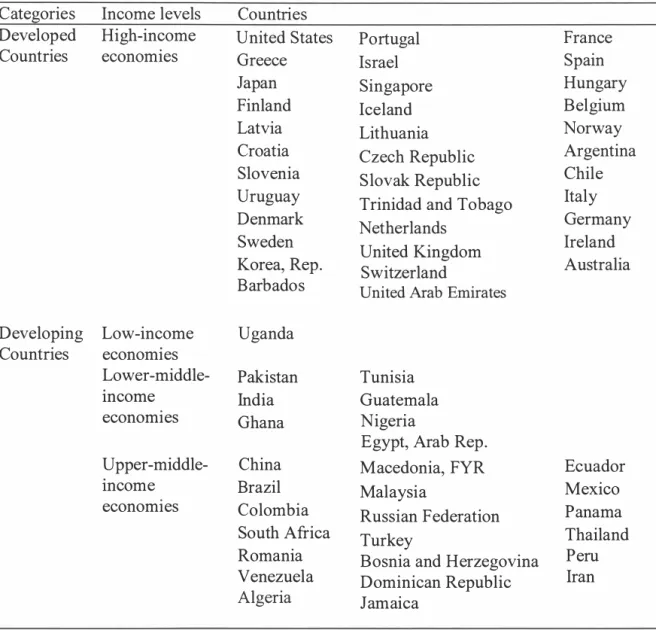
developing or developed categories based on the income cutoff suggested by the World Bank. The World Bank defines low-income economies as those with a GNI per capita (calculated using the World Bank Atlas method) of $ 1 ,025 or less in 20 1 5, lower middle income economies as those with a GNI per capita between $ 1 ,026 and $4,035, upper middle-income economies as those with a GNI per capita between $4,03 6 and $ 1 2,475, and high-income economies as those with a GNI per capita of $ 1 2,476 or more. For purpose of this thesis, developed countries include "high-income economies," while developing countries include "low-income," lower-middle-income," and
"upper-middle-income" economies.
Table 1 lists the set of countries that have been included in this study. There are 3 6 developed countries and 28 developing countries in the sample. The data used in the analysis come from four different sources, namely the Global Entrepreneurship Monitor (GEM) project, The Global Competitiveness report, World Bank, and International Monetary Fund (IMF). Due to the reliance on the GEM data, the period of analysis
an unbalanced panel of 228 observations corresponding to 3 6 developing countries and an unbalanced panel of 1 42 observations for 2 8 developing countries.
Table 1 List of Countries
Categories Income levels Countries
Developed High-income United States Portugal France
Countries economies Greece Israel Spain
Japan Singapore Hungary
Finland Iceland Belgium
Latvia Lithuania Norway
Croatia Czech Republic Argentina
Slovenia Slovak Republic Chile
Uruguay Trinidad and Tobago Italy
Denmark Netherlands Germany
Sweden
United Kingdom Ireland
Korea, Rep. Switzerland Australia
Barbados United Arab Emirates Developing Low-income Uganda
Countries economies
Lower-middle- Pakistan Tunisia
mcome India Guatemala
economies Ghana Nigeria
Egypt, Arab Rep.
Upper-middle- China Macedonia, FYR Ecuador
mcome Brazil Malaysia Mexico
economies Colombia
Russian Federation Panama
South Africa Turkey Thailand
Romania Bosnia and Herzegovina Peru
Venezuela Dominican Republic Iran
Algeria Jamaica
Variable liGDP (t, t-3) TEA logGDPC GCI TEA_export TEA domestic E low E medium E_high GFCF LFP liGDP (t-4, t-7)
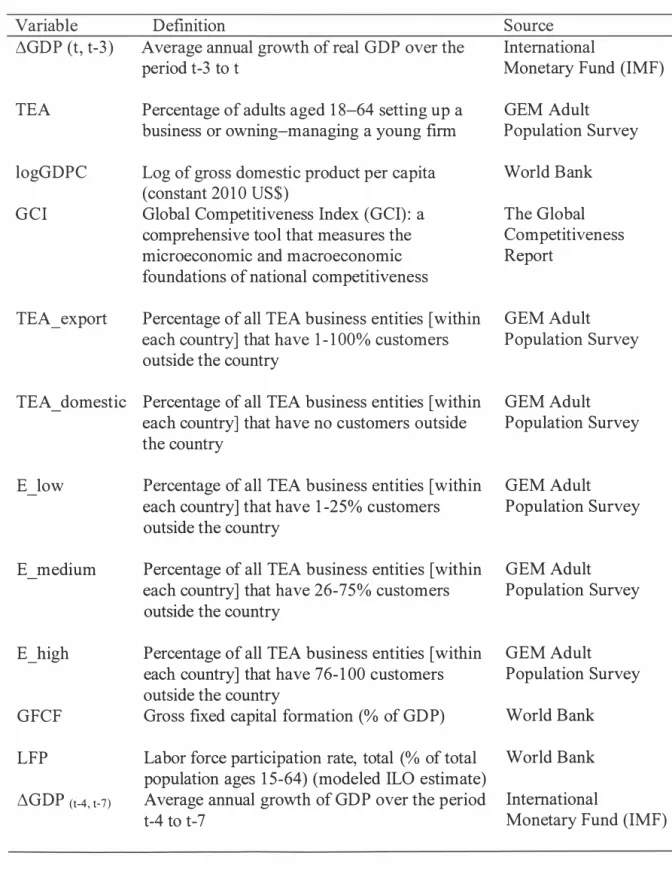
Table 2 Definition of variables and sources of data
Definition Source
Average annual growth of real GDP over the International
period t-3 to t Monetary Fund (IMF)
Percentage of adults aged 1 8-64 setting up a GEM Adult
business or owning-managing a young firm Population Survey
Log of gross domestic product per capita World Bank
(constant 20 1 0 US$)
Global Competitiveness Index (GCI) : a The Global
comprehensive tool that measures the Competitiveness
microeconomic and macroeconomic Report
foundations of national competitiveness
Percentage of all TEA business entities [within GEM Adult
each country] that have 1 - 1 00% customers Population Survey
outside the country
Percentage of all TEA business entities [within GEM Adult
each country] that have no customers outside Population Survey
the country
Percentage of all TEA business entities [within GEM Adult
each country] that have 1 -25% customers Population Survey
outside the country
Percentage of all TEA business entities [within GEM Adult
each country] that have 26-75% customers Population Survey outside the country
Percentage of all TEA business entities [within GEM Adult
each country] that have 76- 1 00 customers Population Survey
outside the country
Gross fixed capital formation (% of GDP) World Bank Labor force participation rate, total (% of total World Bank population ages 1 5-64) (modeled ILO estimate)
Average annual growth of GDP over the period International
3 .2.1 Descriptive statistics
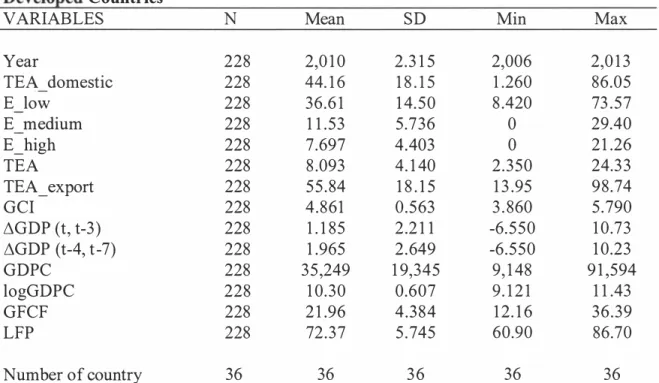
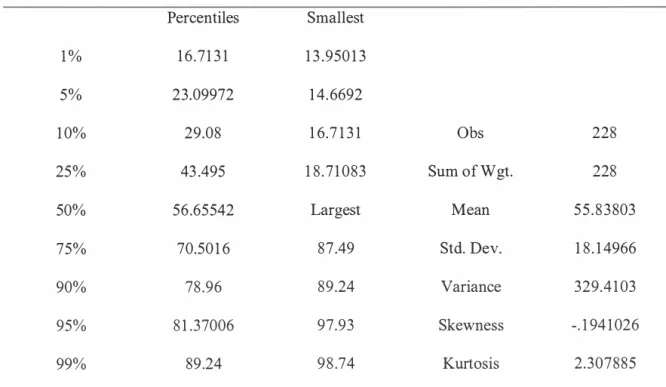
Table 3 provides descriptive statistics for the variables included in equation ( 1 ) through
( 6) . Over the period of analysis, the average percentage of adults aged 1 8-64 setting up a business or owning-managing a young firm in the developed countries is around 8 . 1 %, whereas it is 1 4.6% in developing countries. In developed countries, the export-oriented entrepreneurship represents 55.8% of the adult population on average, whereas that which is domestic-oriented represents 44.2%. In developing countries, the export oriented entrepreneurship represents 32.6% of the adult population on average, whereas domestic-oriented entrepreneurship represents 67.4%. The 3 6 developed countries included in the sample have experienced an average real GDP growth of 1 .2 % over the period of analysis, while the 28 developing countries have experienced a higher average real GDP growth of 3 .3%. The average gross domestic product per capita is 3 5 ,249 U.S. dollars per person in developed countries, but the average gross domestic product per capita is 6,3 1 7 U.S. dollars per person in developing countries. Also, the average Global Competitiveness Index of developed counties is 4.86 1 , whereas the average Global Competitiveness Index of developed counties is 4. 1 08 .
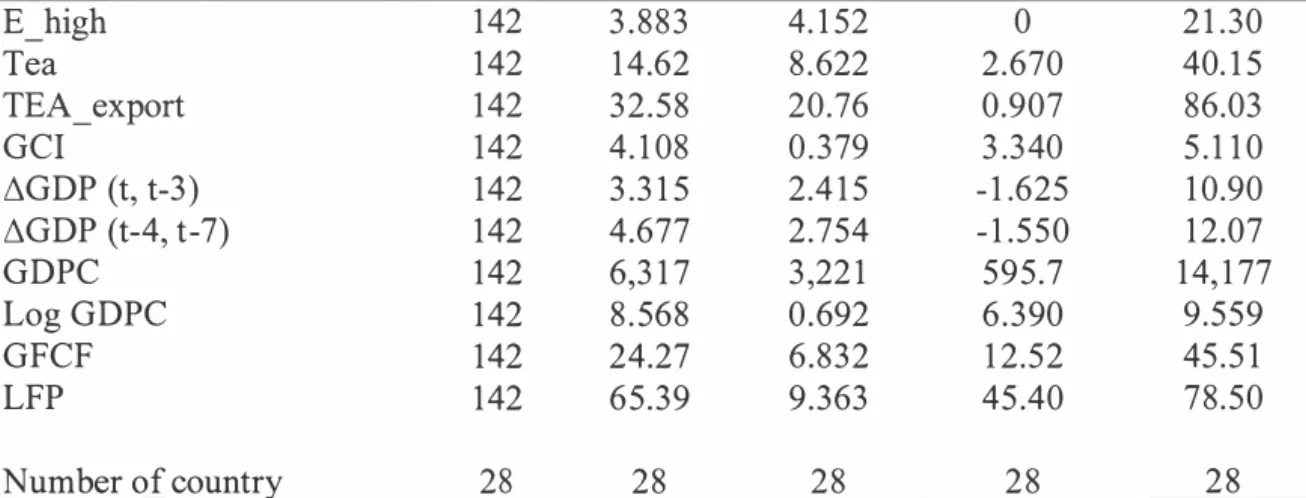
The relative significance of export-oriented entrepreneurship differs relying on the rate range of international customers. For example, in developed countries, adults aged 1 8-64 setting up a business or owning-managing a young firm highly involved in exports (76- 1 00% customers outside the country) comprise 7.7% on average whereas this fraction averages 3 .9% in developing countries. The population of adults engaged with a medium level of export intensity (26-75% customers outside the country) is on average
1 1 .5% in developed countries, and 7 .6% in developing countries. These percentages for a low level of export intensity ( 1 -25% customers outside the country) are 3 6.6% in
developed countries and 2 1 . 1 % in developing countries.
In Appendix, from Tables 1 , 2, 1 3 , and 14 provide TEA and EEA detail of developed countries and developing countries. Table 3 shows that TEA and EEA are cluster in developed countries, while they are scattered in developing countries (Table 4). Details of EEA and TEA are provided in Appendix .
Developed Countries VARIABLES Year TEA domestic E low E medium E_high TEA TEA_export GCI LiGDP (t, t-3) LiGDP (t-4, t-7) GDPC logGDPC GFCF LFP Number of country Developing Countries VARIABLES Year TEA domestic E low E medium
Table 3 Descriptive statistics
N Mean SD 228 2,0 1 0 2.3 1 5 228 44. 1 6 1 8 . 1 5 228 36.6 1 1 4. 5 0 228 1 1 .53 5.736 228 7.697 4.403 228 8 .093 4. 1 40 228 5 5 . 84 1 8 . 1 5 228 4.861 0.563 228 1 . 1 85 2 .2 1 1 228 1 .965 2 . 649 228 3 5 ,249 1 9,345 228 1 0. 3 0 0.607 228 2 1 .96 4 . 3 8 4 228 72 . 3 7 5 . 745 36 36 3 6 N Mean SD 142 2,0 1 0 2.209 142 67.42 20.76 142 2 1 .09 1 3 .62 142 7.604 6.6 1 8 Min Max 2,006 2,0 1 3 1 .260 86.05 8 .420 73 . 5 7 0 29.40 0 2 1 .26 2.350 24.3 3 1 3 .95 98.74 3 . 860 5 . 790 -6. 5 5 0 1 0.73 -6.550 1 0.23 9, 1 48 9 1 ,594 9. 1 2 1 1 1 .43 1 2. 1 6 3 6 . 3 9 60.90 86.70 36 36 Min Max 2,006 2,0 1 3 1 3 .97 99.09 0 . 8 3 0 7 1 . 6 1 0 30.48
E_high 142 3 . 8 8 3 4. 1 52 0 2 1 .30 Tea 142 1 4.62 8 . 622 2.670 40. 1 5 TEA_export 142 3 2 . 5 8 20.76 0.907 86.03 GCI 142 4. 1 08 0 . 3 79 3 .3 40 5 . 1 1 0 .6GDP (t, t-3) 142 3 .3 1 5 2.4 1 5 - 1 .625 1 0.90 .6GDP (t-4, t-7) 142 4.677 2.754 - 1 . 5 5 0 1 2.07 GDPC 142 6,3 1 7 3 ,22 1 595.7 1 4, 1 77 Log GDPC 142 8 . 568 0.692 6 . 3 90 9.559 GFCF 142 24.27 6.832 1 2.52 45 . 5 1 LFP 142 65.39 9.363 45 .40 78.50 Number of country 28 28 2 8 2 8 2 8
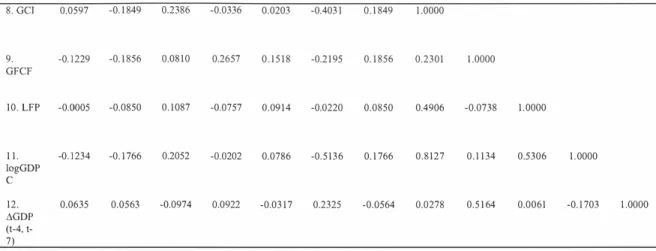
Table 4 and Table 5 display correlation matrixes among variables under study.
Both developed countries and developing countries show a low correlation pairwise
among dependent variable and most of the independent variables. Thus, there are no
multicollinearity concerns.
Table 4 Developed countries correlation matrix (N=228)
2 4 6 8 9 J O 1 1 1 2 1 . 1 .0000 6GDP (t, t-3 ) 2.TEA - -0.0675 1 .0000 domes ti 3 . 0.0 1 2 1 -0. 8 7 1 3 1 .0000 E_low 4. 0.0932 -0.5986 0. 1 807 1 .0000 E_medi um 5 . 0 . 1 1 70 -0.4724 0.0623 0.5697 1 .0000 E_high 6. TEA 0.2424 0 . 0904 0.0176 -0. 1 746 -0.2030 1 . 0000 7. 0. 0675 - 1 .0000 0.8713 0.5986 0.4724 -0.0904 1 . 0000 TEA_e xport
8 . GCI 0.0597 -0. 1 849 0.2386 -0.0336 0.0203 -0.403 1 0 . 1 849 1 .0000 9. -0. 1 229 -0. 1 856 0.08 1 0 0.2657 0 . 1 5 1 8 -0.2 1 95 0. 1 856 0.2301 1 .0000 GFCF 1 0 . LFP -0.0005 -0.0850 0 . 1 087 -0.0757 0.09 1 4 -0.0220 0.0850 0.4906 -0.0738 1 . 0000 1 1 . -0. 1 234 -0. 1 766 0.2052 -0.0202 0.0786 -0. 5 1 3 6 0. 1 766 0 . 8 1 2 7 0 . 1 1 34 0.5306 1 . 0000 logGDP c 1 2 . 0.0635 0.0563 -0.0974 0.0922 -0.03 1 7 0.2325 -0.0564 0.0278 0.5 1 64 0.0061 -0. 1 703 1 .0000 t.GDP (4, t-7)
Table 5 Developing countries correlation matrix (N=142)
2 4 6 9 I O 1 1 1 2 I . 1 .0000 t.GDP (t, t-3) 2 .TEA_ 0. 1 868 1 . 0000 domes ti 3 . -0.0602 -0.9224 1 .0000 E_low 4. -0.2762 -0. 8279 0.5882 1 . 0000 E_medi um 5 . -0.2964 -0.6557 0.395 1 0.61 68 1 .0000 E_high 6. TEA 0.2636 0.2468 -0. 1 3 83 -0.3 195 -0.27 1 1 1 .0000 7. -0. 1 868 - 1 . 0000 0.9224 0. 8279 0.6557 -0.2468 1 .0000 TEA_e xport 8. GCI 0. 1 9 1 8 0 . 1 246 -0.0522 -0.2 1 57 -0. 1 077 -0.3526 -0. 1 246 1 . 0000 9. 0.4267 0.0549 -0.0230 -0. 1 1 92 -0.0090 0.0408 -0.0549 0.3555 1 .0000 GFCF 1 0 . LFP 0.2284 0.3325 -0.2269 -0.3502 -0.3604 0.4339 -0.3325 0.085 1 0 . 1 965 1 .0000 1 1 . -0.3875 -0. 1 30 1 0 . 1 256 0.0284 0 . 1 934 -0.4 1 87 0 . 1 3 0 1 0.41 1 1 -0.0547 0.0220 1 . 0000 logGDP c 1 2 . 0 . 6 1 7 1 0.2384 -0. 1 603 -0.2588 -0.2542 0.3464 -0.2384 0 . 1 1 84 0.5075 0.3 1 40 -0.2559 1 .0000 t.GDP (4, t-7)
Chapter 4
RESULTS
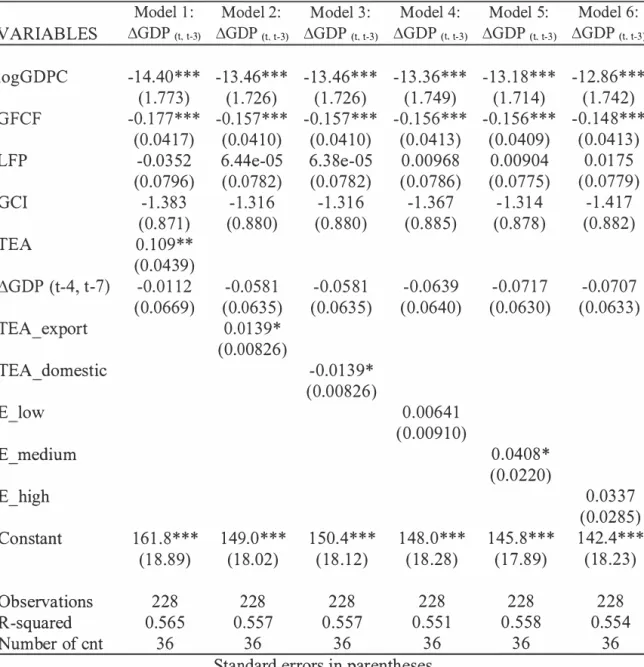
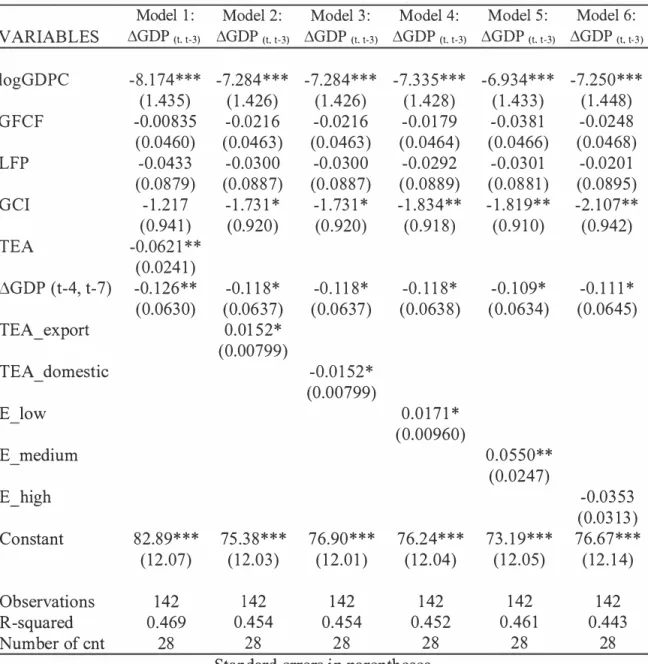
The dataset assembled to estimate the models laid out in the last chapter consists of a total of 228 observations corresponding to 3 6 developing countries and 1 42 observations for 28 developing countries. Estimation based on the panel data calls for the use of panel techniques of which we use fix and random effects. The results of the Hausman test suggest the use of fixed effects model is appropriate, since the random effects model fails to produce consistent estimates of the model parameters. Table 6 shows the results of six models for 36 developed countries and Table 7 displays the results of the same six models for 28 developing countries.
4.1 Entrepreneurship and Economic growth
Model 1 provides the results of the effect of the total early-stage entrepreneurial activity (TEA) in both developed and developing countries. From table 6 we see that TEA has a significantly positive effect on economic growth for developed countries, whereas from table 7 we see that TEA has a significantly negative effect on economic growth for developing countries. These results only represent partial support for proposition 1 . Greater entrepreneurial activity is associated with a higher rate of economic growth in developed countries but not in developing countries. The coefficient of TEA (developed countries) is at 0. 1 09 indicates that a one percent growth of TEA is associated with GDP average growth of 0. 1 09 percentage point.
Model 1 also shows GDP per capita has a strongly negative impact on economic growth in both developed and developed countries. Table 6 shows that the growth
�·I"!' •
competitiveness index does not contribute to economic growth in both developed and developing countries (Hessels & van Stel, 20 1 1 ) . Table 7 shows a significant negative effect of lagged growth on the current growth of developing countries. However, Table 6 displays a negative effect of lagged growth on economic growth of developed countries, but the effect is statistically insignificant. Gross fixed capital formation (% of GDP) shows a negative impact on growth in developed countries but has no significant impact in developing countries. Table 6 and Table 7 also show that labor force participation rate (% of total population ages 1 5-64) does not make a significant effect on economic growth
in either developing or developed countries.
4.2 Export-oriented Entrepreneurship and Economic growth
Model 2 presents the outcomes of the effect of total early-stage export-oriented
entrepreneurial activity (TEA_ Export) in both developed and developing countries. The
results show that export-oriented entrepreneurial activity is significantly positively
related with economic growth. These results show support for proposition 2 that greater export-oriented entrepreneurial activity (EEA) is associated with a higher rate of economic growth in both developing and developed countries. It is apparent that export orientation of entrepreneurial activity is more important for growth than is overall entrepreneurial activity. Results indicate that a one percentage point increase in the TEA_Export leads to a 0.0 1 3 9 (developed) percentage and a 0.0 1 52 (developing) percentage point increase in the average growth rate.
Model 3 displays the outcomes of the effect of the total early-stage domestic oriented entrepreneurial activity (TEA_ Domestic) in both developed and developing countries. The results present that domestic-oriented entrepreneurial activity is
significantly negatively associated with economic growth in both country groups. These results also present support for proposition 3 , which states that greater domestic-oriented entrepreneurial activity is associated with a lower rate of economic growth in all
countries. The initial income variable is, as expected, negatively related with economic growth as well, since it controls for the catchup effect in per capita income.
4.3 Export Intensity of Entrepreneurship and Economic Growth
Model 4 in Table 6 and 7 exhibits the results for the effect of the low level of early-stage export-oriented entrepreneurial activity (E _Low) in both developed and developing countries. From table 6 we see that E _Low has a positive effect on economic growth for developed countries, whereas from table 7 we see that E _Low has a significantly positive effect on economic growth for developing countries. A one percent increase in E _Low leads to approximately 0.0 1 7 1 (developing) percentage point increase in average growth rate. Greater the low level of total early-stage EEA the higher the economic growth rate in developing but not in developed countries.
Model 5 presents the results for E _Medium, i.e., the medium level EEA, whose effect on growth in both developed or developing countries. On the other hand, the high level of EEA makes no impact on growth in either country group (coefficients of E _high Model 6 in Table 6 and 7).
In Models 4, 5, and 6 initial GDP per capita has a significantly negative impact on economic growth in all countries, which indicates incomes do have a tendency to
converge. We can see from Model 4-6, gross fixed capital formation (% of GDP) is significantly negative in developed countries indicating diminishing marginal returns to capital investment, but the effect in developing countries is zero statistically insignificant.
From Models 4 -6 also show that the growth competitiveness index (GCI) is not is not relevant for change in growth in developed countries, but it matters in developing countries.
Model 6 has been carried forward in Table 8 and Table 9 to study how a high level of EEA affects economic growth. Table 8 presents results for the category E_High is greater than 5% (Model 6a), 6-7% (6b), 7-8% (6c), 8-9% (6d), and greater than 9% (6e) . Table 8 shows that when E_High is greater than 9%, the percentage of all the TEA business entities with a high level of total early-stage export-oriented entrepreneurial activity (EEA) has a significantly negative impact on economic growth in developing countries. In Table 9 we can see that from Model 6a--6f represent the results when
E _High ranges between 6% and 1 1 % separately. Table 9 shows that when E _High is greater than 8%, a one percent increase in the percentage of all the TEA business entities with a high-level EEA leads to approximately 0.4 1 2 percentage point increase in
developing countries average growth rate. However, there is no impact on growth whether we consider E_High ranges between 6% and 7% or between 9% and 1 1 % (see
Table 6 The effect of entrepreneurship variables on economic growth: Developed VARIABLES logGDPC GFCF LFP GCI TEA �GDP (t-4, t-7) TEA_export TEA domestic E low E medium E_high Constant Observations R-squared Number of cnt Model 1: �GDP (t, t-3) - 1 4.40 * * * ( 1 .773) -0. 1 77 * * * (0.04 1 7) -0.03 52 (0.0796) - 1 .383 (0. 8 7 1 ) 0. 1 09** (0.0439) -0.0 1 1 2 (0.0669) 1 6 1 . 8 * * * ( 1 8 .89) 228 0.565 36 Countries Model 2 : �GDP (t, t-3) - 1 3 .46* * * ( 1 .726) -0. 1 57 * * * (0.04 1 0) 6.44e-05 (0.0782) - 1 .3 1 6 (0.880) -0.05 8 1 (0.063 5) 0.0 1 39* (0.00826) 1 49.0 * * * ( 1 8.02) 228 0.557 36 Model 3 : �GDP (t, t-3) - 1 3 .46* * * ( 1 .726) -0. 1 57 * * * (0.04 1 0) 6.3 8e-05 (0.0782) - 1 .3 1 6 (0. 8 80) -0.05 8 1 (0.063 5) -0.0 1 3 9* (0.00826) 1 50.4* * * ( 1 8 . 1 2) 228 0.557 3 6 Model 4: �GDP (t t-3) - 1 3 .3 6 * * * ( 1 .749) -0. 1 56 * * * (0.04 1 3) 0 .00968 (0.0786) - 1 .367 (0. 8 8 5) -0.0639 (0.0640) 0.0064 1 (0.009 1 0) 1 48 . 0 * * * ( 1 8 .28) 228 0.55 1 3 6 Standard errors in parentheses * * * p<0.0 1 , * * p<0.05, * p<O. l Model 5: �GDP (t, t-3 ) - 1 3 . 1 8 * * * ( 1 .7 1 4) -0. 1 56 * * * (0.0409) 0.00904 (0.0775) - 1 .3 1 4 (0.878) -0.07 1 7 (0.063 0) 0 . 0408 * (0.0220) 1 45 . 8 * * * ( 1 7 . 8 9) 228 0 . 5 5 8 3 6 Model 6 : �GDP (t. t-3) - 1 2.86* * * ( 1 .742) -0. 1 4 8 * * * (0.04 1 3) 0.0 1 75 (0.0779) - 1 .4 1 7 (0. 8 82) -0.0707 (0.063 3) 0.03 3 7 (0.0285) 1 42.4* * * ( 1 8 .23) 228 0.554 36
Table 7 The effect of entrepreneurship variables on economic growth: Developing VARIABLES logGDPC GFCF LFP GCI TEA L'lGDP (t-4, t-7) TEA_export TEA domestic E low E medium E_high Constant Observations R-squared Number of cnt Model 1 : �GDP (t, t-3) -8. 1 74 * * * ( 1 .43 5) -0.00835 (0.0460) -0.043 3 (0.08 79) - 1 .2 1 7 (0.94 1 ) -0.062 1 * * (0.024 1 ) -0. 1 26** (0.063 0) 82.89* * * ( 1 2 .07) 1 42 0.469 28 Countries Model 2 : �GDP (t, t-3) -7.284 * * * ( 1 .426) -0.02 1 6 (0.0463) -0.03 00 (0.08 8 7) - 1 .73 1 * (0.920) -0. 1 1 8 * (0.0637) 0.01 52* (0.00799) 75 .3 8 * * * ( 1 2.03) 1 42 0.454 28 Model 3 : �GDP (t, t-3) -7.284* * * ( 1 .426) -0.02 1 6 (0.0463 ) -0.0300 (0.0887) - 1 .73 1 * (0.920) -0. 1 1 8 * (0.0637) -0.0 1 52 * (0.00799) 76.90 * * * ( 1 2.0 1 ) 1 42 0.454 28 Model 4: �GDP <t. t-3) -7.3 3 5 * * * ( 1 .428) -0.0 1 79 (0.0464) -0. 0292 (0.08 89) - 1 .834** (0.9 1 8) -0. 1 1 8 * (0.063 8) 0.0 1 7 1 * (0.00960) 76.24* * * ( 1 2.04) 1 42 0.452 28 Standard errors in parentheses
* * * p<0.0 1 , ** p<0.05, * p<O. l Model 5 : �GDP (t, t-3) -6.934* * * ( 1 .43 3) -0.03 8 1 (0.0466) -0.03 0 1 (0.08 8 1 ) - 1 . 8 1 9* * (0.9 1 0) -0. 1 09* (0.0634) 0.0550** (0.0247) 73 . 1 9* * * ( 1 2.05) 1 42 0.46 1 28 Model 6 : �GDP (t, t-3 ) -7.250 * * * ( 1 .448) -0.0248 (0.0468) -0.020 1 (0.0895) -2. 1 07 * * (0.942) -0. 1 1 1 * (0.0645) -0.03 53 (0.03 1 3 ) 76.67 * * * ( 1 2 . 1 4) 1 42 0.443 28
Table 8 The effect of percentage of business entities with VARIABLES logGDPC GFCF LFP GCI LiGDP (t-4, t-7) high5 high6 high7 high8 high9 Constant Observations R-squared Number of cnt
E _High on economic growth: Developing Countries Model 6a: LiGDP (t, t-3) -7.427* ** (1 .450) -0.02 1 8 (0.0476) -0.0 1 6 1 (0.0905) - 1 .903 ** (0.93 3) -0. 1 1 6* (0.0648) 0.0 1 08 (0.326) 76.89*** ( 1 2 .2 1 ) 1 42 0.436 28 Model 6b : LiGDP (t, t-3) -7.402* * * ( 1 .450) -0.0226 (0.047 1 ) -0.0 1 8 1 (0.090 1 ) - 1 . 9 1 7 * * (0.93 1 ) -0. 1 1 6* (0.0647) -0.0783 (0.303) 76.9 1 * * * ( 1 2 .20) 1 42 0.43 6 28 Model 6c: LiGDP (t, t-3) -7.3 79* * * ( 1 .444) -0.0254 (0.047 1 ) -0.0225 (0.0900) - 1 .9 1 3 * * (0.927) -0. 1 1 3 * (0.0646) -0.264 (0.328) 77.07 * * * ( 1 2. 1 7) 1 42 0.43 9 2 8 Standard errors i n parentheses * * * p<0.0 1 , ** p<0.05, * p<0. 1 Model 6d: LiGDP (t, t-3) -7.369 * * * ( 1 .445) -0.0226 (0.0469) -0.0279 (0.0908) - 1 .934* * (0.928) -0. 1 1 6* (0.0646) -0.25 1 (0.3 1 8) 77.3 5 * * * ( 1 2. 1 8) 1 42 0.43 9 28 Model 6e: LiGDP (t, t-3) -7.092 * * * ( 1 .428) -0.0236 (0.046 1 ) -0.0397 (0.08 8 8) -2.243 * * (0.926) -0. 1 06* (0.063 7) -0.649 * * (0.3 1 0) 77.05 * * * ( 1 1 .97) 1 42 0.45 8 28
VARIABLES logGDPC GFCF LFP GCI 6GDP (t-4, t-7) high6 high7 high8 high9 high l O high l 1 Constant Observations R-squared Number of cnt
Table 9 The effect of percentage of business entities with
E _High on economic growth: Developed Countries
Model 6a: �GDP c1, 1-3) - 1 2.98 * * * ( 1 .736) -0. 1 52 * * * (0.04 1 2) 0.0 1 63 (0.0780) - 1 .406 (0.883) -0.0727 (0.063 5) 0. 1 89 (0. 1 98) 143 .9 * * * ( 1 8 . 1 4) 228 0.552 36 Model 6b: �GDP (1, 1-3) - 1 3 .05 * * * ( 1 .72 7) -0. 1 52 * * * (0.04 1 1 ) 0.0 1 78 (0.0779) - 1 .3 6 1 (0.8 82) -0.0734 (0.0634) 0.23 5 (0.206) 1 44.3 * * * ( 1 8 . 05) 228 0.553 36 Model 6c: �GDP (t, t-3 ) - 1 3 .0 8 * * * ( 1 . 7 1 4) -0. 1 56 * * * (0.0409) 0.0 1 99 (0.0774) - 1 .307 (0. 878) -0.063 8 (0.063 0) 0.4 1 2* (0.2 1 6) 1 44.2 * * * ( 1 7.9 1 ) 228 0.559 3 6 Model 6d: �GDP (t, 1-3) - 1 3 . 1 0* * * ( 1 . 722) -0. 1 56 * * * (0.04 1 1 ) 0.0 1 8 1 (0.0778) - 1 .298 (0. 8 84) -0.0648 (0.0634) 0.3 1 5 (0.23 1 ) 1 44.6* * * ( 1 7.99) 228 0.555 3 6
Standard errors in parentheses * * * p<0.0 1 , ** p<0.05, * p<0. 1 Model 6e: �GDP (t, t-3) - 1 3 . 00 * * * ( 1 .730) -0. 1 53 * * * (0.04 1 1 ) 0.0 1 26 (0.0780) - 1 .375 (0. 8 82) -0.0678 (0.0634) 0.296 (0.262) 1 44.3 * * * ( 1 8 .06) 228 0.553 3 6 Model 6f: �GDP (t, 1-3) - 1 3 . 1 7* * * ( 1 .738) -0. 1 53 * * * (0.04 1 3) 0.0 1 62 (0.0782) - 1 .394 (0. 8 8 6) -0.0698 (0.063 7) -0.00729 (0.266) 1 46.0* * * ( 1 8 . 1 5) 228 0.550 3 6
Chapter 5
CONCLUSION AND DISCUS SION
5.1 Main Findings
This paper investigates the relationship between total early-stage entrepreneurial activity (TEA) and economic growth, while considering export-oriented entrepreneurship
intensity, as a prominent variable in the model. This paper conducts a regression analysis using data on 64 developing and developed countries over a period of 2006 -20 1 3 . It adds to the extant literature on entrepreneurship by further analyzing the different intensity degrees of export-oriented entrepreneurial activity (EEA) on economic growth by classifying countries into developing and developed and by analyzing the model over of time. No previous studies have analyzed the economic impact of export-oriented
entrepreneurship intensity at a national level with as comprehensive a dataset. Also, no previous studies analyze the threshold of the percentage of all the TEA business entities with a high level of EEA in detail and separately both developing and developed
countries.
The findings show that greater entrepreneurial activity is associated with a higher rate of economic growth in developed, but not in developing, countries. Also, EEA is associated with a higher rate of economic growth in both group of countries. Besides, greater domestic-oriented entrepreneurial activity is associated with a lower rate of growth in all countries. The findings also show that greater the low level of EEA higher in the rate of growth in developing but not in developed countries. Furthermore, greater
:fraction of high level of EEA is not associated with a higher rate of economic growth in either country group.
Also, when E _High is greater than 9%, the percentage of all the TEA business entities with a high level of EEA has a significantly negative impact on economic growth in developing countries. However, when E _High is greater than 8%, the percentage of all the TEA business entities with a high level of EEA has a significantly positive impact on economic growth in developed countries.
5 .2 Policy implications
From a policy perspective, the findings suggest that it may be beneficial for policy makers in developed countries to focus on stimulating entrepreneurial activity in general and export-oriented entrepreneurial activity in particular as well as on the medium level of EEA. For developing countries, focusing on the promotion of export-oriented
entrepreneurial activity, and on low and medium levels of EEA would seems to be most important. Policy makers should support export-oriented entrepreneurs to attain a
reasonable degree of export depth, but attention should also be given to the high level of EEA.
5 .3 Limitations and future research
This study, as other prior studies, has been limited by the availability of data on
percentage of all TEA business entities that have different proportion of their customers outside the country. This data is all we can get from Global Entrepreneurship Monitor. If data is available in the future, researchers could study entrepreneurship-growth
relationship broadening the scope of study to cover the output and employment aspects of production rather than just the proportion of customers.
Currently, no data exists to examine the sectional production categories of business for any differential impacts of business types on growth. That would provide an additional dimension to the relationship between export-oriented entrepreneurial activity and economic growth.
Data limitation has been severe particularly for developing countries. This paper has used panel data models to get a relatively larger sample size. Over time is possible for future research to increase the country sample beyond 64 and increase the period beyond eight years. Studies including more countries for longer periods would provide better insight into the effect of export-oriented entrepreneurial activity on economic growth.
References
Acs, Z. (2006). How Is Entrepreneurship Good for Economic Growth? Innovations:
Technology, Governance, Globalization, l ( l ), 97-1 07. https://doi.org/1 0. 1 1 62/itgg.2006. 1 . 1 .97
Acs, Z. J., Braunerhjelm, P., Audretsch, D. B., & Carlsson, B . (2009) . Knowledge spillover theory of entrepreneurship. Small Business Economics, 32( 1 ), 1 5-3 0. https://doi.org/1 0. 1 007/s l 1 1 87-008-9 1 57-3
Almeida Couto, J. P., Borges Tiagio, M. T., Vieira, J. C., &Fortuna, M. A. (2006). Contextual and operational determinants of export performance of companies in Europe. The Business Review, 5 ( 1 ) , 1 45-1 54.
Agarwal, R., Audretsch, D., & Sarkar, M. B . (2007). The process of creative construction:
knowledge spillovers, entrepreneurship, and economic growth. Strategic
Entrepreneurship Journal, 1(3-4), 263-286. https://doi.org/1 0. 1 002/sej .3 6
Audretsch, D. B . , & Fritsch, M. (2002) . Growth Regimes over Time and Space. Regional Studies, 3 6(2), 1 1 3-1 24. https://doi.org/1 0. 1 080/00343400220 1 2 1 909
Audretsch, D . B., & Thurik, a. R. (2000). Capitalism and democracy in the 2 1 st Century: from the managed to the entrepreneurial economy * Journal of
Evolutionary Economics, 1 0(1-2), 1 7-34. https://doi.org/1 0. 1 007/s00 1 9 1 0050003 Autio, E., Sapienza, H. J., & Almeida, J. G. (2000). Effects of age at entry, knowledge
intensity, and imitability on international growth. Academy of Management Journal,
Bilkey, W. J., & Tesar, G. ( 1 977) . The export behaviour of smaller-sized Wisconsin manufacturing firms. Journal of International Business Studies, 8( 1 ), 93-8 . https://doi.org/ 1 0. 1 057 /palgrave.jibs. 8490783
Birch, D. L. ( 1 98 1 ). Who creates jobs? The Public Interest, 3-1 4.
Braunerhj elm, P., Acs, Z. J., Audretsch, D. B., & Carlsson, B . (20 1 0) . The missing link: Knowledge diffusion and entrepreneurship in endogenous growth. Small Business
Economics, 34(2), 1 05-1 25. https://doi.org/1 0. 1 007/s l 1 1 8 7-009-9235- 1
Bosma, N. GEM 2007 Data File APS Version 23 October 2007 - Country Level Variable Descriptions [PDF document] . Retrieved from:
http ://www.gemconsortium.org/about/news
Callej6n, M., & Segarra, A. ( 1 999). Business dynamics and efficiency in industries and regions: The case of Spain. Small Business Economics, 13(4), 253-27 1 .
https://doi.org/ 1 0. 1 023/ A: 1 008 0 1 53 1 7323
Casson, M., & Wadeson, N. (2007). Entrepreneurship and macroeconomic performance.
Strategic Entrepreneurship Journal, 1 (3-4), 23 9-262. https://doi.org/1 0. 1 002/sej . 3 5 Clerides, S . K . , Lach, S., & Tybout, J. R . ( 1 998) . I s learning b y exporting important?
Micro-dynamic evidence from Colombia, Mexico, and Morocco. Quarterly Journal
of Economics, 11 3(3), 903-947. https://doi.org/ 1 0. 1 1 62/003 3 5 5398555784
Fryges, H., & Wagner, J. (2008). Exports and productivity growth: First evidence from a continuous treatment approach. Review of World Economics, 1 44(4), 695-722 . https://doi.org/ 1 0. 1 007 /s l 0290-008-0 1 66-8
Florida, R. and M. Keeney, 1 990, The Breakthrough Illusion: Corporate America 's
Failure to Move from Innovation toMass Production, New York: Basic Books.
Girma, S . , Greenaway, A., & Kneller, R. (2004) . Does Exporting Increase Productivity? A Microeconometric Analysis of Matched Firms. Review of International
Economics, 12(5), 855-866. https://doi.org/ 1 0 . 1 1 1 1 /j . 1 467-9396.2004.00486.x
Gonzalez-Pernia, J. L., & Pena-Legazkue, I. (20 1 5). Export-Oriented Entrepreneurship and Regional Economic Growth. Small Business Economics, 45(3), 505-522. https://doi.org/1 0. 1 007/s l 1 1 87-0 1 5-9657-x
GEM wiki (20 1 7). How GEM Defines Entrepreneurship. Global Entrepreneurship Monitor. Retrieved from: http://www.gemconsortium.org/wiki/ 1 1 49
Hart, D. M. (2003). The Emergence of Entrepreneurship Policy. The press syndicate of the university of cambridge.
Hebert, R. F . , & Link, A. N. ( 1 989). In Search of the Meaning of Entrepreneurship. Small Business Economics, l ( l ), 39-49.
Hessels, J., & van Stel, A. (20 1 1 ) . Entrepreneurship, export orientation, and economic growth. Small Business Economics, 3 7(2), 25 5-268 . https://doi.org/1 0. 1 007/s l 1 1 87-009-92 3 3 -3
Kneller, R., & Pisu, M. (2007). Industrial linkages and export spillovers from FDI. World Economy, 30( 1 ), 1 05-1 34. https://doi.org/1 0 . 1 1 1 1 /j . 1 467-970 1 .2007.00874.x Lages, L. F., & Montgomery, D. B . (2004) . Export performance as an antecedent of