Mapping Australian
higher education 2016
Andrew Norton
Grattan Institute Support Grattan Institute Report No. 2016-11, August 2016
This report was written by Andrew Norton, Grattan Institute Higher Education Program Director and Beni Cakitaki, Grattan Research Assistant. Ittima
Cherastidtham, Grattan Senior Associate made a substantial contribution, as did other Grattan staff who have worked on this and previous editions of this report. We would particularly like to thank Lawrence Stedman, Matt Brown, Andre Kaspura, John O’Mahony, Sara Ma and several anonymous reviewers for their advice and input. Members of Grattan Institute’s higher education reference group, reviewers of previous editions of this report and others have all helped improve this publication. Opinions in this report are those of the authors and do not necessarily represent the views of any of the people acknowledged above or Grattan Institute founding members, affiliates, or individual board members. Any errors or omissions are the authors’ responsibility.
Grattan Institute is an independent think-tank focused on Australian public policy. Our work is independent, practical and rigorous. We aim to improve policy outcomes by engaging with both decision-makers and the community. This paper uses unit record data from the Household, Income and Labour Dynamics in Australia (HILDA) Survey. The HILDA Project was initiated and is funded by the Australian Government Department of Social Services (DSS) and is managed by the Melbourne Institute of Applied Economic and Social Research (Melbourne Institute). The findings and views reported in this paper, however, are those of the authors and should not be attributed to either DSS or the Melbourne Institute.
Andrew Norton’s higher education reports are notified via Twitter, @andrewjnorton, and through the Grattan Institute’s mailing list. To join it, please go to:
http://www.grattan.edu.au/ This report may be cited as:
Norton, A., & Cakitaki, B. (2016) Mapping Australian higher education 2016, Grattan Institute ISBN: 978-1-925015-88-1 Google Medibank Private Susan McKinnon Foundation Christopher Cuffe Foundation EY PwC
The Scanlon Foundation Wesfarmers Ashurst Corrs Deloitte GE ANZ Urbis Westpac
Founding Members
Affiliate Partners
Senior Affiliates
Affiliates
Program Support
Higher Education ProgramOverview
For people new to higher education and higher education policy, the field can seem bewildering. Basic facts are surprisingly difficult to find and interpret. Funding entitlements reflect the sector’s history more than consistent policy principles.
Performance measures are published in many different places. Mapping Australian higher education 2016, the fourth report in a series, puts key facts and their context in one place.
Australia has 40 full universities, and around 130 other higher education providers. Their revenues in 2014 approached $30 billion, making higher education a significant industry.
Although Australian universities have increased their private income since the 1980s, they still rely on government. Nearly 60 per cent of their cash flow is government grants or loans. While major increases in higher education public funding are unlikely, the Commonwealth Government makes a significant investment in higher education. In 2015-16, it spent $15.7 billion, including direct grants to universities, student income support, and subsidies to the student loan scheme, HELP. About one dollar in five lent through HELP is not expected to be repaid. Since the last edition of Mapping, the international student market has recovered. In 2014, nearly 350,000 international students took courses with Australian universities. Domestic enrolments exceeded one million for the first time.
For domestic students, humanities and commerce remain the most popular fields of study, but health and science enrolments show the fastest growth. Most international students take commerce-related courses.
New data shows that the most common average mark reported by students is between 70 and 79 per cent, but that international students tend to get lower marks than domestic students. Many recent graduates find it difficult to get full-time work, although employment levels vary from course to course. This edition of Mapping has a special section on employment in science, information technology and engineering (STEM). Australia has many more science graduates than the labour market can absorb in related jobs. IT graduates seem unable to take full advantage of job growth in the IT industry. Engineering jobs are in decline, but new engineers have good job prospects compared to other graduates.
Despite slower transitions from university to career, the unemployment rate for all graduates remains low. Over their working lives, graduates on average earn significantly more than people who finish their education at Year 12.
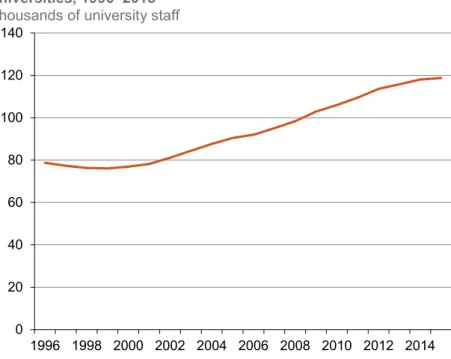
The higher education workforce plateaued in 2015 after a period of growth, with 53,000 people holding academic jobs. Most of them are in research-only or teaching and research positions. They are supported by a large number of casually-employed tutors and lecturers, who mostly hold teaching-only jobs. As well as teaching more students, since the 1990s Australian academics have substantially increased their research output, particularly through journal articles. But this growth has come to an end. Evidence from 2014 and 2015 shows that research expenditure, staff and outputs are stable or slightly declining.
Contents
Overview ... 3
Figures ... 5
Tables ... 8
Introduction... 9
1.
Higher education providers ... 10
2.
Higher education students ... 20
3.
The higher education workforce ... 32
4.
Research in higher education institutions ... 37
5.
Higher education finance – the macro picture ... 41
6.
Higher education finance – the micro picture ... 56
7.
Higher education policymaking ... 63
8.
Benefits of higher education for the public and
employers... 68
9.
Benefits of higher education for students ... 74
10.
STEM degrees and work ... 84
Glossary ... 100
Appendix A – Higher education providers offering HELP
loans ... 102
Appendix B – Higher education providers not offering HELP
loans ... 104
Appendix C – STEM categories ... 105
Figures
Figure 1: Higher education enrolments, 1950–2014 ... 20
Figure 2: Enrolment share by level of study, 1984–2014 . 21
Figure 3: Domestic higher education students, 1988–2014
... 21
Figure 4: Domestic higher education participation rates, 17–
19 and 20–29 year olds, 1982–2014 ... 22
Figure 5: Domestic enrolment share by field of education,
2008 and 2014 ... 23
Figure 6: International students enrolled in Australian higher
education, 1988–2014 ... 24
Figure 7: Proportion of domestic students enrolled full-time,
2001–2014 ... 25
Figure 8: Proportion of students studying off campus, 1950–
2014 ... 26
Figure 9: Proportion of enrolments by gender (domestic
students), 1949–2014 ... 27
Figure 10: Unique applicants and offers, 2010–2015 ... 28
Figure 11: ATAR, socio-economic status and university
participation, 2012 ... 29
Figure 12: Completion rates by ATAR, 2005 commencing
students by 2013 ... 30
Figure 13: Number of permanent and fixed-term staff in
universities, 1996–2015 ... 32
Figure 14: Staff by area of university, 2014 ... 33
Figure 15: Casual employment as a share of the full-time
equivalent academic workforce, 1990–2014 ... 35
Figure 16: Numbers of teaching and research, and research
only staff, 1992–2015 ... 37
Figure 17: Enrolments in research degrees, 1979–2014 .. 38
Figure 18: Research spending by type, 1994–2014 ... 39
Figure 19: Research publications, 1997–2014 ... 40
Figure 20: Core teaching grant funding, 1989–2014 ... 44
Figure 21: HELP lending and repayment 2005–2015 ... 46
Figure 22: Annual cost of HELP, 1994–2015 ... 48
Figure 24: ARC, NHMRC and block research grants to
universities, 2001–2015 ... 51
Figure 25: Total university research expenditure, 1992–
2014 ... 53
Figure 26: Teaching revenue from students, 1997–2014 . 54
Figure 27: Public and private spending shares of
universities, 1939–2014 ... 54
Figure 28: Public university revenue and expenses, 1996–
2014 ... 55
Figure 29: Annual international student bachelor degree
fees, 2016... 58
Figure 30: Field of study offer rates, 2009 & 2015 ... 62
Figure 31: Higher education attainment, men and women
aged 25–34, 1982–2015 ... 68
Figure 32: Number of managerial and professional
occupations experiencing skills shortages, 1986–2015 .... 70
Figure 33: Public confidence in universities, 2001–2014 .. 73
Figure 34: Subject pass rates for commencing bachelor
domestic and international students, 2001–2014 ... 75
Figure 35: Average self-reported marks, bachelor degree
domestic and international students, 2014 ... 76
Figure 36: Average student satisfaction with teaching,
1995–2014 ... 77
Figure 37: Under- and unemployment for recent graduates,
1980–2015 ... 78
Figure 38: Rates of professional and managerial
employment by bachelor degree, 2011 ... 80
Figure 39: Median net earnings of bachelor-degree
graduates compared to Year 12, 2011 ... 81
Figure 40: Median graduate earnings premium compared to
Year 12, by discipline, 2011 ... 82
Figure 41: Full-time employment rates for science
graduates compared to the all graduates average, 1982–
2015 ... 85
Figure 42: Further study rates for people completing STEM
bachelor degrees, 2014 ... 86
Figure 43: Employment trends for science postgraduates,
2010–2014 ... 87
Figure 44: Employment for science professionals,
Figure 45: Job vacancies for science professionals, 2006–
2016 ... 89
Figure 46: Relevance of STEM degrees to current
employment, 2015 ... 90
Figure 47: Employed degree holders by STEM discipline
and broad occupation, 2015 ... 91
Figure 48: IT bachelor degree commencing students, 2001–
2014 ... 93
Figure 49: Professional employment in STEM, 1986–2016
... 94
Figure 50: Temporary skilled migration (457) visas for
STEM professionals, 2009–2016 ... 95
Figure 51: Professional engineering jobs, 2001–2016 ... 97
Tables
Table 1: Australian Qualifications Framework ... 11
Table 2: Top ten international student source countries,
2001/2014 ... 24
Table 3: Level of highest education enrolment or attainment
for 20–24 year olds, by parent’s occupation, 2014 ... 27
Table 4: Academic pay ranges, 2016 ... 36
Table 5: Overview of public higher education subsidies,
2015-16 ... 42
Table 6: Overview of funding eligibility ... 43
Table 7: Contributions for a 2016
Commonwealth-supported place (student taking out a HELP loan) ... 57
Table 8: Top eight Australian universities, Shanghai Jiao
Tong university rankings, 2015 ... 72
Table 9: Excellence in Research for Australia, 2015 ... 72
Table 10: Employment levels by qualification, 2015 ... 79
Table 11: STEM professional occupations requiring a
degree – 4 digit ANZSCO code ... 105
Table 12: STEM fields of education, ASCED ... 106
Introduction
Mapping Australian higher education 2016 provides an overview of higher education policy and trends. Since its first edition in early 2012, the report has established itself as a widely used one-stop source of information on higher education.
Chapter 1 explains how higher education is defined in Australia, the different types of higher education provider, the various types of qualification, and what makes universities distinctive among higher education providers.
Chapter 2 reports on student trendsincluding enrolment numbers, courses chosen, and the mix of students on campus. It also discusses how students enter the higher education system.
Chapter 3 looks at the higher education workforce, including why people become academics, their employment arrangements, and their pay.
Chapter 4 looks at research in Australian universities, including what topics are researched and research outputs. Chapter 5 provides information on how higher education is funded, including overall levels of funding, the income-contingent HELP student loan scheme and research funding. Chapter 6 outlines how per student funding levels are
determined, and how student places are distributed among
higher education providers.
Chapter 7 describes the expanding scope of the
Commonwealth Government in higher education, the key
government departments and the higher education interest groups.
Chapter 8 examines higher education’s social outcomes,
including whether the disciplines studied meet employment needs, the quality of university research, and public satisfaction with Australian universities.
Chapter 9 covers outcomes for students, including academic standards, student satisfaction with teaching, and graduate employment and earnings.
Chapter 10 looks in more detail at science, IT and engineering
1.
Higher education providers
What is higher education? The answer is surprisingly complex. This opening chapter explores the issue by examining the activities of universities, non-university higher education providers and other organisations in the higher education industry.
What is higher education?
For many people, ‘higher education’ and ‘universities’ are
synonyms. But universities are a particular kind of institution that delivers higher education. While universities educate most higher education students, they are a minority of higher education providers in Australia – 43 of the 170 operating in mid-2016. This includes 40 universities, one specialist university and two
overseas universities.1 The other providers are colleges,
institutes, and schools that are authorised to offer higher education qualifications.
Before offering higher education qualifications, higher education institutions must be registered by the Tertiary Education Quality and Standards Agency (TEQSA – discussed in more detail in section 7.2.3). TEQSA ensures that all institutions meet
conditions set by government. They are expected to support free intellectual inquiry, offer teaching and learning that engages with advanced knowledge and inquiry, employ academic staff who are active in scholarship, and issue qualifications that in Australia
1 TEQSA (2016b). Appendix A and appendix B have a full list of higher
education providers.
must comply with the Australian Qualifications Framework (AQF).2
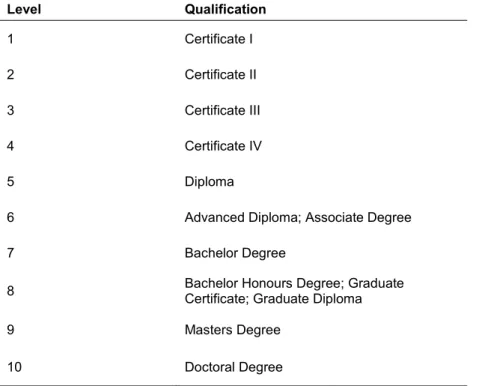
The power to issue particular types of qualifications is the most important defining feature of a higher education provider. Free intellectual inquiry, engagement with advanced knowledge, and scholarship all occur outside as well as within the higher
education sector. For these aspects of higher education no government permission is required: the market of ideas assesses value. It is the licence to issue AQF-recognised higher education qualifications, to certify individuals as having acquired knowledge and skills, that makes higher education providers distinctive. Qualifications are differentiated according to the knowledge and skills required for their successful completion. Table 1 shows the AQF qualifications, ranked from 1 to 10. Generally, certificates I to IV (levels 1 to 4) are classified as vocational, while associate degrees through doctoral degrees (levels 6 to 10) are classified as higher education. Level 5 diplomas and level 6 advanced diplomas can be vocational or higher education, though in practice most are taught in the vocational education sector.
2 DIICCSRTE (2013a). A revised standards framework comes into effect in
Table 1: Australian Qualifications Framework Level Qualification 1 Certificate I 2 Certificate II 3 Certificate III 4 Certificate IV 5 Diploma
6 Advanced Diploma; Associate Degree
7 Bachelor Degree
8 Bachelor Honours Degree; Graduate Certificate; Graduate Diploma
9 Masters Degree
10 Doctoral Degree
Source: AQF (2013)
Key differences between the qualifications include the level of theoretical knowledge required, and the student’s capacity to analyse information, make independent judgments and devise solutions to problems. Certificate I or II holders are expected to apply technical skills to routine tasks or predictable problems, while doctoral degree graduates are expected to be able to create new knowledge. In the middle classifications there are sometimes subtle distinctions. A certificate IV holder is expected to analyse information to complete a range of activities, while a
bachelor degree holder is expected to analyse and evaluate the information. A certificate IV holder is expected to provide
solutions to sometimes complex problems, while a bachelor degree holder is expected to generate solutions to problems that are sometimes complex and unpredictable. The AQF
encourages pathways between the qualifications, including full credit towards bachelor degrees for time spent acquiring diplomas, advanced diplomas, and associate degrees.
Since there is a continuum of knowledge and skills rather than sharp dividing lines between the AQF levels, the distinctions between vocational and higher education are partly a matter of convention. The terminology should not be taken to imply that one sector is concerned with the world of work and the other is not. Most higher education students are seeking vocational outcomes. When the Australian Bureau of Statistics asked people who had completed qualifications in the past year about their main reason for undertaking learning, three-quarters of those completing higher education qualifications gave a job-related reason. For people completing certificate III and IV qualifications, 85 per cent gave a job-related reason.3
Vocational and higher education providers also overlap. The public-sector vocational education providers, the TAFEs, are adding degrees to their course programs; eleven had done so as of mid-2016. Especially in Victoria, some universities are ‘dual sector’, with substantial TAFE operations. Other universities offer a smaller range of vocational education courses. In the private sector, many institutions offer both higher education and
vocational education courses. All up, at least 86 organisations provide both higher and vocational education courses.4
Non-university higher education providers
Non-university higher education providers (NUHEPs) are a significant part of Australian higher education. In July 2016, 127 NUHEPs (listed in Appendix A and Appendix B) were registered with TEQSA.5 Some are public institutions: the Australian Film,
Television and Radio School, the Australian Institute of Police Management, and the various TAFEs now offering degrees, for example. Some are hard to classify on a public-private spectrum, as they are for-profit colleges owned by public universities. But most (106) are clearly in the private sector. A 1999 survey identified 78 private NUHEPs, indicating growth of a third to 2016.6
Just under half (45) of private NUHEPs are registered with the Australian Charities and Not-for-profits Commission (ACNC).7
NUHEPs not registered as charities may still be not-for-profit. In
4 The MySkills website was used to count vocational providers. It was based
principally on name matching, so there could be additional providers with different names but common owners.
5 This count is not straightforward; it is of distinct legal entities on TEQSA’s
National Register of Higher Education Providers. However, some providers have multiple trading names and in one case two legal entities share a trading name: TEQSA (2016b)
6 Watson (2000). There is also significant turnover in NUHEPs, including
closures and takeovers.
7 ACNC (2016). To be registered, higher education providers must have a
charitable purpose in the public benefit. ‘Advancing education’ is a legislated charitable purpose: Charities Act 2013, division 2.
November 2015, TEQSA identified 58 private NUHEPs as not-for-profit.8
Although a significant number of for-profit NUHEPs operate in the Australian market, some companies own several providers. An Australian stock market listed company, Navitas Limited, owns nine NUHEPs. In 2014-15 it had university program revenues of $566 million, with profits of $140 million, from operations in many countries.9 Two large American for-profit
higher education companies, Kaplan and Laureate International Universities, also operate in the Australian market. In 2013-14, the median for-profit higher education provider earned profits of 12 per cent of their revenue.10
We cannot say for sure how many students are taught in
NUHEPs. Where public universities outsource teaching (section 1.4) the students are counted in the university rather than the teaching institution. With this caveat, in 2014 NUHEPs enrolled at least 67,550 full-time equivalent students.11 It is a big increase
on slightly less than 15,000 full-time equivalent students in 1999, but still only seven per cent of all enrolments (see section 2.1 for more detail on enrolments).
The non-university higher education sector is quite diverse, so most generalisations have exceptions. However, NUHEPs are specialised compared to universities (discussed in section 1.3). For most, teaching is their only major education function. They often use staff and facilities for revenue-generating teaching for
8 TEQSA (2016a), p 7
9 Navitas (2015), p 22. These are pathway programs to universities (see
discussion in this section).
10 TEQSA (2016a), p 24. This is double the university rate. 11 TEQSA (2016d), p 9
longer periods of the year than universities do. Students can also finish their courses more quickly, studying for three trimesters a year rather than the two semesters offered by most universities. Within their teaching function, NUHEPs often specialise in particular course levels. Very few offer the full range of AQF qualifications through to PhD. Fourteen institutions known as pathway colleges specialise in diploma-level courses. Their purpose is to prepare students for entry into the second year of a university course. Typically, they have a relationship with a particular university, and the diploma curriculum will match that taught in the target university’s first year. For example, students who successfully complete a Diploma of Business at the South Australian Institute of Business and Technology can enter the second year of a University of South Australia Bachelor of Business. By contrast, the College of Law offers entirely
postgraduate courses as it prepares law graduates for practice or gives lawyers additional specialist skills.
NUHEPs also tend to specialise in what they teach. Many include a specific field of study, industry or occupation in their title, for example: Kaplan Business School, International College of Hotel Management, and the Australian College of Nursing. Subject specialisation can build brand reputations in particular niche areas.
An analysis of course offerings shows that business-related courses are most common in the non-university higher education sector. These include some delivered by professional
associations such as Chartered Accountants Australia and New Zealand. There are also a significant number (21) of institutions with a religious affiliation. Some are theological colleges, but others offer a wider range of courses.
Health, and particularly alternative health, is also a common field in the non-university higher education sector. Nineteen providers have a health-related speciality. Another 15 colleges specialise in various kinds of creative arts.
Some NUHEPs are primarily focused on the international student market. Twenty-eight NUHEPs with published enrolment data report that two-thirds or more of their students are from overseas.
In most cases, accreditation for NUHEP courses must be sought from TEQSA.12 The accreditation process includes examining
course content, student admission criteria, assessment methods, and staff qualifications. Course content needs to be comparable to courses at the same level in similar fields at other Australian higher education providers. There is provision for NUHEPs with appropriate quality assurance systems and a track record of re-accreditation to become self-accrediting – to have a legal right to approve their own courses. However, most NUHEPs are not self-accrediting.13
On top of these licence-to-operate requirements, some NUHEPs seek other third-party approval or endorsement of their courses. For example, NUHEPs offering accounting courses have them recognised by CPA Australia, so their graduates can become members of that accounting professional association. Some courses at the Australian College of Applied Psychology are approved by the Psychotherapy and Counselling Federation of Australia, a professional body.
12 TEQSA (2016c)
What is distinctive about universities?
‘University’ is a regulated term in Australia. No educational organisation can operate as an Australian university without meeting criteria set out in law. Commonwealth Government Provider Category Standards enforced by TEQSA determine which institutions can operate as universities.14 Overseas
universities can offer their home country qualifications in
Australia if they are approved by a higher education accrediting authority acceptable to TEQSA.15
1.3.1 Research
The most important distinctive aspect of universities as higher education institutions is their combination of research and teaching. Research is defined as original work conducted to produce new knowledge. To be a full Australian university, a higher education provider must be active in research across at least three broad fields of study: disciplines such as health, engineering, education, or science.16 Higher education
institutions with research activity in only one or two fields can apply to be a specialist university. Under this provision, the Melbourne College of Divinity became the University of Divinity. While the idea that universities must be active in research is widely accepted in Australia today, the original Australian
14 TEQSA (2016c); DIICCSRTE (2013a); Department of Education and Training
(2015f). A list of universities is in Appendix A. Most universities also have their own founding legislation, usually from a state government.
15 Carnegie Mellon University and University College London are the current
overseas universities. University College London is closing its Australian operations from 2017, see Brewer (2015).
16 A detailed categorisation of disciplines can be found in ABS (2001).
universities established in the mid-19th century were to be places
of scholarship – expertise in existing knowledge rather than original research. Though universities were conducting some research by the latter part of the 19th century, PhD degrees were
not offered until the 1940s.17 In the late 1980s and early 1990s,
predominantly teaching-focused colleges of advanced education and other government-funded higher education institutions were turned into or merged with universities, substantially diluting the university sector’s research orientation. The universities that were created as a result are still sometimes referred to as “Dawkins universities” (after the minister behind the policy, John Dawkins).18 The description was partly intended to distinguish
them from pre-1988 universities. Yet only 10 years later, research became a defining legal feature of a university.19
The research requirement has made it difficult for new universities to start. University research typically is not self-financing. Public research funding is primarily awarded according to past research performance, which makes it hard for new universities to build research output. So after a period in the 1980s and 1990s, when many new universities were created, no new full Australian universities were established in the decade after the three fields of study rule came into effect in 2000. In October 2011, the first new university to be established under the three fields of study rule was announced. Torrens University Australia is owned by the American for-profit university
17 Starting with the University of Melbourne in 1945: Forsyth (2014), p 27. 18 The universities created during the Dawkins years are noted in the list of
universities in Appendix A. For a more detailed history see Croucher, et al. (2013).
19 Through agreements between education ministers: MCEETYA (2000), later
conglomerate, Laureate International Universities. It took its first students in 2014.
Universities aspire to a teaching-research nexus: in other words, that teaching and research are not just two separate functions of the same institution, but mutually beneficial. Using empirical measures of teaching performance, it has been difficult to prove that a reliably positive nexus exists.20 A Grattan Institute report
analysed student surveys on teaching to see whether research activity levels made a difference. While it identified some
differences between high and low research departments, overall no consistent positive or negative effect of research on teaching was found.21 This does not show that research never benefits
teaching, but that an overall assessment includes negative effects of research on teaching. Teaching and research compete for limited academic time, attention and resources. Australian academics generally have a low preference for teaching compared to research. 22
Both research output and student satisfaction with teaching have improved in the last 15 years (sections 4.3 and 9.1.2), which might suggest a synergy. But it is more likely that changed policies and practices aimed directly at each activity explain the improvement (sections 5.2.4 and 9.1.2).
1.3.2 Comprehensiveness
While many NUHEPs are specialised in what they teach (section 1.2), full Australian universities must offer courses in at least
20 See the summary and references at Norton and Cherastidtham (2015a), p
31-33.
21 Cherastidtham, et al. (2013)
22 Coates, et al. (2009) esp. p 21-22; Strachan, et al. (2012), p. 37
three broad fields of study, as classified by the Australian Bureau of Statistics.23 Most offer more. They are often described as
being “comprehensive” in the range of courses they offer. More than half of universities have students in all ten major broad fields of study, and all but four have at least eight major fields of study.24
While many students specialise in their university studies, the comprehensive nature of Australian universities creates opportunities for studying more than one field. Australian
universities offer many combined qualifications, such as arts/law or commerce/science, so that students graduate with two
degrees.25 Ten per cent of completing students have combined
or double degrees.26 Many students also take units from faculties
other than the one they are principally enrolled in. For example, an arts student may do a mathematics unit taught by a science faculty.
Comprehensiveness also extends to the range of qualifications offered. All full universities offer courses from bachelor through to PhD (section 1.1). Some also offer diploma, associate degree and vocational education qualifications.
1.3.3 Self-accreditation
Unlike other higher education institutions, Australian universities automatically have the right to accredit their own courses.
23 ABS (2001)
24 Calculated from Department of Education and Training (2015m), table 2.8. 25 In 2015, more than 40 per cent of bachelor pass degree courses offered by
Australian universities were combined courses: Department of Education and Training (2015g)
University academic boards approve their university’s courses, within a framework established by government regulation.27
Self-accreditation is an aspect of academic freedom (section 1.3.4). In developing courses, academics in self-accrediting universities are free to include material without seeking a government agency’s approval. They are instead regulated by their fellow academics.
Though universities self-accredit, they also seek external accreditation or recognition. Often this is necessary for their graduates to be admitted to professional practice. They
sometimes also secure international recognition. For example, many universities have had their business schools accredited by the international Association to Advance Collegiate Schools of Business (AACSB).
1.3.4 Academic freedom
The institutional freedom of self-accreditation has its individual equivalent in the idea of academic freedom. As one American study put it, “academic freedom establishes the liberty necessary to advance knowledge, which is the liberty to practise the
scholarly profession.”28
Generally, academics see themselves as having considerable autonomy in the three main areas of university activity: research, teaching and community engagement (section 1.3.6 for more on engagement). Surveys of academics show that freedom to pursue their own research interests is a major part of what
27 For a description of how academic boards operate see Group of Eight
(2014a).
28 Finkin and Post (2009), p 39
attracts them to universities.29 This freedom has legal recognition
in the licence to operate rules enforced by TEQSA and the funding laws implemented by the Department of Education and Training.30 University policies and enterprise agreements set out
more detail on how academic freedom works in practice.31
For research and teaching, academics largely self-regulate their individual freedoms: academic research is subject to peer review (review by other academic experts) and course content is
approved by academic boards. This formal academic self-regulation is absent for community engagement. University administrations sometimes try to perform this role, and dismiss or discipline academics who make controversial or embarrassing public statements.32 Such actions almost always attract strong
criticism, as academics do not see this as a legitimate role for managers (see more in section 1.3.5 below).
In practice, a strong culture of academic freedom is more a feature of universities than of higher education providers generally. Free intellectual inquiry is necessary for advancing knowledge, but not for providing higher education qualifications. Some higher education providers have narrower purposes, focusing on teaching knowledge and skills developed elsewhere.
29 Bexley, et al. (2011), p 66
30 Higher Education Support Act 2003, section 19-115; DIICCSRTE (2013a);
Department of Education and Training (2015f)
31 Stobbs (2015)
32 For examples and some background, see Jackson (2005) and O'Brien (2015)
p. 223-229. From 2012, allowing academics to make public comment on issues within their area of expertise is a condition of being registered as a higher education provider: DIICCSRTE (2013a) and Department of Education and Training (2015f)
1.3.5 Self-governing communities
Universities see themselves as self-governing communities. Both public and private universities are legally distinct from
government.33 Government appointments to university governing
bodies, commonly called councils or senates, are never a majority. Four universities have no such appointments.34
Education ministers have no direct operational control. Partly for historical constitutional reasons, much government regulation is via conditions on grants (section 7.1), which universities can decline.
Within universities, academics see themselves as members of the university community and not just as employees.35 The legal
force of this distinction was explicitly acknowledged in a Federal Court judgment.36 Academics expect inclusion in collective
decisions, a decision-making process known as collegiality. Traditionally academics elect members to university senates and councils. Academic critiques of university administrators often complain about what they call managerialism – managers directing academics or steering their behaviour through targets and incentives. Managerialism is seen as an ideological rival to collegiality.
33 For a discussion of universities as special purpose corporations see
Corcoran (2000).
34 They are Australian Catholic University, University of Notre Dame, Bond
University and Torrens University Australia.
35 See the discussion in Forsyth (2014), especially chapters 7 & 8.
36 In University of Western Australia v Gray the court held that academic staff
were, by virtue of the definition of ‘university’ in the UWA Act, members of a university, “linked historically by that definition to the idea of the university as a community of teachers and scholars”, see Stobbs (2015).
Student groups also seek representation in university decision making, often through student associations officially recognised by the university. Traditionally this was granted; it is now required by regulation.37 The role and funding of official student
organisations is the subject of a long-running political dispute between the Liberal Party on one side, and official student organisations, universities, and the Labor Party on the other.38
Despite complaints from academics that university managers are too powerful, university organisational structures are highly decentralised compared to for-profit corporations, with large amounts of consultation and decision-by-committee. Combined with change-resistant academics and staff unions, these decision-making processes can make reforming universities difficult.
1.3.6 Broad social responsibilities
As well as being a community in themselves, universities are expected to contribute to the broader community. Community engagement is sometimes referred to as the third stream of university activity, after teaching and research. It can include universities working with or for local communities, government, industry, not-for-profits, and the media. The standards for registration as a university elevate some of these activities from desirable to necessary, requiring demonstrated engagement with local and regional communities, and a commitment to “social
37 DIICCSRTE (2013b); DIICCSRTE (2013a); Department of Education and
Training (2015f)
responsibility” in their activities.39 It is also common for university
founding statutes to include community engagement objectives. Community engagement is so diverse that it is hard to measure. One input indicator comes from academic time-use surveys, although the published surveys include other activities. The latest, from 2015, found that academics spent on average 5.3 hours a week on community and university service, out of an average 50.7 hours of work.40 An earlier survey of academics
found that more than half believed that community service should be rewarded in promotions, though only 15 per cent said that it was rewarded.41 Community service is an important part of
university culture and practice, but unlike teaching and research it does not dominate.
1.3.7 Multiple missions
Though the term ‘university’ has a formal legal definition, no single feature makes universities distinct as higher education providers. Some NUHEPs conduct research, self-accredit, give their academic staff freedom, operate as a community of scholars, and engage with broader social responsibilities. But few do all of these things, and most have limited functions beyond teaching. Contemporary Australian universities are characterised by their combination of activities more than by any one feature.
39 DIICCSRTE (2013a); Department of Education and Training (2015f)
40 NTEU (2015c). A 2007 survey, which excluded internal university service but
included services to clients or patients as well as community service, reported 4.4 hours out of 50.6 hours a week: Coates, et al. (2009)
41 Bexley, et al. (2011)
The multi-faceted nature of universities has advantages. The different characteristics of contemporary universities – research, teaching and community engagement – can all inform each other. Yet the model may also have disadvantages. Where in most industries gains in quality and productivity come through specialisation, in universities potential gains from specialisation are limited by the model of a generalist practitioner. Academics are expected to be good at research, teaching, and community engagement; many are expected to be good administrators as well. The skills needed for the generalist academic’s four tasks are not the same.
Higher education service providers
Although only higher education providers have a licence to issue higher education qualifications, other organisations support higher education providers or deliver related higher education services.
While universities do their own marketing, intermediary organisations help co-ordinate the matching of students with courses and institutions. The most important intermediaries are the state-based tertiary admissions centres, which handle most school-leaver applications for university (section 2.7).
Commercial organisations are also involved in student recruitment. SEEK Learning is an education broker advising prospective students on their course options. Owned by the same company as the SEEK job advertisement site, SEEK Learning services the overlapping markets of people looking for better jobs and an upgrade of their qualifications. In the
international students with universities in Australia and elsewhere.
Open Universities Australia (OUA) does not deliver education or award degrees. It sells online units and courses offered by its seven shareholder universities and other higher education providers. It is unusual in promoting not-for-degree units; selling just knowledge without a credential (though students may apply to individual universities for credit towards a degree for OUA units).
Organisations such as Blackboard and Moodle help universities co-ordinate teaching-related activities through software known as learning management systems. These store course content and are used to submit work, run student forums, record assessment results, and do other administrative tasks. An Australian
university became the first in the world to use IBM’s Watson platform, which uses machine learning to answer student questions.
The world’s largest international educational services company is Pearson Education. It publishes textbooks and offers a wide range of online educational services. One of these is
Smarthinking, a 24/7 online tutorial service used by some Australian universities.
New firms are emerging selling educational software innovations such as ‘adaptive learning’, where online course materials adjust to the student. These include Knewton in the United States, and Smart Sparrow in Australia.
Universities also outsource campus-based course delivery, usually to NUHEPs. For example, Navitas operates La Trobe
University’s ‘La Trobe University Sydney’ campus. Students study a La Trobe University curriculum and are awarded a La Trobe University degree. Queensland TAFE offers University of Canberra degrees. There are other similar arrangements around Australia.
These relationships may become more common in higher education. As higher education becomes more competitive (section 6.2) partnerships can give universities access to new markets and technologies. Higher education service providers can build economies of scale by supporting many universities, lowering the cost of education.
2.
Higher education students
This chapter examines how many people are studying a higher education course, how they are chosen, what they are studying, and some of their social characteristics.
What is the overall trend in enrolments?
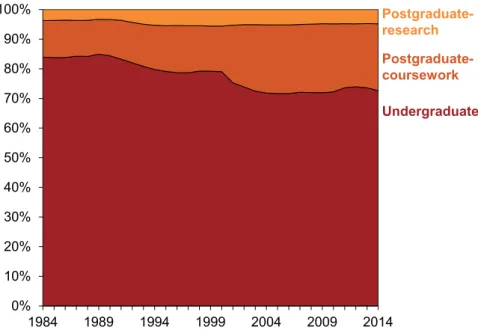
Australian higher education student numbers have grown rapidly since the 1960s, as Figure 1 shows. In 2014, total domestic and international student enrolments were just below 1.4 million. Although undergraduate numbers increased by the largest absolute number over the last 30 years, postgraduate
coursework has doubled its share of total enrolments from 11 to 22 per cent. While the number of research students is increasing (section 4.1), their share of all students has been stable at around 5 per cent for many years. Figure 2 shows the trends.
Figure 1: Higher education enrolments, 1950–2014 Millions of students
Notes: Figures from 2001 onwards are based on full year enrolments, prior years are based on enrolments as at 31st March. Due to students commencing mid-year and at other times, pre-2001 enrolments are under-stated.
Sources: DEEWR (2000); Department of Education and Training (2015m) 0.0 0.2 0.4 0.6 0.8 1.0 1.2 1.4 1950 1958 1966 1974 1982 1990 1998 2006 2014
Figure 2: Enrolment share by level of study, 1984–2014 Proportion of enrolments
Notes: Doctorate by coursework is classified as postgraduate coursework. Extended masters is classified as postgraduate research.
Sources: DEEWR (2000); Department of Education and Training (2016f)
Domestic students
About three-quarters of students enrolled in Australian higher education institutions are Australian citizens or permanent residents. Occasional years of slow growth or small declines in student numbers only interrupt the long-term trend towards more students (Figure 3). Controls on undergraduate student numbers in public universities were eased and then largely removed in the years leading up to 2012 (section 6.2). This policy change
triggered rapid enrolment increases. In 2014, domestic enrolments exceeded one million students for the first time.
Figure 3: Domestic higher education students, 1988–2014 Millions of students
Note: Figures from 2001 onwards are based on full year enrolments, prior years are based on enrolments as at 31st March.
Sources: DEEWR (2000); Department of Education and Training (2015m) 0% 10% 20% 30% 40% 50% 60% 70% 80% 90% 100% 1984 1989 1994 1999 2004 2009 2014 Undergraduate Postgraduate-coursework Postgraduate-research 0.0 0.1 0.2 0.3 0.4 0.5 0.6 0.7 0.8 0.9 1.0 1.1 1988 1993 1998 2003 2008 2013
Figure 4: Domestic higher education participation rates, 17–19 and 20–29 year olds, 1982–2014
Proportion of population enrolled
Notes: Onshore higher education international students have been removed from the population figures for 2002, 2012 and 2014. Includes undergraduate and postgraduate students.
Sources: DEET (1993); DEST (2002) ABS (2008); ABS (2015a); Department of Education and Training (2015m); g)
Australia’s population has also grown in this period. Participation rates adjust for this by showing the proportion of people enrolled in higher education. Figure 4 reports higher education
participation rates for school leavers aged between 17 and 19 years and for people in their twenties. Thirty-one per cent of the late teenage group were enrolled in higher education in 2014. In both age groups, participation rates more than doubled between 1982 and 2014.
2.2.1 What courses do students take?
Australian universities have mixed general and professional education from their earliest days. Although more professions require degrees for admission than in the past, with consequent increases in university enrolments in related fields, more general interest courses that are not necessarily aimed at particular occupations make up a substantial share of all domestic coursework enrolments (Figure 5). Twenty-two per cent of all enrolments are in arts courses, the largest of any field of education, and 8.5 per cent of enrolments are in science
courses. Combined qualifications (section 1.3.2) let students mix vocational and general interests in their studies.
Since 2008, commerce, IT, architecture, engineering and agriculture have all lost enrolment share, while health fields, education and science have gained enrolment share (Figure 5). Trends in science, IT and engineering are considered in more detail in chapter 10. Because overall enrolments increased significantly in this period (Figure 3), no discipline had fewer students in 2014 than it had in 2008.
0% 10% 20% 30% 40% 1982 1992 2002 2012 2014 17–19 y/o 20–29 y/o
Figure 5: Domestic enrolment share by field of education, 2008 and 2014
Notes: Shows enrolments in undergraduate and postgraduate non-research courses. ‘Agriculture’ includes environmental courses. The categories have been re-organised from the standard ABS fields of education to align more closely with the way universities are typically organised. Economics is included in commerce. Humanities, social sciences and communication and media studies are included in arts. ‘Medicine, dental’ includes veterinary science. Large groups in ‘other health’ include rehabilitation and public health. Students in combined or double degrees have had both fields of education counted. Source: Department of Education and Training (2015g)
International students
International students have long studied at Australian
universities, but in small numbers until the 1990s. Before then, international enrolments were often part of Australia’s overseas aid, wholly or partly subsidised by the Commonwealth.42 From
1986, universities were allowed to take international students at fees they set and kept. Double-digit growth rates quickly became the norm, promoted at times by migration policies favouring former international students.43 Australian universities have also
established branch campuses overseas, or partnered with education providers in other countries to deliver Australian courses.44
In 2014, 347,560 international students were enrolled with Australian higher education providers (Figure 6). Of these, 85,873 are enrolled offshore, with about three-quarters in Singapore, Malaysia or China. Counting only onshore students, about one in five students in Australian universities is an
international student. Half of all international students are
enrolled in commerce-related courses. Other major fields include engineering (9 per cent) and 8 per cent for each of humanities, health and information technology.45
42 Meadows (2011). A limited number of international students from developing
countries still receive scholarships to study in Australia.
43 Spinks and Koleth (2016) has an overview of migration policy changes. 44 See Ziguras and McBurnie (2015), especially chapters 6 and 7. 45 See the notes to Figure 5.
0 10 20 30 Agriculture Architecture Medicine, dental Information technology Creative arts Law Engineering Nursing Science Other health Education Commerce Arts 2008 2014
Figure 6: International students enrolled in Australian higher education, 1988–2014
Thousands
Note: Figures from 2001 onwards are based on full year enrolments, prior years are based on enrolments as at 31st March.
Sources: DEEWR (2000); Department of Education and Training (2015m)
Australian universities enrol students from most countries, but the largest numbers come from Asian nations (Table 2). Since 2001, enrolments from China have grown more than twelve-fold. They now make up over a quarter of all international students in Australian higher education.
After a slowdown between 2010 and 2013, international student numbers recovered to reach a new peak in 2014. Initial figures for 2016 suggest that it will set another record.46
Table 2: Top ten international student source countries, 2001/2014
2001 2014
Singapore 18,277 China 99,341 Malaysia 16,344 Singapore 34,325 Hong Kong 15,719 Malaysia 29,051 Indonesia 9,619 India 25,386
China 8,018 Vietnam 18,989
India 5,485 Hong Kong 13,568 United States 3,548 Indonesia 11,381
Thailand 3,259 Nepal 8,912
Taiwan 2,687 United States 6,666
Norway 2,527 Pakistan 6,284
Sources: Department of Education and Training (2015m) and predecessor publication.
Full and part-time enrolment
Most undergraduate students are enrolled full-time. Since 2001 the proportion of undergraduates studying full-time has
increased, but since 2010 has tapered off slightly, to 76 per cent in recent years (Figure 7). Postgraduate students are much less likely to study full-time, but an upward trend is apparent for them, reaching 38 per cent in 2014. Eighty-four per cent of international students study full-time, partly reflecting visa requirements for onshore students.
46 Department of Education and Training (2016b), data to May 2016. However,
this increase is not reflected in visa data to 31 March 2016: Department of Immigration and Border Protection (2016d)
0 50 100 150 200 250 300 350 400 1988 1993 1998 2003 2008 2013
Figure 7: Proportion of domestic students enrolled full-time, 2001– 2014
Per cent
Note: Full-time enrolment is defined as 75 per cent or more of a normal one year study load.
Source: Department of Education and Training (2015m)
The rise of off-campus study
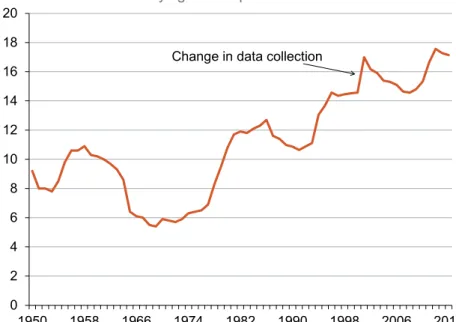
Studying off-campus is not new in Australia. Originally carried out by correspondence, distance education has never fallen below 5 per cent of total enrolments. As Figure 8 shows, the proportion of students studying off-campus has increased since the early 1990s to 17 per cent in 2014 (the drop from 2000 was due largely to declining international student off-campus enrolments). The small decrease in 2014 is due to a significant fall in student
numbers at Open Universities Australia; in the rest of the higher education sector the off-campus share is growing.
Since 2001, students whose enrolment mixes on and off-campus study have been included in a separate ‘multi-modal’
classification. By 2014, nearly ten per cent of students were enrolled on a multi-modal basis. Combined with external enrolments, more than a quarter of students study off-campus. Although more students are studying off-campus, the distinctions between on- and off-campus study are blurred. In 2014, more than a third of students enrolled on campus reported doing half or more of their study online.47 Some universities provide
physical study centres for their online students, which offer computers, study rooms, and other services to assist their education.
Several factors are likely to explain these changes. Improved educational technology via the internet has made off-campus study easier. This technological change coincided with increased demand for postgraduate study, often from people with
significant work and family responsibilities. Not having to travel to campus makes study easier for this group. In comparison, school leavers generally prefer face-to-face tuition.48 Funding policy
47 2014 Student Experience Survey: Department of Education and Training
(2015g)
48 In 2014, 91 per cent of domestic bachelor-degree students who completed
school in 2013 were enrolled on-campus. By contrast, 45 per cent of postgraduate coursework students aged 31-60 were enrolled on-campus: Student enrolment statistics, ibid.
0 20 40 60 80 100 2001 2003 2005 2007 2009 2011 2013 Undergraduate Postgraduate
changes have made it easier for public universities to offer more undergraduate online courses.49
Figure 8: Proportion of students studying off campus, 1950–2014 Per cent of students studying off campus
Notes: Multimodal students not included; Open Universities Australia included. Dip from mid-1960s caused by the incorporation of non-university institutions into the statistical series; dip from mid-1980s influenced by moving nursing courses from hospitals to universities; 1994-2000 headcount discounted by 3.7 per cent to reduce the effect of possible double counting of OUA students.
Sources: DEEWR (2000); Department of Education and Training (2016f); (various years-c)
49 Kemp and Norton (2014), p 47
Who is studying?
Universities used to be places mainly for men. In the 1950s, only about one in five university students was female. But in the late 1950s women started a 50-year run of consistent annual gains in enrolment share, which has now stabilised at about 58 per cent. Women have been a majority of university students since 1987 (Figure 9).
There are many reasons why this has happened: the overall social position of women has improved; entry into occupations dominated by women (teaching and nursing) now requires higher education qualifications; girls outperform boys at school; and young men have better-paying vocational education options than young women.
Despite their long-standing overall majority in higher education enrolments, women are still an official ‘equity’ group in disciplines where they are a minority of students, such as engineering and information technology. Other equity groups include students with disabilities, Indigenous students, regional and remote students, non-English speaking background students who arrived in the last decade, and low socio-economic status (SES) students. 0 2 4 6 8 10 12 14 16 18 20 1950 1958 1966 1974 1982 1990 1998 2006 2014 Change in data collection
Figure 9: Proportion of enrolments by gender (domestic students), 1949–2014
Per cent
Sources: DEEWR (2000); Department of Education and Training (2015m)
Over the long term, higher education attainment has increased across all SES groups, high and low. For example, by 2001 the children of manual workers born in the 1970s had nearly five times the higher education attainment of the children of manual workers born in the 1950s. The higher education attainment level of children of ‘upper service’ workers increased by about two-thirds in the same period.50
50 Marks and Macmillan (2007). See also Group of Eight (2014b).
Despite these increases, SES differences in university participation remain large. Table 3 reports on educational participation or attainment of people aged 20-24 in 2014,
classified according to their parent’s occupation. It shows that 20 per cent of the children of machinery operators, drivers and labourers were in higher education or had a degree. By contrast, 57 per cent of the children of managers and professionals were enrolled in or had completed higher education. All groups have increased their attainment since 2009.51
Table 3: Level of highest education enrolment or attainment for 20–24 year olds, by parent’s occupation, 2014
Parent occupation Highest qualification or enrolment of children (20-24) Managers & professionals Technicians & trade workers Community, clerical & sales workers Machinery operators, drivers & labourers Bachelor degree or above 57% 28% 39% 20% Certificate III - Advanced diploma 25% 38% 35% 38%
Certificate I-II, Year
12, or below 18% 34% 26% 42%
Note: Where parents had different occupations, the occupation requiring the highest skill level was used.
Source: HILDA (2015)
How are students chosen?
Every child has a right to a place at a government school. But universities do not accept everyone who wants to attend.
51 See the analysis presented in Norton and Cherastidtham (2014b), p 28, using
ABS (2011).Similar patterns are evident based on parental education: Hancock, et al. (2016), p 14. 0 10 20 30 40 50 60 70 80 90 100 1949 1962 1975 1988 2001 2014 Males Females
Successful school completion is generally the minimum requirement. In the early 1950s, any school completer who applied to a university was accepted.52 As student demand grew
more quickly than university funding, university places had to be restricted. In recent years universities have been able to take unlimited numbers of bachelor degree students (section 6.2.1), narrowing the gap between applicant and offer numbers (Figure 10). But generally universities still restrict entry, reflecting capacity constraints, course academic requirements, and prestige factors.
Typically, places in over-subscribed courses are allocated based on prior academic performance. The better an applicant’s past academic results, the better their chance of being awarded a place. Several ideas lie behind the practice of academic ranking: that student places should be given to those most likely to complete; that places should be given to those most likely to get high marks; that academic performance is a fair way of
distinguishing between otherwise similar applicants; and that an admission system should minimise complexity and expense for both applicants and universities. These ideas do not always lead to the same conclusions about how to choose students.
52 Poynter and Rasmussen (1996), p 184-185
Figure 10: Unique applicants and offers, 2010–2015 Thousands of applicants and offers
Notes: This data counts applicants rather than applications. The same person can apply in more than one state, and both through tertiary admissions centres and direct to a higher education provider. The 2015 Year 12 cohort for Western Australia is smaller than previous years due to a change in the school starting age in 2003. Because of this, there are fewer applicants and offers in 2015 than would have been the case if this change had not occurred.
Source: Department of Education and Training (2015n) 200 240 280 320 360 400 2010 2011 2012 2013 2014 2015 Applicants Offers
The most frequently used source of information on past
academic performance is school results. Most domestic school leavers are admitted to university based on their secondary education, with their Australian Tertiary Admission Rank (ATAR) usually playing an important role.53 The ATAR ranks school
leavers in their age cohort between 0 and 99.95. For example, an ATAR of 80 means that the student did better in year 12 than 80 per cent of their age cohort, including people who did not finish school. ATARs below 30 are just reported as ‘less than 30’. More low-ATAR students are admitted to university now than in the past, but ATAR and university attendance are still closely linked. In 2015, more than 23,000 school leavers with an ATAR of 90 or more accepted an offer of a university place, compared to less than 4,000 school leavers with an ATAR of 50 or less.54
University participation rates are similar across different socio-economic backgrounds once ATAR is taken into account (Figure 11). Differences in Year 12 completion and performance explain much of the difference in university participation by social background shown in Table 3.55
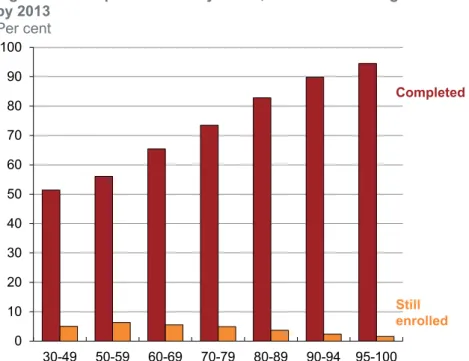
There is a strong relationship between ATAR and eventual completion of a course (Figure 12). After nine years, 95 per cent of students with an ATAR of 95 or more had completed a degree. By comparison, completion rates for students with an ATAR below 50 were just over half, with another 5 per cent of the commencing cohort still enrolled.
53 Formerly called ENTER in Victoria, UAI in NSW, and TER in other
jurisdictions except Queensland, which kept its OP system. The OP system will be replaced by ATAR in 2018.
54 Department of Education and Training (2015n), appendix table A8.1 55 Norton (2016)
Figure 11: ATAR, socio-economic status and university participation, 2012
Note: The chart shows university participation rates by 2012 for young people who were in Year 9 in 2006.
Source: Grattan analysis of Longitudinal Survey of Australian Youth: NCVER (2014). 0% 10% 20% 30% 40% 50% 60% 70% 80% 90% 100% 30 to less than 50 50 to less than 70 70 to less than 80 80 to less than 90 90 to less than 100 High SES Medium SES Low SES
Figure 12: Completion rates by ATAR, 2005 commencing students by 2013
Per cent
Note: The course completed is not necessarily the course started in 2005. Source: Department of Education and Training (2015c)
ATAR is less successful at identifying which applicants will get high marks.56 Many students get higher marks at university than
their school results would suggest, while many others get lower marks. For a given ATAR, students from non-selective
government schools tend to get better university grades than students from private schools or government selective schools.57
School and university grades are influenced by factors other than
56 James, et al. (2009); Palmer, et al. (2011).
57 James, et al. (2009), chapter 3; Li and Dockery (2014)
underlying academic ability. It is therefore not surprising that ATAR is an imperfect guide to university prospects.
The limitations of ATAR-based admissions are well-known in the higher education sector. In practice, higher education providers use ATARs in a flexible way. Where ATAR is used for selection there is typically a published ‘cut off’ or ‘clearly in’ rank above which every applicant receives an offer. However, many
applicants are admitted below this rank. Some universities award ‘bonus’ ATAR points for characteristics such as social
background. Applicants can receive special consideration for personal circumstances such as health problems that may affect school results. An inquiry is examining the transparency of selection criteria.58
At some universities, an undergraduate general admission test for school leavers, UniTest, supplements rather than replaces chool result-based admission systems.59 Mature-age applicants
can sit the Specialised Tertiary Admissions Test (STAT).60
About a quarter of commencing bachelor-degree students apply based on previous higher education study. These include students who attended pathway colleges that award undergraduate diplomas, students switching courses or universities, or students returning for a second degree. More
58 Higher Education Standards Panel (2016)
59 There are no national statistics on how widely used these tests are. In 2014,
12 per cent of the total commencing undergraduate students who completed school in 2013 were admitted based on something other than their secondary school results: Department of Education and Training (2015g).
60 For a study of STAT’s predictive value see Coates and Friedman (2010).
0 10 20 30 40 50 60 70 80 90 100 30-49 50-59 60-69 70-79 80-89 90-94 95-100 Completed Still enrolled