The Impact of Medical Technology on
Medicare Spending
September 2015
Prepared for the
Advanced Medical Technology Association
TABLE OF CONTENTS
Executive Summary 3
The Impact of Medical Technology on Medicare Spending 4
Objectives and Approach 5
Findings 7 Discussion 13 Conclusion 15 Appendix A: USN&WR Top Technology Hospitals 16 References 18
EXECUTIVE SUMMARY
Hospital investments in new diagnostics, medical and surgical devices, drugs, and procedures can yield long-term clinical and economic benefits for patients and providers. Improvements in the quality and efficient delivery of patient care leads to reductions in adverse patient outcomes, such as long stays in hospitals and high rates of unplanned readmissions and complications, and avoidance of financial penalties. Within the United States (U.S.) healthcare system, however, medical innovation is often cited as a major driver of rising healthcare costs, and some analysts have concluded that slowing the adoption and utilization of new technology is a key strategy necessary to control overall spending. This proposition, however, has not been tested empirically.
Directly and meaningfully measuring the aggregate effect of medical technology across the U.S. healthcare system is challenging. Currently, there is no standard definition for what constitutes an “innovative medical technology” and no standard measure of the adoption and use of innovative technologies across or within settings of healthcare. To explore the relationship between technology adoption and spending (i.e., payments), we evaluated the Medicare spending per beneficiary (MSPB) score, a Centers for Medicare & Medicaid Services (CMS) measure of hospital efficiency, among the “top technology” hospitals, as identified by U.S. News and World Report (USN&WR).1
Our analysis found that, on average, Medicare spending for the most technology-intense hospitals matched the national rate for all other hospitals. However, top technology hospitals have a higher percentage of hospitals with spending rates that are lower than the national average. Approximately 65 percent of top technology hospitals have average MSPB below the national average compared to 56 percent of the non-top technology hospitals. Additionally, when top technology hospitals are compared with a comparable group of larger hospitals having more than 200 beds, Medicare spending for top technology hospitals is significantly lower than other large hospitals.
There are many factors, beyond technology adoption, that may impact Medicare spending. Further, hospitals that have a high technology adoption rate may also exhibit other factors that could impact Medicare spending. Although this study adjusted for teaching status and number of hospital beds, it did not examine the impact of other hospital characteristics or practice patterns.
These findings suggest that many of the leading health systems in the U.S. have been able to adopt the latest medical advances and provide technology-intensive care, while not driving up Medicare spending. In view of the immense value of advances in medical technology in improving patient outcomes and the process of care, as well as the availability of other tools to reduce health expenditures, policies that seek to control costs by limiting adoption of medical technology may be counterproductive.
THE IMPACT OF MEDICAL TECHNOLOGY ON MEDICARE
SPENDING
Background
The U.S. spends more on healthcare services than any other country in the world.2 In
addition to factors such as an aging population, lack of care coordination, and a fragmented healthcare system, medical innovation is often cited as a major driver of rising healthcare costs.3,4,5,6,7,8 As hospitals are under increasing pressure to improve quality and contain
costs, many are evaluating the impact that innovative medical technology has on their overall spending.
Currently, there is no standard definition for what constitutes an “innovative medical technology” and no standard measure of the adoption and use of innovative technologies across or within settings of healthcare. Medical technology may include small, single-use implantable devices used in surgical procedures; diagnostic tests; large, multi-use systems such as imaging equipment; minimally invasive surgical systems; and electronic information management systems. A sample of the types of medical technologies used in today’s hospital setting is presented in Table 1.
Table 1: Examples of Advanced Technologies Used in Hospital Setting
Type of Technology Examples
Diagnostics
Advanced imaging equipment
Intraoperative MRIs PET/CT scanners
Ultrasound imaging devices Tele-radiology
Diagnostic testing Genetic testing
Point-of-care-testing
Surgical Devices and Systems
Single-use implantable devices
Artificial joints
Cardiac implantable electronic devices Peripheral and coronary stents
Minimally invasive surgical systems
Laparoscopic surgical systems and techniques Interventional radiology
Proton therapy
Assessing the financial impact of medical innovation is complex. Over the years, various approaches have been used to understand the relationship between new technology and healthcare spending. However, the current body of literature is either focused narrowly on the impact of individual medical technologies on direct healthcare expenditures within a specific patient population or therapy area, or focused broadly on the proportion of U.S. healthcare spending driven by technology without taking into account impact on clinical outcomes.9,10,11,12,13,14 Directly and meaningfully measuring the aggregate effect of medical
advances, however, is difficult and studies are limited. The objective of this study was to help fill this gap by exploring the relationship between use of innovative technologies at U.S. hospitals and Medicare payments.
OBJECTIVES AND APPROACH
The objectives of our assessment were to:• Evaluate the impact of innovative technology adoption on Medicare spending, and
• Better understand how hospital decision-makers evaluate and adopt new technology.
Top Technology Hospitals
U.S. News and World Report (USN&WR), as part of its “Best Hospitals” reporting series, has created a proprietary scoring system to identify the “top technology” hospitals in the U.S. The composite score is based on a hospital’s offering of key technologies and advanced care expected from a “best hospital, offered either onsite or offsite.”15 The ranking system
Type of Technology Examples
Electronic Information Management
Healthcare IT
Electronic medical records (EMRs) Physician ordering systems Patient portals
Supply management systems Radio frequency ID
includes availability of technologies and services such as advanced imaging equipment, robotic surgery, transplantation services, and radiation therapy, and covers a broad range of therapeutic areas including (but not limited to) cardiology, ear/nose/throat, nephrology, and oncology. Implementation and use of EMRs are not included in USN&WR’s technology evaluation.
USN&WR evaluations are conducted at the hospital facility level and rankings are refreshed every two years. Due to the sampling design, hospitals included in the survey are primarily large teaching hospitals; small community hospitals without a teaching affiliation and federal hospitals are not included in the sample. In USN&WR’s 2012–2013 analysis of more than 1,800 hospitals, 55 hospitals (3 percent) met the criteria for a top technology hospital.
Medicare Spending per Beneficiary (MSPB)
To assess whether Medicare spending per beneficiary (MSPB) for large teaching hospitals offering the latest technological advances differs from other hospitals, including small community-based providers, we examined per-patient spending among all Medicare-eligible hospitals in 2012–2013. We obtained each hospital’s MSPB score from the Centers for Medicare & Medicaid Services (CMS) Hospital Compare database.16
The Affordable Care Act required CMS to add efficiency measures, including MSPB, to the Hospital Value-Based Purchasing Program. The MSPB score is expressed as a ratio relative to 1 and may be used to indicate whether the average spending per Medicare beneficiary for patients treated at the hospital is higher or lower than the national average. For example, if the national score is 1, a hospital score less than 1 indicates the spending per patient is lower than the national median; conversely, a value greater than 1 would indicate that the spending is above the national median.
Medicare Spending per Beneficiary
MSPB ratios are calculated based on the price-standardized and risk-adjusted Medicare Part A and B spending three days prior to admission through 30 days post discharge for a hospital’s patients compared to the national median. Hospitals with a ratio less than 1 are considered to have
The MSPB is a standardized, case mix-weighted rate of Medicare payments for all Part A and B services provided to Medicare fee-for-service (FFS) beneficiaries from 3 days prior to admission through 30 days post-discharge. CMS risk-adjusts the measure for age and severity of illness. In addition, CMS price-standardizes Medicare payments to remove the effect of geographic payment differences, add-on payments for indirect medical education, and disproportionate share adjustments. Notably, CMS includes new technology add-on payments in the MSPB calculation.
Interviews with Hospital Executives
To supplement the analysis of Medicare spending, we conducted one-hour interviews with five senior executives from the top technology hospital cohort to better understand their practices and perspectives on the adoption of new technologies, and best practices in balancing use of new technologies and hospital economics. Although the objectives of this evaluation were shared with interviewees, the detailed approach (e.g., use of MSPB, definition of “top technology” hospitals) and findings were not disclosed.
FINDINGS
A total of 3,261 acute care hospitals are included in the 2012 CMS Hospital Compare database and were included in our assessment. Hospitals were stratified into two mutually exclusive groups:
1. Top technology hospitals: identified by USN&WR as having one of the highest advanced technology scores in 2012–2013 (Appendix A); and
2. Other hospitals (Medicare eligible)
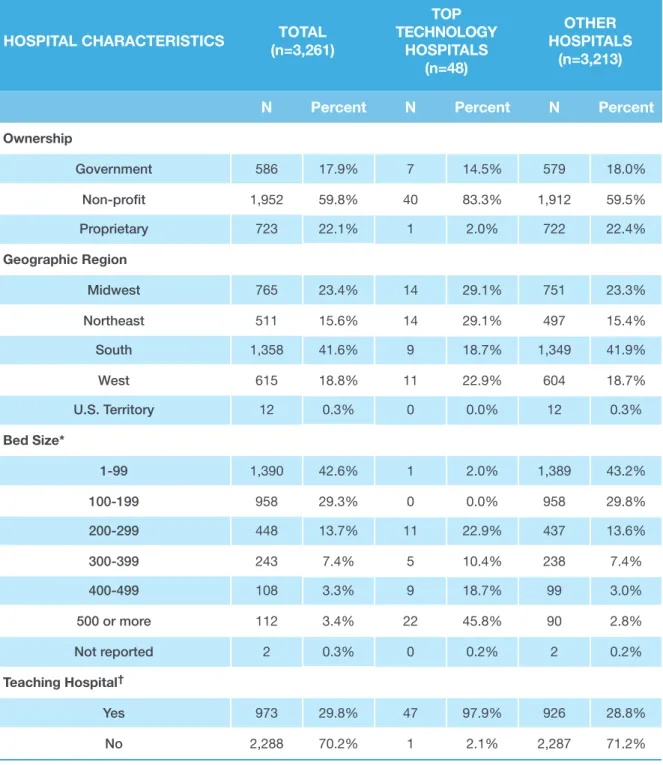
Of the 55 top technology hospitals identified by USN&WR, 7 hospitals were excluded from our analysis due to the absence of an MSPB score in the Hospital Compare database. Forty-eight top technology hospitals and 3,213 other hospitals were included in our assessment (Table 2).
In general, the top technology hospitals tended to have a larger capacity compared with the other hospitals. For example, nearly 43 percent of the “other hospitals”’ have fewer than 100 beds versus only 2 percent of hospitals in the top technology cohort. Approximately 98 percent of top technology hospitals have at least 200 beds versus 27 percent for other hospitals.i The majority of top technology hospitals are teaching hospitals (97.9%), whereas
the majority of hospitals in the other cohort are non-teaching hospitals. The geographic distribution of the top technology hospitals is relatively even (Figure 1).
i Notably, the only top technology hospital with fewer than 100 beds at the time the study was conducted, New England Baptist Hospital in Boston, Massachusetts, is a specialty hospital that focuses exclusively on orthopedic surgery and treatment of musculoskeletal disease.
Table 2: Hospital Characteristics
*Bed size is derived from information captured in Medicare hospital cost reports.
†Hospital identified as a teaching hospital based on presence of Medicare indirect medical education (IME) adjustment factor for 2013. The IME adjustment factor is calculated using a hospital’s ratio of residents to beds, and the amount of IME payment that a hospital receives is dependent upon the number of residents the hospital trains and the current level of the IME multiplier.
HOSPITAL CHARACTERISTICS (n=3,261)TOTAL
TOP TECHNOLOGY HOSPITALS (n=48) OTHER HOSPITALS (n=3,213)
N Percent N Percent N Percent
Ownership Government 586 17.9% 7 14.5% 579 18.0% Non-profit 1,952 59.8% 40 83.3% 1,912 59.5% Proprietary 723 22.1% 1 2.0% 722 22.4% Geographic Region Midwest 765 23.4% 14 29.1% 751 23.3% Northeast 511 15.6% 14 29.1% 497 15.4% South 1,358 41.6% 9 18.7% 1,349 41.9% West 615 18.8% 11 22.9% 604 18.7% U.S. Territory 12 0.3% 0 0.0% 12 0.3% Bed Size* 1-99 1,390 42.6% 1 2.0% 1,389 43.2% 100-199 958 29.3% 0 0.0% 958 29.8% 200-299 448 13.7% 11 22.9% 437 13.6% 300-399 243 7.4% 5 10.4% 238 7.4% 400-499 108 3.3% 9 18.7% 99 3.0% 500 or more 112 3.4% 22 45.8% 90 2.8% Not reported 2 0.3% 0 0.2% 2 0.2% Teaching Hospital† Yes 973 29.8% 47 97.9% 926 28.8% No 2,288 70.2% 1 2.1% 2,287 71.2%
Figure 1. Geographic Distribution of Top Technology Hospitals
MSPB Comparison
The average MSPB scores are the same among top technology hospitals versus all other Medicare-eligible hospitals (0.98 and 0.98, respectively, p=0.87) (Table 3). Median scores also were similar between cohorts. Among the top technology hospitals, the MSPB values were tightly clustered around the mean (range: 0.90–1.04), whereas MSPB scores for the other hospitals were more dispersed, ranging from 0.53 (indicating spending well below the national average) to 1.66 (indicating spending far above the national average).
Table 3: Medicare Spending Among Medicare Eligible Hospitals
Source: Avalere assessment of 2012 Hospital Compare data; Top technology hospital sample identified via USN&WR and further limited to hospitals with a valid MSPB score for 2012.
COMPARISON GROUP SAMPLE
SIZE MSPB MEAN MSPB MEDIAN MSPB MIN, MAX
Top Technology Hospitals 48 0.9800 0.9800 [0.90, 1.04]
Other Hospitals 3,213 0.9809 0.9800 [0.53, 1.66]
Table 4: Top Technology Hospitals with Medicare Spending Below National Average
Other Hospitals Top Technology Hospitals
100 80 60 40 20 0 % of Hospitals
MSPB Below National Average 65
56
Approximately 65 percent of top technology hospitals have average MSPB below the national average (Figure 2) compared with 56 percent of the non-top technology hospitals. Those hospitals with MSPB scores below the national average are listed in Table 4. Further, none of the 48 top technology hospitals has MSPB scores in the highest quintile.
Figure 2. Percentage of Top Technology Hospitals and Other Hospitals with Medicare Spending Below National Average
HOSPITAL NAME HOSPITAL LOCATION MSPB SCORE
UC Davis Medical Center Sacramento, CA 0.90
Mayo Clinic, Phoenix Phoenix, AZ 0.91
Mayo Clinic, Methodist Rochester, MN 0.92
Abbott Northwestern Hospital Minneapolis, MN 0.93
Mayo Clinic, Saint Marys Rochester, MN 0.94
HOSPITAL NAME HOSPITAL LOCATION MSPB SCORE Froedtert Hospital and the Medical College of
Wisconsin Milwaukee, WI 0.95
Magee-Womens Hospital of UPMC Pittsburgh, PA 0.95
NY-Presbyterian Univ. Hospital of Columbia and
Cornell New York, NY 0.95
Ochsner Medical Center New Orleans, LA 0.95
University of Colorado Hospital Aurora, CO 0.95
University of Washington Medical Center Seattle, WA 0.95
University of Wisconsin Hospital and Clinics Madison, WI 0.95
Wake Forest Baptist Medical Center Winston-Salem, NC 0.95
Emory University Hospital Atlanta, GA 0.96
Rush University Medical Center Chicago, IL 0.96
Mount Sinai Hospital New York, NY 0.97
UC San Diego Medical Center San Diego, CA 0.97
UCSF Medical Center San Francisco, CA 0.97
Barnes-Jewish Hospital/Washington University Saint Louis, MO 0.98
Houston Methodist Hospital Houston, TX 0.98
Lancaster General Hospital Lancaster, PA 0.98
UCLA Medical Center Los Angeles, CA 0.98
University of Iowa Hospitals and Clinics Iowa City, IA 0.98
University of Kansas Hospital Kansas City, KS 0.98
Vanderbilt University Medical Center Nashville, TN 0.98
Beaumont Hospital Grosse Pointe, MI 0.99
Cleveland Clinic Cleveland, OH 0.99
Hospitals of the University of
Pennsylvania-Penn Presbyterian Philadelphia, PA 0.99
Keck Medical Center of USC Los Angeles, CA 0.99
Table 5: Medicare Spending Among Hospitals with More than 200 Beds
Source: Avalere assessment of 2012 Hospital Compare data; Top technology hospital sample identified via USN&WR and further limited to hospitals with a valid MSPB score for 2012.
Interviews with Top Technology Hospitals
Senior executives at five top technology hospitals stated that their organizations work closely with clinicians to adopt innovative technologies that are safe, effective, and yield favorable economics. They indicated key considerations for new technology adoption, which included:
• Ability to improve patient outcomes
• Impact on hospital revenue and profitability
• Prestige associated with technology/procedure
• Impact on patient referrals
In evaluating new technologies, hospital executives often consider the ability of a technology to increase hospital referrals and overall procedure volume, as increased volume may offset part of the start-up costs associated with a new technology. Hospitals also consider the
COMPARISON GROUP SAMPLE
SIZE MSPB MEAN MSPB MEDIAN MSPB MIN, MAX Top Technology Hospitals, >200 Beds
(All Teaching Hospitals) 47 0.9794 0.9800 [0.90, 1.04]
Other Hospitals, >200 Beds
(Non-Teaching and Teaching Hospitals) 864 1.0033 0.9800 [0.67, 1.26] Teaching Hospitals Only, >200 Beds 531 0.9956 1.0000 [0.73, 1.21] Subgroup Analyses
We performed a subgroup analysis among larger hospitals (i.e., at least 200 beds) and the top technology hospitals. We found that the top technology hospitals had lower mean MSPB scores compared with the other hospitals—a statistically significant difference (0.9794 versus 1.0033, respectively, p<0.0001). We further compared the top technology hospitals having at least 200 beds (all of which are teaching hospitals) with other large teaching hospitals and results were consistent (0.9794 versus 0.9956, respectively, p<0.0043). (Table 5)
impact a technology will have on their reputation and prestige. Hospitals may be more willing to adopt a technology, even at a high cost, if adoption would make the hospital a market leader and contribute positively toward the hospital’s reputation. Hospital executives also noted that they are more likely to adopt a new technology if they would be the first and only hospital system within their market to do so.
Executive interviewees from the top technology hospitals indicated that they evaluate the financial return on investment of a new technology prior to and following adoption. Depending on the technology, hospital executives may evaluate the impact of a technology on the profitability of a specific procedure, a 30-day episode of care, or the annual
department or hospital budget. In addition, hospital executives consider the “halo effect,” the ability of a new technology to increase revenue beyond the procedure itself. The halo effect can include pre- and post-procedures tests, imaging, and other services utilized by the patients and their families.
Once a technology is adopted, hospital executives reported they often implement measures to contain operating costs. Cost containment measures may include enhanced discharge protocols or internal gainsharing models that enable participants to share in the savings when certain cost and quality metrics are achieved. For technologies that require large capital investments such as imaging or robotic technology, hospitals may also consider alternative payment strategies such as leasing agreements, participation in clinical trials, and pilot programs to manage costs.
DISCUSSION
Medical innovation is often noted as one reason for escalating healthcare costs. However, our assessment suggests that adopting new technology does not increase Medicare payments, as measured by the MSPB. Further, among larger hospitals, Medicare spending may actually be lower for top technology hospitals compared with other large hospitals. There are several possible explanations for the comparable Medicare spending between top technology hospitals and other hospitals. Adoption of innovative technologies may result in cost offsets or cost savings by reducing complications and health resource use, influencing recovery time and patterns of post-acute care, and driving overall efficiencies. In addition, top technology hospitals are likely more adept at evaluating and integrating new technologies into their institutions. Hospital executives noted that many top technology hospitals have implemented formal processes to evaluate, approve, and manage the integration of new technology into the delivery of patient care. Moreover, there are many influences on costs other than technology; hospitals that are high utilizers of technology may also be more sophisticated in reducing costs unrelated to technology.
With increasing efforts to control healthcare costs in the acute and post-acute care settings, there is a high demand for medical technologies and services that improve healthcare quality and drive efficient use of resources. This analysis focused on Medicare spending as patients with primary Medicare coverage account for the largest proportion of U.S. hospital spending (46%) and hospital stays (39%).17 Hospital costs were not the focus of this analysis and future
research might explore the association between top technology hospitals and hospital costs. New payment and delivery models such as value-based purchasing and accountable care organizations (ACOs) have expanded hospitals’ focus to consider system-wide savings over an entire episode of care rather than a single hospitalization at one institution. New and emerging payment and delivery models that are focused primarily on short-term savings may have the unintended consequence of hindering providers from adopting and using medical technology innovations. Models that account for use of high-cost technologies and focus on overall and longer-term savings throughout the acute and post-acute care period may encourage the adoption of new technologies and improve patient access to high-quality care. There are a few noteworthy limitations to our assessment. In identifying top technology hospitals, USN&WR only considered large teaching hospitals and academic medical centers, with a few exceptions for specialty hospitals, and did not consider large community non-teaching hospitals. However, in our subgroup analysis, when we included only non-teaching hospitals with at least 200 beds, we continued to observe lower MSPB scores in the top technology hospital cohort versus the other hospitals. An additional limitation of the
USN&WR methodology is that the list of technologies and procedures used to identify top technology hospitals may not have been comprehensive and could have excluded certain technologies considered to be new and innovative.
The MSPB score was created by CMS as a metric for hospital efficiency for use in the inpatient value-based purchasing program. The MSPB score is limited to utilization by Medicare FFS beneficiaries and also includes spending for physician and post-acute care services within 30 days of the acute hospitalization. Given that the MSPB metric standardizes Medicare MS-DRG payments to remove the effect of variations in wages and teaching payments across hospitals, the variation in MSPB scores in this analysis may be driven, in part, by post-discharge healthcare utilization. The specific impact of new technology on these patterns of care may warrant further research.
We also note that factors other than the adoption of innovative technology can contribute to healthcare spending that can affect the MSPB measure. For example, differences in practice patterns, patient demographics, hospital staffing composition, procedure mix, post-acute care variation, and geographic region all affect spending. We were not able to adjust for these factors in our evaluation. Finally, although spending was similar between top technology and other hospitals, we were not able to evaluate patient outcomes or the quality of care provided at the hospitals.
CONCLUSION
This assessment suggests that Medicare spending is similar among top technology and other hospitals in the U.S., and spending for top technology hospitals may be lower than other large hospitals. The results provide valuable insight into the potential economic benefits of adoption and use of medical technology. In particular, it suggests that providing technology intensive healthcare to patients is not incompatible with cost savings or the efficient delivery of care. Additional research is needed to further validate these findings and to assist policymakers in better understanding the relationship between new technology adoption and its impact on overall health spending and patient outcomes.
HOSPITAL NAME HOSPITAL LOCATION STATE
Abbott Northwestern Hospital Minneapolis MN
Barnes-Jewish Hospital/Washington University St. Louis MO
Baylor University Medical Center Dallas TX
Beaumont Hospital Grosse Pointe MI
Brigham and Women's Hospital Boston MA
Cedars-Sinai Medical Center Los Angeles CA
Cleveland Clinic Cleveland OH
Duke University Hospital Durham NC
Emory University Hospital Atlanta GA
Florida Hospital Orlando Orlando FL
Fox Chase Cancer Center (Temple Univ. Health) Philadelphia PA
Froedtert Hospital and the Medical College of
Wisconsin Milwaukee WI
Hospital for Special Surgery New York NY
Hospitals of the University of
Pennsylvania-Penn Presbyterian Philadelphia PA
Houston Methodist Hospital Houston TX
Keck Medical Center of USC Los Angeles CA
Lancaster General Hospital Lancaster PA
Magee-Womens Hospital of UPMC Pittsburgh PA
Massachusetts General Hospital Boston MA
Mayo Clinic, Methodist Rochester MN
Mayo Clinic, Phoenix Phoenix AZ
Mayo Clinic, Saint Marys Rochester MN
Mount Sinai Hospital New York NY
New England Baptist Hospital Boston MA
HOSPITAL NAME HOSPITAL LOCATION STATE
Northwestern Memorial Hospital Chicago IL
NY-Presbyterian Univ. Hospital of Columbia and
Cornell New York NY
NYU Langone Medical Center New York NY
Ochsner Medical Center New Orleans LA
Ronald Reagan UCLA Medical Center Los Angeles CA
Rush University Medical Center Chicago IL
Santa Monica-UCLA Medical Center
Orthopaedic Hospital Santa Monica CA
Stanford Hospital and Clinics Stanford CA
Texas Heart Institute at St. Luke's Episcopal
Hospital Houston TX
Thomas Jefferson University Hospital Philadelphia PA
UC Davis Medical Center Sacramento CA
UC San Diego Medical Center San Diego CA
UCSF Medical Center San Francisco CA
University Hospitals Case Medical Center Cleveland OH
University of Colorado Hospital Aurora CO
University of Iowa Hospitals and Clinics Iowa City IA
University of Kansas Hospital Kansas City KS
University of Michigan Hospitals and Health
Centers Ann Arbor MI
University of Washington Medical Center Seattle WA
University of Wisconsin Hospital and Clinics Madison WI
UPMC-University of Pittsburgh Medical Center Pittsburgh PA
Vanderbilt University Medical Center Nashville TN
Wake Forest Baptist Medical Center Winston-Salem NC
REFERENCES
1 U.S. News & World Report Best Hospitals 2012-13. Copyrighted 2015. U.S. News & World Report. 117347:0715JM. 2 Organization for Economic Cooperation and Development. OECD Health Statistics 2014. How does the United States compare? Available at: http://www/oecd.org./united states/briefing-note-United-States-2014.pdf
3 Shrestha LB, Heisler EJ. The changing demographic profile of the United States. Congressional Research Service Report for Congress. 2011. Available at: https://www.fas.org/sgp/crs/misc/RL32701.pdf
4 High and Rising Costs of Health Care in the U.S. The Challenge: Changing the Trajectory. Alliance for Health Reform. http:// www.allhealth.org/publications/Alliance_for_Health_Reform_121.pdf (Accessed June 30, 2015.)
5 A CBO paper. Technological Change and the Growth of Health Care Spending. Congressional Budget Office, January 2008. Available at: http://www.cbo.gov/sites/default/files/01-31-techhealth.pdf (Accessed June 30, 2015.)
6 PricewaterhouseCoopers. The Factors Fueling Rising Healthcare Costs 2008. Prepared for America’s Health Insurance Plans, December 2008. Available at: https://www.ahip.org/uploadedFiles/Content/News/Press_Room/2008/Resources/ TheFactorsFuelingRisingHealthcareCosts2008.pdf (Accessed June 30, 2015.)
7 Newhouse JP. Medical care costs: how much welfare loss? Journal of Economic Perspectives. 1992;6(3):3-21.
8 Robert Wood Johnson Foundation. What are the biggest drivers of cost in U.S. health care? Health Policy Snapshot. Issue brief. July 2011. Available at: http://www.rwjf.org/content/dam/farm/reports/issue_briefs/2011/rwjf71331 (Accessed June 30, 2015.)
9 Sorenson C, Drummond M, Khan B. Medical technology as a key driver of rising health expenditure: disentangling the relationship. Clinicoecon Outcomes Res. 2013;5:223-34.
10 Cutler D, McClellan M. Is technological change in medicine worth it? Health Affairs. 2001;20(5):11-29.
11 Skinner J, Staiger D, Fisher E. Is technological change in medicine always worth it? The case of acute myocardial infarction. Health Affairs. 2006;2:w34-w47.
12 Baker L, Birnbaum H, Geppert J, Mishol D, Moyneur E. The relationship between technology availability and health care spending. Health Affairs. 2003;W3:537-551.
13 Donahoe G, King G. Estimates of Medical Device Spending in the United States. June 2014. Available at: http://advamed.org/ res.download/684 (Accessed August 10, 2015.)
14 Milken Institute. Healthy Savings: Medical Technology and the Economic Burden of Disease. July 2014. Available at: http:// advamed.org/res.download/714 (Accessed August 10, 2015.)
15 Methodology: U.S. News & World Report Best Hospitals 2012-13. Available at: http://www.usnews.com/pubfiles/7- 17AdultMethReport2012_Final.pdf
16 The MSPB score is labeled as the Medicare Spending per Patient Rate within the downloadable Hospital Compare data. 17 Moore B (Truven Health Analytics), Levit K (Truven Health Analytics), Elixhauser A (AHRQ). Costs for Hospital Stays in the United States, 2012. HCUP Statistical Brief #181. October 2014. Agency for Healthcare Research and Quality, Rockville, MD. Available at: http://www.hcup-us.ahrq.gov/reports/statbriefs/sb181-Hospital-Costs-United-States-2012.pdf
Avalere is a vibrant community of innovative thinkers dedicated to solving the challenges of the healthcare system. We deliver a comprehensive perspective, compelling substance, and creative solutions to help you make better business decisions. We partner with stakeholders from across healthcare to help improve care delivery through better data, insights, and strategies. For more information, please contact info@avalere.com. You can also visit us at
avalere.com.
About Us
Contact Us
Avalere Health1350 Connecticut Ave, NW Suite 900 Washington, DC 20036
202.207.1300 | Fax 202.467.4455 avalere.com