1
Risk exposure density explains mileage bias in older driver crash risk Short Title: Risk exposure density explains mileage bias
Word Count (excluding Abstract, Acknowledgment, or References): 3,499 Abstract Word Count: 199
Corresponding and lead author who will approve galleys and answer questions during editing: Dr. Jonathan J. Rolison, PhD Department of Psychology University of Essex Essex, CO4 3SG, UK Tel: +44 (0)1206 874882 Email: jrolison@essex.ac.uk Co-author details: Dr. Salissou Moutari, PhD
School of Mathematics and Physics Queen’s University Belfast
Belfast, BT7 1NN, UK Tel: +44 (0)28 9097 1920 Email: s.moutari@qub.ac.uk
List of abbreviations: Relative risk (RR) Confidence interval (CI)
© The Author(s) 2017. Published by Oxford University Press on behalf of the Johns Hopkins Bloomberg School of Public Health. This is an Open Access article distributed under the terms of the Creative Commons
Attribution License (http://creativecommons.org/licenses/by/4.0), which permits unrestricted reuse, distribution, and reproduction in any medium, provided the original work is properly cited.
ORIGINAL
UNEDITED
2 ABSTRACT
Driver crash rates per mile indicate high crash risk in older age. A reliance on mileage alone may underestimate risk exposure of older drivers as they tend to avoid highways and travel more on non-freeways (e.g., urban roads) that present greater hazards. We introduce risk exposure density as an index of exposure that incorporates mileage, frequency of travel, and travel duration. Population-wide driver fatalities in the U.S. during 2002–2012 were assessed per driver age (16–20, 21–29, 30–39, 40–49, 50–59, 60–69, >70 years) and gender. Mileage, frequency, and duration of travel per person were used to assess risk exposure. Mileage-based fatal crash risk increased greatly among male (RR=1.73; 95% CI:1.62,1.83) and female (RR=2.08; 95% CI:1.97,2.19) drivers from age 60–69 years to age >70 years. Adjusting for their density of risk exposure, fatal crash risk increased only slightly from age 60–69 years to age >70 years among male (RR=1.09; 95% CI:1.03,1.15) and female (RR=1.22; 95%
CI:1.16,1.29) drivers. While ubiquitous in epidemiology research, mileage-based assessments can produce misleading accounts of driver risk. Risk exposure density incorporates multiple components of travel and reduces bias caused by any single indicator of risk exposure.
ORIGINAL
UNEDITED
3
Each year, motor vehicle collisions cause more than 1.2 million deaths (1),
compromising the health and well-being of injury survivors and the families of injury victims (2). They also draw heavily on public funds through the burden they place on medical care and emergency services and through loss of productivity (3). Tighter legislation and public awareness campaigns can reduce collisions, but reliable risk indices are needed to target drivers who are at greatest risk.
How should we assess driver risk? A traditional method has been to calculate crash rates per unit of travel (e.g., annual mileage [4-6]). More travel is believed to come with greater exposure to risk. Crash rates are intended to control for differences in risk exposure for group comparison in crash risk. This traditional method has led to reports of high crash risk among young and elderly drivers (5,7-10), focussing road safety campaigns and legislation on the youngest and oldest drivers (10-12). Graduated licensing systems restrict the travel of the youngest drivers and in many countries elderly drivers must apply regularly for renewal of their driver’s license (12,13).
However, crash rates are not independent of travel patterns (14). Drivers who have high annual mileage tend to have a lower crash rate than that of lower mileage drivers (15-18). This ‘low-mileage bias’ may help explain high apparent crash rates of older drivers. In Langford et al.,the crash rate of low-mileage drivers was sixfold the crash rate of high-mileage drivers (18). Among driver groups with medium to high annual high-mileage, the crash rate of older drivers was no greater than that of other age ranges. The crash rate increased in older age only among low-mileage drivers.
One prominent explanation for the low-mileage bias is that low-mileage groups contain a high proportion of impaired older drivers (17-19). Visual impairment (20) and mild cognitive impairment (21) in older drivers are associated with poorer driving ability and increased risk of crash involvement. Older drivers with visual or cognitive impairment tend to
ORIGINAL
UNEDITED
4
report driving less than unimpaired older drivers (22,23). Yet, in Langford et al., crash rates were higher for all driver age ranges in the low-mileage group compared to medium- and high-mileage groups (18). Visual or cognitive driver impairment in older age would fail to explain a general tendency for higher apparent crash risk in low-mileage groups.
Another possibility is that drivers who have high annual mileage accumulate more miles on freeways and rural roads, whereas low-mileage drivers travel more on other road networks, such as urban networks (15,16,19). Urban environments present greater hazards to drivers due to their higher number of points of potential conflict (e.g., intersections, stops in traffic flow) per distance travelled (16, 19). Low-mileage drivers conduct more of their travel in urban areas than do high-mileage drivers (24). Greater exposure to more hazardous driving conditions on urban roads may explain the higher crash rates of low mileage drivers (16). This possibility would also explain why crash rates are higher in low-mileage groups across all driver age ranges (18). Counterintuitively, low-mileage drivers may actually have a higher exposure to risk than high-mileage drivers if a greater amount of their travel is made on urban roads.
Two assumptions can be made about the travel pattern of drivers who frequently travel on urban road networks. First, they should on average travel shorter distances per trip, because fewer miles per trip are accumulated on non-freeways than on freeways and rural roads (25). Thus, drivers who more regularly use non-freeways should have a lower travel distance per trip relative to other drivers. Second, their average travel time per mile should be higher relative to other drivers, because travel speed is typically much higher on freeways and rural roads than on urban networks (25).
On the basis of these two assumptions, it can be inferred that the drivers who are most exposed to risk—by driving on non-freeways (e.g., urban roads)—should have both a low average travel distance per trip and a high average travel time per mile. In other words, the
ORIGINAL
UNEDITED
5
risk exposure density of a driver group, i, is equal to annual travel time divided by annual travel distance (i.e., mileage), multiplied by annual travel frequency (i.e., trips), such that
(1) . frequency distance time density exposure Risk i i i i
In the current study, we investigated driver fatal crash risk on the basis of age
differences in density of risk exposure. We hypothesized that (a) if older drivers travel more on non-freeways than do middle-aged drivers, then risk exposure density should increase in older age; and (b) if greater travel on non-freeways explains high crash rates of older drivers, then fatal crash risk should no longer increase in older age after accounting for age
differences in risk exposure density. Data sources
Data were collected on population-wide single- and two-car driver fatalities recorded in the United States, during 2002–2012. The data were extracted for all single-car collisions, in which the driver was fatally injured. For two-car collisions, the data were extracted per each fatally injured driver. These data were provided by the United States Fatal Analysis Reporting System and concern all recorded vehicle collisions on public roads resulting in a driver fatality within 30 days of a collision.
Total annual travel was assessed according to driver age (16–20, 21–29, 30–39, 40– 49, 50–59, 60–69, >70 years) and gender. The U.S. National Household Travel Survey provided the annual trip numbers, annual mileage, and annual travel duration (in minutes) for each driver age range and gender. The U.S. National Household Travel Survey was
conducted in 2001 (51,059 drivers) and 2009 (152,857 drivers), during which the travel of each respondent was recorded over a 24-hour period. For our purposes, the travel data were averaged across the 2001 and 2009 data sets.
ORIGINAL
UNEDITED
6
Average travel per driver and driver numbers in each age range and gender were combined to estimate total travel in each driver group. Some drivers who hold a driver’s license do not actively drive, yielding biased estimates of driver numbers. To estimate the number of active drivers in each driver group, we calculated the proportion of active drivers in the U.S. National Household Travel Survey sample by dividing the number of drivers who made at least one trip during the survey period by the total number of drivers in the survey. Next, we multiplied the proportion of active drivers in the survey by the estimated number of licensed drivers in each driver group. Thus, the estimated number of active drivers reflected those who are actively engaged in driving.
Fatal crash risk estimation
The fatal crash rate of each driver group (i.e., age, gender), i, was estimated by dividing the annual fatal crash count of each group by its risk exposure, such that
(2) . exposure crashes rate Crash i i i
In Eq. 2, exposurei was equal to driver numbers multiplied by average trips per person (trip-based fatal crash risk), average mileage per person (distance-(trip-based fatal crash risk), or average travel duration per person (time-based fatal crash risk). In our estimate of density-based fatal crash risk, driver numbers were multiplied by risk exposure density (Eq. 1). Fatal crash risk was estimated annually and was re-scaled by dividing the value of each driver group by the largest value across driver groups, such that re-scaled fatal crash risk equalled 1 for the driver group with the highest fatal crash risk.
Statistical Analysis
Generalized linear Poisson regression with log-link modelling was conducted to assess age differences in annual travel frequency in trips per person, annual travel distance in miles per person, annual travel duration in minutes per person, and risk exposure density. In
ORIGINAL
UNEDITED
7
each regression model, age group was included as a factor. Age differences in travel distance (miles) per trip and travel time (minutes) per mile were assessed by including annual trips and annual miles as offset terms in the respective regression models. Beta regression analyses were conducted to estimate the relative risks and 95% confidence intervals (CIs) for age comparison in fatal crash risk.
Results
Demographics of travel
Annual travel frequency in trips per person increased gradually from age 16–20 years (male = 720 trips; female = 736) to age 40–49 years (male = 802 trips; female = 864 trips) among male (relative risk (RR) = 1.11, 95% confidence interval (CI): 1.01, 1.23) and female (RR = 1.17, 95% CI: 1.06, 1.30) drivers (Fig. 1A). Annual travel frequency did not decrease significantly in older age from age 60–69 years (male = 826 trips; female = 763) to age >70 years (male = 813 trips; female = 733 trips) among male (RR = 0.98, 95% CI: 0.89, 1.08) and female (RR = 0.96, 95% CI: 0.87, 1.06; Fig. 1A) drivers.
Annual travel distance in miles per person increased greatly among male drivers from age 16–20 years (5,557 miles) to age 40–49 years (9,151 miles; RR = 1.65, 95% CI: 1.59, 1.70; Fig. 1B). Annual travel distance increased to a lesser extent among female drivers from age 16–20 years (5,431 miles) to age 40–49 years (6,433 miles; RR = 1.18, 95% CI: 1.14, 1.23; Fig. 1B). In older age, annual travel distance decreased from age 60–69 years (male = 8,409 miles; female = 5,315 miles) to age >70 years (male = 6,258 miles; female = 3,821 miles) among male (RR = 0.74, 95% CI: 0.72, 0.77) and female (RR = 0.72, 95% CI: 0.69, 0.75; Fig. 1B) drivers.
Annual travel duration in minutes per person increased from age 16–20 years (male = 10,914 min; female = 10,820 min) to age 60–69 years among male drivers (15,882 min; RR = 1.46, 95% CI: 1.42, 1.49) and to age 40–49 years among female drivers (12,961 min; RR =
ORIGINAL
UNEDITED
8
1.20, 95% CI: 1.17, 1.23; Fig. 1C). Annual travel duration decreased in older age from age 60–69 years (male = 15,883 min; female = 11,846 min) to the >70 years age range (male = 14,111 min; female = 10,833 min) among male (RR = 0.89, 95% CI: 0.87, 0.91) and female (RR = 0.91, 95% CI: 0.89, 0.94; Fig. 1C) drivers.
Travel distance (miles) per trip increased greatly among male drivers from age 16–20 years (7.72 miles per trip) to age 21–29 years (11.46 miles per trip; RR = 1.49, 95% CI: 1.44, 1.54) and increased to a lesser extent among female drivers from age 16–20 years (7.38 miles per trip) to age 21–29 years (9.00 miles per trip; RR = 1.22, 95% CI: 1.18, 1.26; Fig. 1D). Travel distance per trip declined sharply from age 60–69 years (male = 10.19 miles per trip; female = 6.97 miles per trip) to age >70 years (male = 7.70 miles per trip; female = 5.21 miles per trip) among male (RR = 0.76, 95% CI: 0.73, 0.78) and female (RR = 0.75, 95% CI: 0.72, 0.78; Fig. 1D) drivers.
Travel time (minutes) per mile reduced slightly from age 16–20 years (men = 1.96 min per mile; women = 1.99 min per mile) to age 21–29 years (men = 1.73 min per mile; women = 1.86 min per mile) among male (RR = 0.88, 95% CI: 0.86, 0.91) and female (RR = 0.93, 95% CI: 0.91, 0.96) drivers, and rose greatly across older age ranges, especially from age 60–69 years (men = 1.89 min per mile; women = 2.23 min per mile) to age >70 years (men = 2.26 min per mile; women = 2.83 min per mile) for male (RR = 1.19, 95% CI: 1.17, 1.22) and female (RR = 1.27, 95% CI: 1.24, 1.31; Fig. 1E) drivers.
Risk exposure density is high when travel distance per trip is low and travel time per mile is high. Accordingly, risk exposure density decreased significantly from age 16–20 years (male = 1,414; female = 1,467) to age 21–29 years (male = 1,224; female = 1,380) among male drivers (RR = 0.87, 95% CI: 0.80, 0.93), but not among female drivers (RR = 0.94, 95% CI: 0.87, 1.01; Fig. 1F). Risk exposure density increased across older age ranges, especially from age 60–69 years (male = 1,559; female = 1,700) to age >70 years (male = 1,832; female
ORIGINAL
UNEDITED
9
= 2,078) among male (RR = 1.18, 95% CI: 1.10, 1.26) and female (RR = 1.22, 95% CI: 1.15, 1.30; Fig. 1F) drivers.
Fatal crash risk
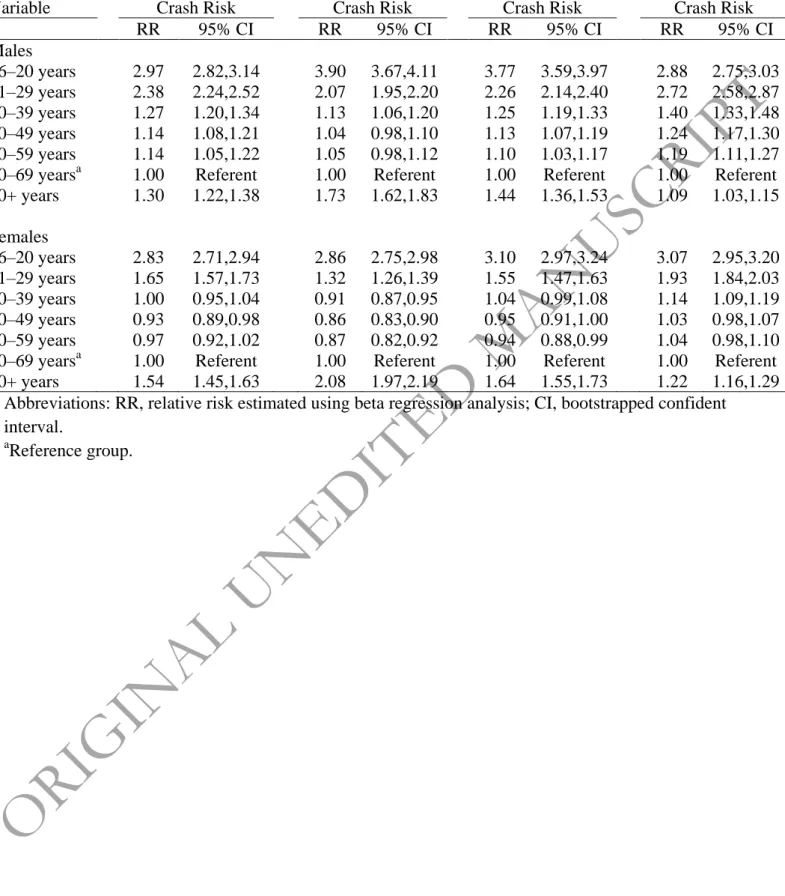
Trip-based fatal crash risk (Fig. 2A; Table 1) was 1.25 (95% CI: 1.22, 1.29), and 1.72 (95% CI: 1.67, 1.77) times greater among male and female 16- to 20-year-olds, respectively, compared to 21- to 29-year-olds and was 2.97 (95% CI: 2.82, 3.14) and 2.83 (95% CI: 2.71, 2.94) times greater compared to 60- to 69-year-olds. Trip-based fatal crash risk increased from age 60–69 years to age >70 years among male (RR = 1.30, 95% CI: 1.22, 1.38) and female (RR = 1.54, 95% CI: 1.45, 1.63) drivers.
Distance-based fatal crash risk (Fig. 2B; Table 1) was 1.89 (95% CI: 1.84, 1.93) and 2.17 (95% CI: 2.11, 2.23) times greater among male and female 16- to 20-year-olds,
respectively, compared to 21- to 29-year-olds and was 3.90 (95% CI: 3.67, 4.11) and 2.86 (95% CI: 2.75, 2.98) times greater compared to 60- to 69-year-olds. Distance-based fatal crash risk rose greatly from age 60–69 years to age >70 years among male (RR = 1.73, 95% CI: 1.62, 1.83) and female (RR = 2.08, 95% CI: 1.97, 2.19) drivers.
Time-based fatal crash risk (Fig. 2C; Table 1) was 1.67 (95% CI: 1.63, 1.71) and 2.01 (95% CI: 1.95, 2.06) times greater among male and female 16- to 20-year-olds, respectively, compared to 21- to 29-year-olds and was 3.77 (95% CI: 3.59, 3.97) and 3.10 (95% CI: 2.97, 3.24) times greater compared to drivers in the 60–69 years age range. Time-based fatal crash risk increased in older age and was 1.44 (95% CI: 1.36, 1.53) and 1.64 (95% CI: 1.55, 1.73) times greater among male and female >70-year-olds, respectively, compared to their 60- to 69-year-old counterparts.
Density-based fatal crash risk (Fig. 2D; Table 1) decreased little among male drivers from age 16–20 years to age 21–29 years (RR = 0.94; 95% CI: 0.92, 0.96) but decreased greatly from age 21–29 years to age 60–69 years (RR = 2.72; 95% CI: 2.58, 2.87).
Density-ORIGINAL
UNEDITED
10
based fatal crash risk was 1.59 (95% CI: 1.55, 1.63) times greater among 16- to 20-year-old female drivers compared to 21- to 29-year-olds and was 3.07 (95% CI: 2.95, 3.20) times greater compared to 60- to 69-year-olds. The density-based fatal crash risk of >70-year-olds was only slightly higher than that of 60- to 69-year-olds among male (RR = 1.09; 95% CI: 1.03, 1.15) and female (RR = 1.22; 95% CI: 1.16, 1.29) drivers.
Discussion
Age differences in driver risk have traditionally been assessed on the basis of crash rates per unit of travel (e.g., annual mileage [4-6]). An underlying assumption of this
approach is that with greater travel comes greater exposure to risk. Yet, older drivers regulate their travel in various ways, such as by avoiding night-time driving and poor weather, and by avoiding highways (24-27). In general, more miles are accumulated on freeways and rural roads than on non-freeways. Thus, although older drivers may have lower annual mileage, they may actually be more exposed to risk than other drivers by conducting more of their travel on non-freeways, such as urban roads, that present more hazardous driving conditions (19).
In the current study, we introduced risk exposure density, an index of risk exposure that incorporates annual mileage, travel frequency, and travel duration. When crash risk was based on mileage alone, risk increased greatly in older age (>70 years) compared to 60–69 year olds (Fig. 2B), reflecting findings of previous reports (6,7). Conversely, when based on risk exposure density, which takes account of the travel pattern, driver crash risk increased only marginally (Fig. 2D). The small age-related increase in crash risk may reflect increased susceptibility to fatal injury, rather than risk of crash involvement, in the elderly (5). Our findings imply that driver fatality risk does not increase greatly in older age and that risk indices based on annual mileage alone can present a misleading picture of driver risk by failing to account for travel patterns.
ORIGINAL
UNEDITED
11
License renewal policies used in the United States to screen for driver impairment have an unintended outcome of discouraging unimpaired older drivers from renewing their driver’s license (13). Loss of driving privileges compromises mobility, which negatively affects health and well-being in older age (28,29). Medical warnings from physicians to their patients are associated with reduction in elderly driver arrivals to emergency departments due to road traffic collisions but are also associated with an increase in visits for depression (30). Policy makers must balance a need to safeguard road users from potential harm with the benefits of maintaining mobility in older age. Our current findings imply that previous assessments of driver risk, based on annual mileage, may have exaggerated the dangers of driving in older age.
Annual mileage increased from age 16–20 years to age 21–29 years, which alone implies that the youngest drivers were less exposed to risk. However, risk exposure density was higher among 16- to 20-year-olds than among 21- to 29-year-olds, owing to their lower mileage per trip and greater travel time per mile. Consequently, density-based crash risk decreased by a small amount from age 16–20 years to age 21–29 years in comparison with estimates of distance-based crash risk based on mileage alone. This finding suggests that previous assessments of driver risk may have exaggerated dangers faced by the youngest drivers.
High annual mileage drivers tend to have a lower crash rate than that of drivers who travel fewer miles per year. Evidence for this ‘low-mileage bias’ was provided by samples in which drivers involved in collisions could be stratified by their travel patterns (e.g., mileage [15,17,18]). In these studies, researchers were able to assess age trends in crash rates for low-, medium-, and high-mileage bands. At the national level, national travel surveys are used to adjust for demographic differences in travel (e.g., age, gender) when assessing road accident reports. These databases do not enable drivers involved in collisions to be stratified according
ORIGINAL
UNEDITED
12
to their personal travel patterns. Consequently, existing databases do not make it possible to assess driver crash risk per mileage category and adjust directly for a ‘low-mileage bias’. Our approach provides a step toward improving the reliability of national crash risk assessments by incorporating multiple components of travel to reduce bias caused by any single indicator of risk exposure.
Our study has limitations. First, our approach combines multiple components of travel to estimate driver risk exposure. This approach cannot replace existing methods of crash risk assessment in countries that do not record multiple components of travel in their national travel surveys. However, these data are recorded in the U.S. National Household Travel Survey (NHTS) and thus we recommend that road safety researchers and policy makers adopt our approach in future assessments of driver risk in the United States. Second, we proposed that travel on urban road networks is characterised by shorter distances per trip and higher travel time per mile than travel on freeways and rural roads. Our approach does not enable us to distinguish travel on freeways and rural roads. Older adults may further differ from drivers in other age ranges in their use of rural roads verses freeways. Third, we focussed our current investigation on fatally injured drivers. Motor vehicle collisions are more often fatal at high speed. Yet, we proposed that drivers who conduct more of their travel on high-speed
freeways and rural roads are less exposed to risk of fatal crashes than drivers who avoid these road networks. One explanation is that although travelling at high speed raises the likelihood a collision is fatal, there are far fewer collision opportunities per mile on freeways and rural roads than on urban networks and thus many miles can be accrued on freeways and rural roads with few collision opportunities. An avenue for future research would be to compare fatal and non-fatal crash risks according to trip-, distance-, time-, and density-based indices of exposure. Finally, we did not assess driver frailty or susceptibility to physical injury. The high apparent crash risk in younger and older drivers compared to other driver ages reduced
ORIGINAL
UNEDITED
13
after adjusting for their density of risk exposure. Yet, our approach does not enable us to unpick the contribution of crash risk and frailty to age trends in risk of fatal injury.
In conclusion, our study reveals that traditional assessments of driver risk based on annual mileage alone can provide misleading risk assessments. We incorporated annual mileage, travel frequency, and travel duration to account for travel patterns and revealed that driver risk does not increase greatly in older age. Risk to youngest drivers was also reduced after taking account of their travel pattern. Policy makers should be cautious when
interpreting the results of mileage-based assessments of driver risk. Age trends in apparent risk depend both on the method of risk assessment used as well as the index of risk exposure.
Acknowledgements: Author affiliations:
Jonathan J Rolison, PhD, Department of Psychology, University of Essex, Wivenhoe Park, Colchester, CO4 3SQ, UK. Email: jrolison@essex.ac.uk; Tel:01206 874882.
Salissou Moutari, PhD, School of Computing and Mathematics, Queen’s University Belfast, Belfast, BT7 1NN, UK. Email: s.moutari@qub.ac.uk; Tel: 02890 971920.
Funding:
The research was supported by a grant awarded by the UK Engineering and Physical Sciences Research Council (EPSRC Reference; EP/M017877/1; “A new metric for the assessment of driver crash risks”).
Conflict of interest statement:
The authors have no conflicts of interest.
ORIGINAL
UNEDITED
14 References
1. World Health Organization. Global status report on road safety 2015. World Health Organization, Geneva, Switzerland.
http://www.who.int/violence_injury_prevention/road_safety_status/2015. Accessed April 20, 2017.
2. Donaldson LH, Brooke K, Faux SG. Orthopaedic trauma from road crashes: Is enough being done? Aust Health Rev. 2009;33(1):72–84.
3. Dalal K, Lin Z, Gifford M, Svanström L. Economics of global burden of road traffic injuries and their relationship with health system variables. Int J Prev Med.
2013;4(12):1442–1450.
4. Beck LF, Dellinger AM, O'neil ME. Motor vehicle crash injury rates by mode of travel, United States: Using exposure-based methods to quantify differences. Am J Epidemiol.
2007;166(2):212–218.
5. Li G, Braver ER, Chen LH. Fragility versus excessive crash involvement as
determinants of high death rates per vehicle-mile of travel among older drivers. Accid
Anal Prev. 2003;35(2):227–235.
6. Massie DL, Green PE, Campbell KL. Crash involvement rates by driver gender and the role of average annual mileage. Accid Anal Prev. 1997;29(5):675–685.
7. Massie DL, Campbell KL, Williams AF. Traffic accident involvement rates by driver age and gender. Accid Anal Prev. 1995;27(1):73–87.
8. Rolison JJ, Hewson PJ, Hellier E, Hurst L. Risks of high-powered motorcycles among younger adults. Am J Public Health. 2013;103(3):568–571
9. Rolison JJ, Hewson PJ, Hellier E, Husband P. Risk of fatal injury in older adult drivers, passengers, and pedestrians. J Am Geriatr Soc. 2012;60(8):1504–1508.
ORIGINAL
UNEDITED
15
10. National Highway Traffic Safety Administration. Traffic safety facts 2012: Older population [on-line]. National Highway Traffic Safety Administration, Washington DC.
http://www-nrd.nhtsa.dot.gov/Pubs/812005.pdf. Updated May 2014. Accessed April 20 2017.
11. Carr DB, Ott BR. The older driver with cognitive impairment: it’s a frustrating life.
JAMA. 2010;303(16):1632–1641.
12. Chen L-H, Baker SP, Guohua L. Graduated driver licensing programs and fatal crashes of 16-year-old drivers: a national evaluation. Pediatrics. 2006;118(1):56–62.
13. Ross LA, Browning C, Luszcz MA, et al. Age-based testing for driver’s license renewal: potential implications for older Australians. J Am Geriatr Soc.
2011;59(2):281–285.
14. Rolison JJ, Moutari, S, Hewson PJ, Hellier E. Overestimated crash risks of young and elderly drivers. Am J Prev Med. 2014;46(1):58–64.
15. Hakamies-Blomqvist L, Raitanen T, O’Neill, D. Driver ageing does not cause higher accident rates per km. Transport Res F Traffic Psychol Behav. 2002;5(4):271–274. 16. Janke MK. Accidents, mileage, and the exaggeration of risk. Accid Anal Prev.
1991;23(2-3):183–188.
17. Langford J, Koppel S, McCarthy D, Srinivasan S. In defence of the ‘low-mileage bias’. Accid Anal Prev. 2008;40(6):1996–1999.
18. Langford J, Methorst R, Hakamies-Blomqvist L. Older drivers do not have a high crash risk—A replication of low mileage bias. Accid Anal Prev. 2006;38(3):574–578.
19. Keall MD, Frith WJ. Older driver crash rates in relation to type and quantity of travel. Traffic Inj Prev. 2004;5(1):26–36.
ORIGINAL
UNEDITED
16
20. Owsley C, Ball K, McGwin Jr G, Sloane ME, Roenker DL, White MF, Overley ET. Visual processing impairment and risk of motor vehicle crash among older adults.
JAMA. 1998;279(14):1083–1088.
21. Wadley VG, Okonkwo O, Crowe M, Vance D, Elgin J, Ball K, Owsley C. Mild
cognitive impairment and everyday function: an investigation of driving performance. J
Geriatr Psychiatry Neurol. 2009;22(2):87–94.
22. Alvarez FJ, Fierro I. Older drivers, medical condition, medical impairment and crash risk. Accid Anal Prev. 2008;40(1):55–60.
23. Ball K, Owsley C, Stalvey B, Roenker DL, Sloane ME, Graves M. Driving avoidance and functional impairment in older drivers. Accid Anal Prev. 1998;30(3):313–322. 24. Charlton JL, Oxley J, Fildes B, Oxley P, Newstead S, Koppel S, O’Hare M.
Characteristics of older drivers who adopt self-regulatory driving behaviours. Transport
Res F Traffic Psychol Behav. 2006;9(5):363–373.
25. Langford J, Koppel S. A tale of two surveys: Explaining older drivers’ low mileage bias. Paper presented to the Australasian Road Safety Research, Policing and Education Conference, Wellington, New Zealand, 13–16 Nov 2005.
26. Donorfio LK, D'Ambrosio LA, Coughlin JF, Mohyde M. Health, safety, self-regulation and the older driver: It's not just a matter of age. J Safety Res. 2008;39(6):555–561. 27. Moták L, Gabaude C, Bougeant J-C, Huet N. Comparison of driving avoidance and
self-regulatory patterns in younger and older drivers. Transport Res F Traffic Psychol
Behav. 2014;26(Part A):18–27.
28. Oxley J, Whelan M. It cannot be all about safety: the benefits of prolonged mobility.
Traffic Inj Prev. 2008;9(4):367–378.
29. Kaplan GA. Where do shared pathways lead? Some reflections on a research agenda.
Psychosom Med. 1995;57(3):208–212.
ORIGINAL
UNEDITED
17
30. Redelmeier RD, Yarnell CJ, Thiruchelvam D, Tibshirani RJ. Physicians’ warnings for unfit drivers and the risks of trauma from road crashes. New Engl J Med.
2012;367(13):1228–1236.
ORIGINAL
UNEDITED
18
Table 1. Male and female trip-based, distance-based, time-based, and density-based relative crash risks in the United States, 2002–2012. Variable Trip-Based Crash Risk Distance-Based Crash Risk Time-Based Crash Risk Density-Based Crash Risk RR 95% CI RR 95% CI RR 95% CI RR 95% CI Males 16–20 years 2.97 2.82,3.14 3.90 3.67,4.11 3.77 3.59,3.97 2.88 2.75,3.03 21–29 years 2.38 2.24,2.52 2.07 1.95,2.20 2.26 2.14,2.40 2.72 2.58,2.87 30–39 years 1.27 1.20,1.34 1.13 1.06,1.20 1.25 1.19,1.33 1.40 1.33,1.48 40–49 years 1.14 1.08,1.21 1.04 0.98,1.10 1.13 1.07,1.19 1.24 1.17,1.30 50–59 years 1.14 1.05,1.22 1.05 0.98,1.12 1.10 1.03,1.17 1.19 1.11,1.27 60–69 yearsa 1.00 Referent 1.00 Referent 1.00 Referent 1.00 Referent 70+ years 1.30 1.22,1.38 1.73 1.62,1.83 1.44 1.36,1.53 1.09 1.03,1.15 Females 16–20 years 2.83 2.71,2.94 2.86 2.75,2.98 3.10 2.97,3.24 3.07 2.95,3.20 21–29 years 1.65 1.57,1.73 1.32 1.26,1.39 1.55 1.47,1.63 1.93 1.84,2.03 30–39 years 1.00 0.95,1.04 0.91 0.87,0.95 1.04 0.99,1.08 1.14 1.09,1.19 40–49 years 0.93 0.89,0.98 0.86 0.83,0.90 0.95 0.91,1.00 1.03 0.98,1.07 50–59 years 0.97 0.92,1.02 0.87 0.82,0.92 0.94 0.88,0.99 1.04 0.98,1.10 60–69 yearsa 1.00 Referent 1.00 Referent 1.00 Referent 1.00 Referent 70+ years 1.54 1.45,1.63 2.08 1.97,2.19 1.64 1.55,1.73 1.22 1.16,1.29
Abbreviations: RR, relative risk estimated using beta regression analysis; CI, bootstrapped confident interval. a Reference group.
ORIGINAL
UNEDITED
MANUSCRIPT
19
Fig. 1. Annual travel frequency in trips (A), annual travel distance in miles (B), annual travel time in minutes (C), miles per trip (D), minutes per mile (E), and risk exposure density (F) by driver age range and gender. Grey indicates men and white indicates
women. Density equals time in minutes per distance in miles multiplied by frequency of trips. The data are average annual travel amounts in the United States during 2002–2012.
ORIGINAL
UNEDITED
20
Fig. 2. Trip-based (A), distance-based (B), time-based (C), and density-based (D) fatal crash risk by driver age range and gender. Grey indicates men and white indicates women. Fatal crash risks are based on annual 1-car and 2-car driver fatalities and annual travel and population numbers in the United States during 2002–2012.
ORIGINAL
UNEDITED
0 500 1,000 1,500 2,000 2,500 Density Age, years 0 250 500 750 1,000 Frequen cy , T rips Age, years 0 2,500 5,000 7,500 10,000 Distance, Miles Age, years 0 3,000 6,000 9,000 12,000 15,000 18,000 T ime, Minutes Age, years 0 5 10 15 M iles per T rip Age, years 0 1 2 3 Minutes per Mile Age, years A B C D E F
ORIGINAL
UNEDITED
MANUSCRIPT
0.0 0.2 0.4 0.6 0.8 1.0 Densit y -Based Cr ash Risk Age, years 0.0 0.2 0.4 0.6 0.8 1.0 Tr ip-B ased Cr ash Risk Age, years 0.0 0.2 0.4 0.6 0.8 1.0 Dist ance-Based Cr ash Risk Age, years 0.0 0.2 0.4 0.6 0.8 1.0 Tim e -B ased Cr ash Risk Age, years A B C D