Appendix
G
PSRC Regional POF Study
Route Financial Analysis
APPROACH
To help assess the feasibility of the seven potential routes selected for more detailed analysis, the operating profiles of each route were expanded to establish assumptions about operating conditions that are key cost drivers such as hours of operation, distances travels at what speed, and crewing requirements. Research was conducted to document current operator and industry cost and fuel consumption data. Annual expenditure projections were then developed using the route-specific operating and cost assumptions.
Assumptions made earlier in the study regarding fleet size and infrastructure requirements were used to identify capital needs. Research was conducted to establish current marine industry vessel and terminal construction costs. With this information, start-up capital investments estimates were prepared for each route.
However, expenditures tell only part of the story. While outside the scope of this analysis, a complete financial analysis should also include a revenue forecast. Ultimately, route feasibility will be determined by the level of cost recovery that can be realized through fares, other operating revenue, grants, and local funding sources.
ASSUMPTIONS
The assumptions for start-up capital requirements and operating costs are discussed below.
Start-Up Capital
VESSELSThe construction cost varies depending upon vessel size and operating speed. These estimates include design-build and direct construction management costs. Current maritime trends and operator experiences were drawn upon to establish estimates for three vessel types. All cost estimates are expressed in 2020 dollars.
Table 1 – Estimated Vessel Construction Costs
T Boat
Up to 150 Passengers
K Boat
Up to 250 Passengers1
28 knots 35 knots 35 knots
VESSEL BUILD
COST $ 6,360,000 $ 9,540,000 $ 14,840,000
1 K-Boat larger size to accommodate 200–250 passengers but outfitted for
TERMINALS
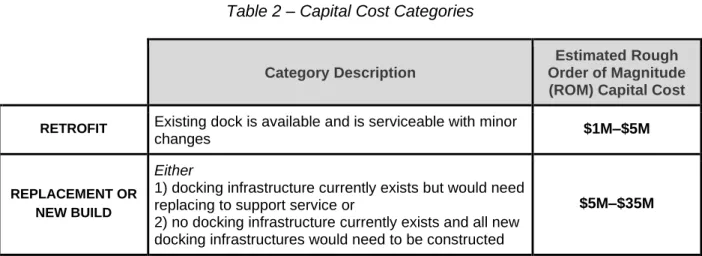
An assessment of identified POF landing sites was made to determine the minimum level of work required for docking infrastructure for landing one POF. The level of required work as discussed in Capital Costs – Landing Sites in the Analysis chapter of the study report and is classified into one of two categories:
Table 2 – Capital Cost Categories
Category Description
Estimated Rough Order of Magnitude (ROM) Capital Cost
RETROFIT Existing dock is available and is serviceable with minor
changes $1M–$5M
REPLACEMENT OR NEW BUILD
Either
1) docking infrastructure currently exists but would need replacing to support service or
2) no docking infrastructure currently exists and all new docking infrastructures would need to be constructed
$5M–$35M
Estimating the cost of purchasing or leasing suitable landing sites requires a more detailed level of market research than was possible within the scope of this project.
Operating Expenditures
Annual operating costs were projected to reflect the operating characteristics of each route. Route-specific operating characteristics include vessel type, fleet size, service and vessel
operating hours, vessel crewing and terminal staffing requirements, and fuel consumption rates. Annual operating costs include the direct costs associated with operating and maintaining the service, such as labor, fuels, and materials, as well as fixed costs such as insurance,
management, and overhead. All cost estimates are expressed in 2020 dollars.
SERVICE TYPE AND OPERATING HOURS
Six of the seven routes evaluated are classified as commute routes for this assessment. This means there is the potential for sufficient year-round, daily weekday travel demand between business/employment centers and residential communities to support a morning and an evening commute service. There may also be potential for mid-day, evening, or weekend service, but this assessment focused on commute period service.
Service profiles
One of the routes, Bellingham to Friday Harbor, is classified as seasonal daily service. The distinction from commute service being that service is not focused on the morning and evening commute periods but rather offers less frequent service throughout the day, seven days a week. Low ridership potential for daily commute travel and adverse sea and weather conditions during part of the year make this route unsuitable for the more traditional commute-level service.
Fleet size
The longer travel times for two of the routes, Tacoma to Seattle and Renton to South Lake Union, mean these routes must operate two vessels to support three round trips during the morning and afternoon service periods. All other routes can support three round trips with one vessel in service.
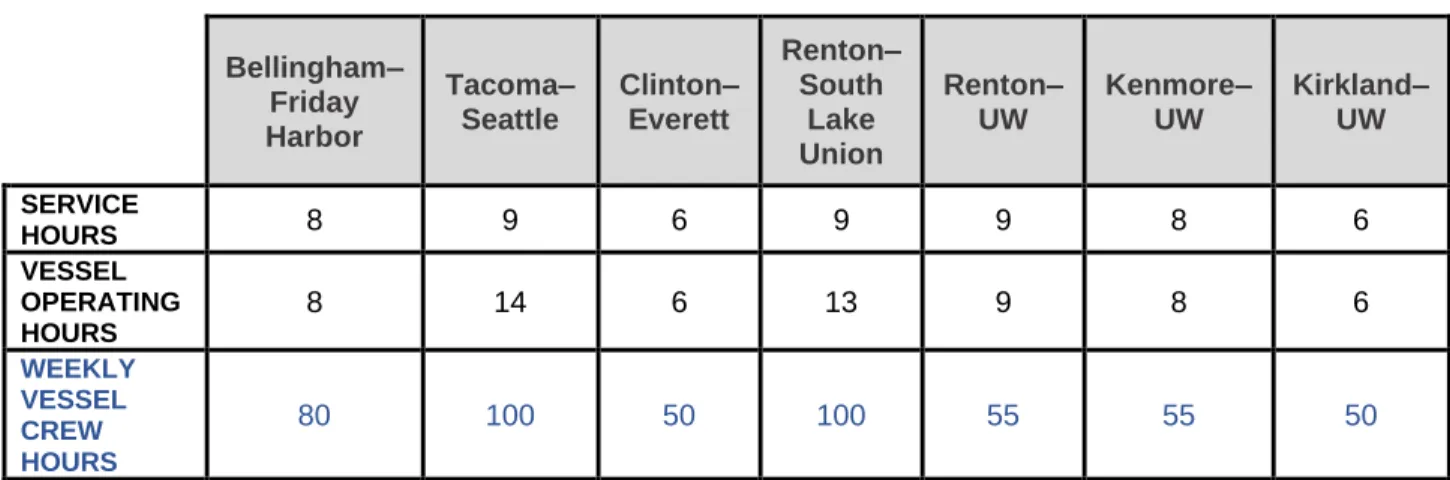
Table 3 – Route Service and Operating Hours
Bellingham– Friday Harbor Tacoma– Seattle Clinton– Everett Renton– South Lake Union Renton– UW Kenmore– UW Kirkland– UW SERVICE HOURS 8 9 6 9 9 8 6 VESSEL OPERATING HOURS 8 14 6 13 9 8 6 WEEKLY VESSEL CREW HOURS 80 100 50 100 55 55 50
OPERATING AND MAINTENANCE LABOR
Three categories of labor are included in these financial projections: deck, vessel maintenance and shoreside passenger management and information.
It is assumed that all proposed vessels will be a single deck and United States Coast Guard-approved crewing levels will be a master and two deckhands. Labor rates for the Lake Washington routes have been set at current King County Metro Marine (KC) rates. The labor rates on all other routes are set at the average rate of the two current Puget Sound passenger ferry operators: KC and Kitsap Transit Fast Ferries (KT). Crew schedules were developed taking into account each route's operating hours, number of vessels in service, fueling arrangements, and maritime labor rules.
Table 4 – Vessel Deck Labor Expenditures
Bellingham– Friday Harbor Tacoma– Seattle Clinton– Everett Renton– South Lake Union Renton– UW Kenmore– UW Kirkland– UW ANNUAL DECK CREW HOURS 2,080 5,100 2,550 5,100 2,805 2,805 2,550 WEIGHTED CREW HOURLY RATE $ 208.74 $ 208.74 $ 208.74 $ 231.26 $ 231.26 $ 231.26 $ 231.26 ANNUAL DECK LABOR COST 1 $ 534,000 $1,159,000 $ 627,000 $1,159,000 $ 680,000 $ 680,000 $ 627,000
Maintenance labor requirements were established at levels commensurate with KC and KT rates. A marine engineer or marine mechanic is assumed for each route, plus an oiler/helper for each vessel on service on the route. See Table 6 below.
Eight hours of shoreside labor is assumed for each route evenly distributed between the morning and evening for commute routes.
FUEL
For this analysis, it is assumed that all vessels will be diesel propelled. Fuel consumption is a function of vessel operating speeds, travel times, dwell times, and number of vessels operating. Daily fuel consumption rates were calculated for each route reflecting these route operating characteristics. Annual fuel expenditures for the lake routes were estimated using the average price per gallon paid by KC in 2020. For all other routes, fuel expenditures were estimated using a price that averages the prices paid by both KC and KT in 2020.
Table 5 – Annual Fuel Expenditures
Bellingham– Friday Harbor Tacoma– Seattle Clinton– Everett Renton– South Lake Union Renton– UW Kenmore– UW Kirkland– UW ANNUAL CONSUMPTION 284,252 571,585 86,356 156,518 129,898 109,804 53,454 PRICE PER GALLON $1.40 $1.40 $1.40 $1.45 $1.45 $1.45 $1.45 ANNUAL FUEL COST1 $398,000 $800,000 $121,000 $225,000 $190,000 $160,000 $ 80,000
1 Numbers are rounded to nearest thousand
MAINTENANCE
In addition to maintenance labor, an estimate was made for maintenance materials, annual maintenance, inspection, and an allowance for unplanned maintenance. KC and KT experience was used to develop these estimates.
Table 6 – Annual Maintenance Expenditures
Bellingham– Friday Harbor Tacoma– Seattle Clinton– Everett Renton– South Lake Union Renton– UW Kenmore– UW Kirkland– UW MAINTENANCE LABOR1 $ 206,000 $ 411,000 $ 287,000 $ 472,000 $ 327,000 $ 327,000 $ 327,000 ROUTINE, ANNUAL, AND UNPLANNED 1 $ 202,000 $ 653,000 $ 156,000 $ 402,000 $ 205,000 $ 191,000 $ 152,000 TOTAL ANNUAL MAINTENANCE $ 408,000 $1,064,000 $ 443,000 $ 874,000 $ 532,000 $ 518,000 $ 479,000 1 Numbers are rounded to nearest thousand
INSURANCE AND OTHER OPERATING
Allowances were included for miscellaneous operating expenditures such as consumables, communications, and uniforms. Current Metro insurance costs were used to estimate insurance expenditures for the four lake routes. Average insurance rates, calculated from KCF and KT recent expenditures were used to develop an average annual insurance expenditure for the other routes.
MANAGEMENT AND SUPPORT
Management and support expenditures include indirect costs required to support the operations and maintenance of the service and include program and financial management, administrative staff salaries and benefits, payroll and financial system costs, and other overhead such as office space, office supplies and equipment, and professional services. The practices and
expenditures of both KC and KT informed the calculation of these costs for the seven routes. A factor was developed from KC and KT actual management and support as a percentage of direct operating and was applied to each selected route's estimated direct operating costs.
ROUTE FINANCIAL PROJECTIONS
A “snapshot” annual financial projection was prepared for each route. These annual operating expenditure forecasts reflect a mature service, typically between 5 to 10 years after start-up.
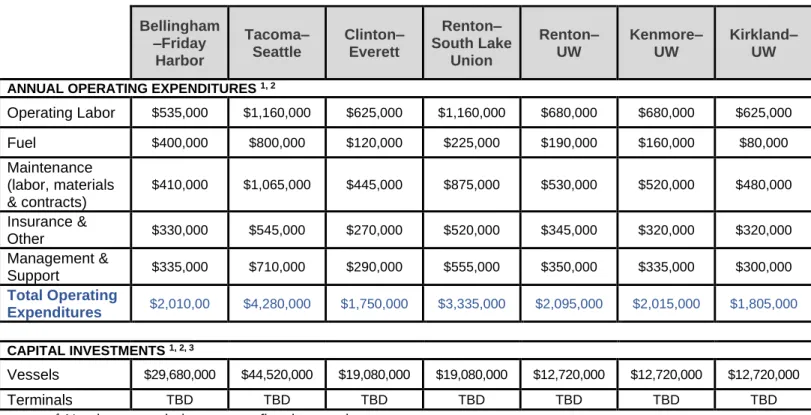
Table 7 – Route Financial Projections
Bellingham –Friday Harbor Tacoma– Seattle Clinton– Everett Renton– South Lake Union Renton– UW Kenmore– UW Kirkland– UW
ANNUAL OPERATING EXPENDITURES 1, 2
Operating Labor $535,000 $1,160,000 $625,000 $1,160,000 $680,000 $680,000 $625,000 Fuel $400,000 $800,000 $120,000 $225,000 $190,000 $160,000 $80,000 Maintenance (labor, materials & contracts) $410,000 $1,065,000 $445,000 $875,000 $530,000 $520,000 $480,000 Insurance & Other $330,000 $545,000 $270,000 $520,000 $345,000 $320,000 $320,000 Management & Support $335,000 $710,000 $290,000 $555,000 $350,000 $335,000 $300,000 Total Operating Expenditures $2,010,00 $4,280,000 $1,750,000 $3,335,000 $2,095,000 $2,015,000 $1,805,000 CAPITAL INVESTMENTS 1, 2, 3 Vessels $29,680,000 $44,520,000 $19,080,000 $19,080,000 $12,720,000 $12,720,000 $12,720,000 Terminals TBD TBD TBD TBD TBD TBD TBD
1 Numbers rounded to nearest five thousand 2 2020 dollars
3 Terminal capital investment estimates could vary widely depending on the chosen locations and design
solution. See Capital Costs – Landing Sites in the Analysis Results section of the report for a discussion of potential terminal investment costs.
FINANCIAL ANALYSIS SUMMARY FINDINGS
• Annual operating expenditures vary from as low as $1.8M for the shortest routes, Kirkland to University of Washington and Clinton to Everett, to over $4M for the longest route, Tacoma to Seattle.
• Recently, diesel prices have fluctuated greatly varying as much as almost 50% in 2020. Particularly with longer routes, price fluctuations have a notable impact on overall expenditures.
• For this analysis, each of the routes is treated as a stand-alone service. In practice, most successful passenger ferry services spread the cost and risk of operations across more than a single route, thus recognizing economies of scale for costs and leveraging larger labor pools and skill sets. Greater efficiencies and reduced operating risk may be accomplished through a single agency with multiple routes or through contracting for service from an existing public or private operators. Lower capital costs may also be possible through shared use of relief vessels.
• However, as noted earlier, expenditures tell only part of the story. While outside the scope of this analysis, a complete financial analysis should include a revenue forecast. Ultimately, route feasibility will be dependent upon assembling a revenue plan that will fully fund start-up capital investment and cover the total cost of operations.