Improving enterprise resource planning results using knowledge extraction and
learning
Alba Berzosa, Javier Sedano A.I. and Applied Electronics Dpt. Instituto Tecnol´ogico de Castilla y Le´on
Burgos, Spain
[email protected], [email protected]
Jos´e R. Villar, Marco Garc´ıa-Tamargo Computer Science Dpt. University of Oviedo Gij´on, Spain [email protected], [email protected] Emilio Corchado Dpt. de Inform´atica y Autom´atica Universidad Salamanca Salamanca, Spain [email protected]
Abstract—An Enterprise Resource Planning (ERP) system is a highly complex, large, multi-task application that is used to manage production in companies and factories. It monitors and tracks every aspect of all factory-based manufacturing processes. The integration of ERP and Business Process Man-agement (BMP) systems facilitates information sharing between both systems. It represents one of the main challenges in the literature. Budgeting tasks represent one area in which ERP and BPM may be integrated. In this work several soft computing methods are applied to obtain a model which will help experts estimate performance. The results of the study show if the data gathered from the plant is informative enough, in order to integrate and shared it among the manufacturing and the business management software.
Keywords-Industrial applications, Manufacturing Execution Systems, Enterprise Resource Planning, Fuzzy Rule Based Systems, Applied Soft Computing
I. INTRODUCTION
Over recent years, the presence of Information Technol-ogy (IT) in industry has increased considerably. IT has been applied to different tasks such as assisting with pro-duction or on-line process management and manufacturing, which includes what are nowadays known as Enterprise Resource Planning (ERP) and Manufacturing Resource Plan-ning (MRP) [12], [20].
Manufacturing Execution Systems (MES) are information systems that are used to manage the way in which manu-facturing resources -equipment, employees and inventories-are planned [2], [6], [19].
According to the context where it is designed, either a production control system or a manufacturing, monitoring and supervision system, the objective of the MES varies from providing the company with a research laboratory for products and processes to computer-aided systems that assist with decision-making processes related to manufacturing.
However, designing and deploying a user-friendly MES, which fulfills the above-mentioned objectives, represents a significant challenge, owing in great part to the complexity of the different production systems, plants and products in use. In this study, several soft-computing techniques are
applied in order to assist with budgeting processes at a fire hoses factory.
Furthermore, the main objective of this study is to analyse the possibility of developing a computer-based assistant to detect faults and loss of competitiveness integrated in the a real production system MES. The problem is defined in the following section, while in section III the selected models are described and the results are discussed. Finally, the conclusions and future lines of work are outlined.
II. THE CASE OF STUDY
In this study, the system will be applied to a fire hoses factory in Spain that manufactures various products, such as tubes, high pressure hoses for fire safety equipment in build-ings and other fire safety system products. Its production process is divided in three different areas: the preprocessing area, the fabric-manufacturing area and the injection area. In the preprocessing area, the required quantity of raw material, mainly nylon thread, is twisted in a dextrorotatory direction. Then, the fabrics are woven and the different diameter and length of hose is manufactured. Finally, the hoses are injected with rubber to obtain the final product. This study is concerned with the intermediate fabric-making area.
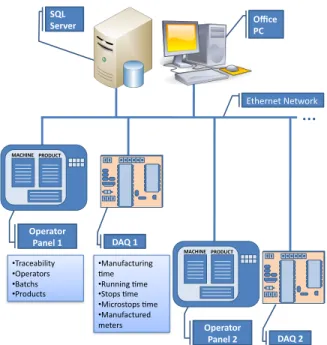
Figure 1 depicts the schema of the local fire hoses factory where the production system is totally supervised and monitored. Each machine includes its own control system based on Programmable Logic Controllers (PLC). There are up to 58 machines, each producing a range of different products. There are also several operator panels connected to an ethernet network and a Data Acquisition System (DAQ) which collects various process signals, such as meters manufactured and operating times, among others. The operators can control and operate the programmed machines to manufacture the product. Finally, the monitoring and supervising computers are connected to this network to request information from the operator panel and DAQs. This is known as the Manufacturing Control System (MCS). On November 2008, the company started to store available data in a data-base management system to broaden the capacity
Ethernet Network DAQ 2 Operator Panel 2 DAQ 1 Operator Panel 1 Office PC SQL Server MACHINE PRODUCT MACHINE PRODUCT
…
• Traceability • Operators • Batchs • Products • Manufacturing >me • Running >me • Stops >me • Microstops >me • Manufactured metersFigure 1. Schematic diagram of the MES installed in the fire hoses factory. The DAQs and operator panels connected through the field network constitute the MCS.
of its staff to plan production processes in the factory, and a certain amount of historical data is considered in this study. The MES has to be integrated into this scenario where production dynamics should firstly be determined. For this purpose, it is necessary to define the manufacturing con-ditions in the current operational stage, in the form of the data that may be gathered from the MCS network. Once the manufacturing dynamics data have been gathered, a model of the present production operation may be obtained [5]. In other words, the relevant variables for measurement and storage need to be determined.
A. The expected objectives
The main objective of this study is to analyse the possi-bility of detecting loss of competitiveness in the production system, and to set up a computer-based assistant to help ex-perts at the factory. The case of study is la real world factory in Spain. Therefore, rather than storing all the data from the MCS, only the signals that were sufficiently informative of the process evolution were considered necessary [3]. As this represents a virtually costless task, the factory representative and the research group agreed to present a prototype for a simpler task and depending on its outcome the factory would invest in the system.
The computer-based system assists the staff in budgeting a manufactured product. When a client orders a product, staff provide the system with data on the product, the client and the machine that will manufacture it. The outcome of the system is the estimated performance in terms of
meters manufactured and operating times. This is as yet not automated within the MCS, so before assigning a machine chain the employee must analyse several plots and reports. Thus, the challenge was to analise the available data from a real production process in order to evaluate the possibility of developing a model to automatically assist the staff in es-tablishing the performance level for a tuple<product, client, machine >. A data set of 2848 examples was collected from the factory last year production data and including the available historical records of 11 input variables such as product and machine identification, meters manufactured and operating times among others. The output of the data set was a variable indicating whether the performance was high, medium or low according to meters manufactured and operating times.
III. GENERATING THE MODELS FOR COMPUTER-AIDED DECISION MAKING
Several tasks were carried out once the data set was defined. Firstly, the data set had to be analysed and pre-processed, in order to determine whether there were any dependent variables. It was also analysed to decide whether it was necessary to normalise and partition the data. KEEL software was used [1] in all the experimental and modelling stages.
A. Soft Computing tools and algorithms used
KEEL stands for Knowledge Extraction based on Evo-lutionary Learning. KEEL software is a research and ed-ucational tool for modelling data mining problems which implements more than one hundred algorithms, including classification, regression, clustering, etc. Moreover, it in-cludes data preprocessing and post-processing algorithms, statistical tests and reporting facilities. Finally, it has a module for data set analysis and formatting, which was used for the first task in this experiment.
As the model would be used as an IT support tool, it was thought desirable to obtain a white box model, such as Fuzzy Rule-Based Systems or Decision Trees. Several different techniques proved able to manage these type of available data. Different techniques compared the results and the viability of the models. The statistical methods included Quadratic Discriminant Analysis (QDA) [13], the Multino-mial Logistic regression model with a ridge estimator (LOG) [4], the Kernel Classifier (KC with 0.01 and 0.05 sigma values) [13], and the K-nearest neighbour (KNN with 1 and 3 K values) [8]. The fuzzy rule-based methods included the Fuzzy Adaboost rule learning method (ADA) [11], the Fuzzy GA-P algorithm (FGAP) [16] and the Ishibuchi Hybrid Fuzzy GBML (HFG) [10]. Finally, the decision tree and decision tree rule-based methods were the well-known C4.5 [14] and C4.5 rule-based methods. (C45R) [15].
In the QDA algorithm, the cost of classifying an example
the unconditional prior class k probability estimated from the weighted sample, and µk and Σk are the population
mean vector and covariance matrix for the k class. Hence, an example X is assigned with the minimum cost class as stated in Eq. 2.
dk(X) = (X−µk)TΣk−1(X−µk) + ln|Σk| −2 lnπk (1)
dˆk(X) =min1≤k≤Kdk(X) (2)
The LOG algorithm is based on the standard logistic regression. The probability that the class k correctly classi-fies the example X ={X1, ..., Xp} is calculated following
Eq. 3,where the parameter β = {β1, . . . , βp} is estimated,
i.e., with the maximum likelihood estimation obtained by maximising Eq. 4. Then, exampleXis classified in the class with the higher probability.
p(k|X) = exp( Pp j=1βjXj) 1 + exp(PK j=1βjXj) (3) l(β) =X k [klogp(k|X) +¬klog{1−p(k|X)}] (4)
The Kernel method is a classifier that uses the Bayes rule using a “non-parametric estimation of the density functions through a Gaussian kernel function” as stated in [9]. Tuning is performed in the KEEL software covariance matrix by means of an ad-hoc method. On the other hand, the K-nearest neighbour method classifies the example X with the majority class in the K examples of the data set with a shorter distance toX. Note that the use of the KNN implies that a metric is defined in the space to measure the distance between examples.
The Fuzzy Adaboost method is based on boosting N weak fuzzy classifiers (that is, N unreliable fuzzy classifiers are weighted according to their reliability) so that the whole outperforms each of the individual classifiers. Moreover, each example in the training data set is also weighted and tuned in relation to the evolution of the whole classifier.
The GAP is a Fuzzy Rule-Based Classifier learned with the Genetic Programming principles but using the Simulated Annealing algorithm to mutate and to evolve both the struc-ture of the classifier and the parameters. At each iteration, the whole Fuzzy Rule set will evolve.
The Ishibushi Hybrid Fuzzy Genetic Based Machine Learning method represents a Pittsburgh style genetic learn-ing process which is hybridized with the Michigan style evolution schema: after generating the(Npop−1)new Fuzzy
Rule sets, a Michigan style evolutionary scheme is applied to each of the rules for all the individuals. Recall that each individual is a complete Fuzzy Rule set.
Finally, the C4.5 algorithm is a well-known decision-tree method based on information entropy and information gain.
A node in the decision tree is supposed to discriminate between examples of a certain class based on a feature value. At each node, the feature that produces the higher normalised information gain is then chosen. In the case of C4.5R, the decision tree is presented as rules, where each node in the path from the root to a leaf is considered an antecedent of the rule. These rules are then filtered to eliminate redundant or equivalent rules.
B. The experimentation and results
The data collected from the MES real data gathered during last year was analysed and it was found that several examples corresponded to erroneous samples, which were discarded. Finally, the data set included 2350 examples corresponding to 34 machines.
Several relationships were found, such as between the meters ordered and the meters manufactured. In the end, the data set included information on the product, the machine, the meters to produce and the operating times. The output variable was the class of the performance level, which could be Low,MediumorHigh.
The second task involved the modelling step, which is responsible for training the different algorithms and perform-ing the statistical tests. The nine methods described in the previous Sub-Section were used to obtain a classifier. An interpretable model was desired, such as those obtained from decision trees or Fuzzy Rule Based Systems, so the staff would gain confidence in the model. Most of the different techniques are capable of generating interpretable models. In spite of the interpretability, some black box models are used for comparing and validating the results.
Two series of experiments were designed. The first exper-iment generated two classifiers: the first one discriminates the Low and the not Low (¬Low) classes, while the second model, which is run when a ¬Low example is found, differentiates the Medium and the High classes.
As a result of the first experiment, two different data sets were generated: one contained the examples classified as class Low or ¬Low, and another one contained only the ¬Low examples classified by the corresponding class Medium or High. The second experiment made use of all 2350 examples in the data set to generate a 3-class classifier. Finally, in both cases, as the number of examples was so small, the 10-fold cross-validation schema was selected and performed in a KEEL environment.
The results from the first experiment are presented in Table I, Figure 2 and Figure 3. As it can be seen, all the methods performed in a similar manner, except for the K-nearest neighbours, the C4.5 and the Rule Based C4.5. In all cases, the boxplots are calculated using the percentage of correctly classified examples.
In view of the results and considering the standard devia-tion of the FGAP and the HFG algorithms, it could be said that these two methods could improve their performance by
{Low,¬Low} {Medium, High}
GCE SGCE CC GCE SGCE CC
C4.5 0.3094 0.0146 0.6906 0.2026 0.0263 0.7974 C4.5R 0.3026 0.0320 0.6974 0.2923 0.0468 0.7077 KC01 0.3102 0.0162 0.6898 0.2325 0.0260 0.7675 KC05 0.5728 0.0286 0.4272 0.2209 0.0302 0.7791 KNN1 0.5728 0.0286 0.4272 0.5064 0.0260 0.4936 KNN3 0.5332 0.0376 0.4668 0.3319 0.0533 0.6681 LOG 0.3157 0.0112 0.6843 0.4454 0.0305 0.5546 QDA 0.3200 0.0163 0.6800 0.3100 0.0443 0.6900 FGAP 0.2864 0.0208 0.7136 0.2544 0.0343 0.7456 ADA 0.3111 0.0232 0.6889 0.2221 0.0211 0.7779 HFG 0.2923 0.0182 0.7077 0.2398 0.0413 0.7602 Table I
MEAN RESULTS OF THE CLASSIFIERS FOR THE{LOW,¬LOW}
{MEDIUM, HIGH}EXPERIMENTS. GCE, SGCEANDCCSTAND FOR
GLOBALCLASSIFICATIONERROR,STANDARD DEVIATION OF THEGCE
AND THE PERCENTAGE OF CORRECTLY CLASSIFIED EXAMPLES.
0.7 0.75 0.8 0.85
KC01 KC05 KNN1 KNN3 LOG QDA ADA C45 C45R HFG FGAP
Figure 2. Boxplot of the classifiers results for the {Low, ¬ Low} experiments.
means of a better definition of their parameters (population and sub-population sizes, number of islands, etc.) and a higher number of generations. It is worth mentioning that there is no statistical justification for choosing one method as the best one.
The performance of all the methods differs in the second experiment (please, refer to Table II). A higher variability in the performance of the different methods was observed, except in the Quadratic Discriminant Analysis. Moreover, a much poorer performance for all methods was obtained, in some cases upt to the 30% of classification error. This lack of performance could be due to the kind of features involved in
0.7 0.75 0.8 0.85
KC01 KC05 KNN1 KNN3 LOG QDA ADA C45 C45R HFG FGAP
Figure 3. Boxplot of the classifiers results for the {Medium, High} experiments. GCE SGCE CC C4.5 0.3932 0.0238 0.6068 C4.5R 0.5145 0.0283 0.4855 KC01 0.3974 0.0304 0.6026 KC05 0.6404 0.0189 0.3596 KNN1 0.6404 0.0189 0.3596 KNN3 0.6179 0.0233 0.3821 LOG 0.5715 0.0280 0.4285 QDA 0.4655 0.0317 0.5345 FGAP 0.4511 0.0414 0.5489 ADA 0.3953 0.0277 0.6047 HFG 0.5940 0.0410 0.4060 Table II
MEAN RESULTS FOR THE{LOW, MEDIUM, HIGH}CLASSIFIER
EXPERIMENT. GCE, SGCEANDCCSTAND FORGLOBAL
CLASSIFICATIONERROR,STANDARD DEVIATION OF THEGCEAND THE
PERCENTAGE OF CORRECTLY CLASSIFIED EXAMPLES.
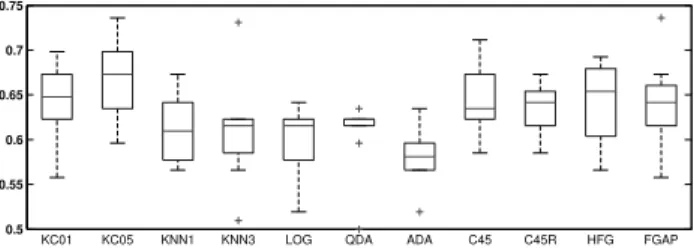
0.5 0.55 0.6 0.65 0.7 0.75
KC01 KC05 KNN1 KNN3 LOG QDA ADA C45 C45R HFG FGAP
Figure 4. Boxplot of the classifiers results for the{Low,Medium, High} experiments.
the modelling; several of them being integer valued features with an unknown upper limit. As an example, the number of units to be produced is to a great extent dependent on the machine, as each machine has a maximum production rate. But this data was not available at the time of the experiment, so it was not possible to normalize those variables which, in turn, let to a poorer performance of the classifiers.
A main conclusion may be drawn from this experiment: the data set should be more informative and representative of the problem, if better models are to be generated.
The company should rely on an in-depth analysis of available data and measurements, but it is also necessary to study the relationships between the variables, i.e. us-ing Cooperative Maximum Likelihood Hebbian Learnus-ing (CMLHL) [7] as shown in [18], [17]. The results illustrate the way in which the research team may help the company to design their MES.
IV. CONCLUSION
In this study different machine learning methods have been tested to improve a MES for a computer assisted bud-geting problem. A MES development to improve its capacity and link up with other business management applications has also been tested. It was shown that the data gathered from a MCS must be carefully chosen and the amount of data should be representative and informative of the real
process. This study shows that the gathered data was not informative enough and a better data harvesting should be faced. Moreover, efficiency and performance indexes should be defined so the relationships between the features can be detected.
From the conclusions of this study some future work arises. Firstly, it would be interesting to model the rela-tionships between operators, machines, products and the overall performance of the plant, so the production rates can be modelled. The more knowledge that is extracted from the data, the better the expected results. Consequently, a full analysis of the data through the use of well-known techniques would contribute to more reliable MES design and engineering.
ACKNOWLEDGMENT
This research work has been funded by the Spanish Ministry of Science and Innovation, under grant TIN2008-06681-C06-04 and the Spanish Ministry of Science and Innovation through project PID 560300-2009-11 . This research is also partially supported by projects TIN2010-21272-C02-01 from the Spanish Ministry of Science and Innovation and BU006A08 of the JCyL. The authors would also like to thank the manufacturer of components for vehi-cle interiors, Grupo Antolin Ingeniera, S.A. which provided support through MAGNO 2008 1028 CENIT funded by the Spanish Ministry of Science and Innovation.
REFERENCES
[1] J. Alcal´a-Fdez, L. S´anchez, S. Garc´ıa, M.J. del Jesus, S. Ventura, J.M. Garrell, J. Otero, C. Romero, J. Bacardit, V.M. Rivas, J.C. Fern´andez, F. Herrera,KEEL: A Software Tool to Assess Evolutionary Algorithms to Data Mining Problems, Soft Computing13:3(2009) 307–318.
[2] Apriso Corporation, Manufacturing Execution Systems Strategy Update: Trends and Tips for 2010, http://www.bitpipe.com/detail/RES/1268690867 382.html. [3] A. Berzosa, J. Sedano, J. R. Villar, E. S. Corchado and E. de la
Cal,Integrating Manufacturing Execution and Business Man-agement systems with soft computing, Proceedings of the 2010 International Conference on Computational and Mathematical Methods in Science and Engineering (2010).
[4] S. le Cessie and J.C. van Houwelingen,Ridge Estimators in Logistic Regression, Applied Statistics41:1(1992) 191-201. [5] R. S. Chen and Y. S. Tsai and C. C. Chang,Design and
im-plementation of an intelligent manufacturing execution system for semiconductor manufacturing industry, Proceedings of the 2006 IEEE International Symposium on Industrial Electronics (2006) 2948–2953.
[6] B. K. Choi and B. H. Kim, MES (manufacturing execution system) architecture for FMS compatible to ERP (enterprise planning system), International Journal of Computer Integrated Manufacturing15:3(2002) 274–284.
[7] E. Corchado and C.Fyfe, Connectionist techniques for the identification and suppression of interfering underlying factors, International Journal of Pattern Recognition and Artificial Intelligence17:8(2003) 1447-1466.
[8] T.M. Cover and P.E. Hart,Nearest Neighbor Pattern Classi-fication, IEEE Transactions on Information Theory13(1967) 21-27.
[9] Salvador Garc´ıa and Francisco Herrera,An Extension on ”Sta-tistical Comparisons of Classifiers over Multiple Data Sets” for all Pairwise Comparisons, Journal of Machine Learning Research9(2008) 2677-2694.
[10] H. Ishibuchi and T. Yamamoto and T. Nakashima, Hybridiza-tion of Fuzzy GBML Approaches for Pattern ClassificaHybridiza-tion Problems, IEEE Transactions on Systems, Man and Cybernet-ics - Part B: CybernetCybernet-ics35:2(2005) 359-365.
[11] M.J. del Jesus and F. Hoffmann and L. Junco and L. S´anchez,
Induction of Fuzzy-Rule-Based Classifiers With Evolutionary Boosting Algorithms, IEEE Transactions on Fuzzy Systems 12:3(2004) 296-308.
[12] M. McClellan,Introduction to Manufactoring Execution Sys-tems, Proceedings of MES Conference and Exposition, USA 2001.
[13] G.J. McLachlan, Discriminant Analysis and Statistical Pat-tern Recognition, John Wiley and Sons, 2004.
[14] J.R. Quinlan,C4.5: Programs for Machine Learning, Morgan Kauffman, 1993.
[15] J.R. Quinlan, MDL and Categorical Theories (Continued). Machine Learning: Proceedings of the Twelfth International Conference. Lake Tahoe California (United States of America, (1995) 464-470.
[16] L. S´anchez and I. Couso and J.A. Corrales, Combining GP Operators With SA Search To Evolve Fuzzy Rule Based Classifiers, Information Sciences136:1-4(2001) 175-192. [17] J. Sedano and J. R. Villar and E. S. Corchado and L.
Curiel and P. M. Bravo,Modelling a Pneumatic Drill Process by a two-steps AI Model, International Journal of Computer Mathematics86:10-11(2009) 1769-1777.
[18] J. Sedano and L. Curiel and E. Corchado and E. de la Cal and J. R. Villar,A soft computing method for detecting life-time building thermal insulation failures,Integrated Computer-Aided Engineering10:2(2010) 103-115.
[19] B. S. de Ugarte and A. Artiba and R. Pellerin,Manufacturing execution system - a literature review, Production planning and control20:6(2009) 525–539.
[20] L. Van Dyk, Manufacturing execution systems, MEng dissertation, University of Pretoria, Pretoria, http://upetd.up.ac.za/thesis/available/etd-11092006-125332/, (1999).