Modelling fermenters with CFD
Pasi Moilanen, Marko Laakkonen and Juhani AittamaaHelsinki University of Technology, Laboratory of Chemical Engineering P.O. Box 6100, FIN-02015 HUT, Finland
Abstract
Agitated gas-liquid reactors are widely used in the biochemical industry. In aerobic fermenters the dissolution of oxygen to the fermentation broth is important for the efficient operation of the reactor. In order to make accurate designs for bioreactors the local reaction and mass transfer conditions need to be modelled in detail. To validate the simulation results, experimental information is needed, but it is difficult to acquire from industrial fermenters. An alternative is to validate phenomenological models against experiments with a simpler model system. The validated models can then be used to simulate industrial scale fermenters.
A mixture of a transparent xanthan gum and additives was used as a shear-thinning model system to study hydrodynamics in gassed 14 and 200 dm3 stirred laboratory vessels. Physical properties, bubble size distributions, mixing energy and gas hold-up were measured. The used mixing intensities (0.1-3 W/kg) and gas feeds (0.1-1 vvm) are in line with industrial operating conditions.
A Eulerian Computational Fluid Dynamics (CFD) simulation of a 70 m3 industrial fermenter was made. The measured physical properties of 0.25 w-% aqueous xanthan solution and a bubble size of 2 mm were used. Gas-liquid mass transfer was modelled with two-film theory and simplified Maxwell-Stefan multicomponent diffusion. Xanthan gum bioreaction kinetics was included in the simulation. Local mass transfer and bioreaction were modelled, spread of gaseous NH3 and an aqueous nutrient were also simulated. The developed reactor model allows the identification of potential problem areas in fermenters.
Keywords: CFD, mass transfer, fermenter, non-Newtonian, mixing
1. Introduction and relevance
The goal is to develop a reactor model for mechanically agitated aerated fermenters. The ability of CFD to model local flow conditions is combined with the bioreaction kinetics and advanced gas-liquid mass transfer modelling. The oxygen mass transfer from gas to liquid represents the most important parameter implied on the design and operation of mixing and sparging equipment of bioreactors (Galaction et al, 2004). The fermentation media is often non-Newtonian with high, time-dependent viscosity. Previous experimental and CFD studies of pseudoplastic fluids have mostly been made European Symposium on Computer Arded Process Engineering – 15
L. Puigjaner and A. Espuña (Editors)
© 2005 Elsevier Science B.V. All rights reserved.
European Symposium on Computer Aided Process Engineering – 15 L. Puigjaner and A. Espuña (Editors)
with slightly non-Newtonian fluids e.g. (Venneker, 1999). There is a lack of experimental data from industrial operating conditions that could be used to validate simulation tools. The theoretical and experimental information gained in bioreaction chemistry, chemical engineering, and fluid mechanics needs to be combined to a modular design tool for bioreactors that can be used to identify possible problem areas inside fermenters.
2. Experimental
The laboratory experiments were performed in geometrically similar 14 and 200 dm3 vessel agitated by Rushton turbines. Gas was introduced through a ring sparger below the impeller. The vessel geometry is presented in our earlier study (Moilanen et al., 2003). Aqueous 0.25 and 0.75 w-% xanthan gum solutions (Keltrol BT) were investigated. Initially, biocide Na2S2O3 (0.15 w-%), lactose (2.0 w-%), sulphate (NH)4SO4 (0.25 w-%), phosphate KH2PO4 (0.25 w-%) and a defoamer Struktol SB2121 (0.2 ml/l) were included as additives to describe the actual fermentation media. Later on they were found to have a negligible effect on the physical properties of xanthan solutions. The viscosity, surface tension and density were measured with additives for 0.0, 0.25, and 0.75 w-% xanthan concentrations. Surface tension increased from 42 mN/m in water with additives to 46 mN/m in 0.75 w-% xanthan solution and was measured with KSV Sigma 70 tensiometer. Viscosity was measured with Brookfield DV-E viscometer. The Carreau model (e.g. Chabbra and Richardson, 1999, p.10) fitted best the measured shear-thinning behaviour of xanthan solutions. The maximum viscosities resulting from the fitting at zero shear were, 0.001, 0.215 and 13.23 Pas for 0.0, 0.25 and 0.75 w-% xanthan solutions.
Gas hold-up vs. gassing rate and mixing intensity were measured for the tap water, 0.25 and 0.75 w-% xanthan solutions in the 200 dm3 vessel and are presented in Figures 1a and 1b. The gas hold-up was measured from the height of the liquid surface. The gassed power consumption was measured from the torque of the impeller. Bubble rise velocities were investigated by injecting bubbles trough a pipe to stagnant xanthan solutions. Individual bubbles rose slower than bubbles in a trail. The effect became more pronounced at higher injection rates and with increasing xanthan concentrations. Local bubble size distributions (BSD) were measured from both vessels with digital photography. The experiments were made near the vessel walls from four equally distributed positions between the bottom and liquid surface. At each location, from 500 to 1000 bubbles were manually identified. There was little change in local BSDs, especially at xanthan concentration of 0.75 w-%. The majority of identified bubbles were smaller than 0.5mm. In the 200 dm3 vessel (390 rpm, 0.5 vvm, 0.25 w-% xanthan) below impeller plane, arithmetic mean diameter (d10=6di/6i) was 0.3 mm and Sauter mean diameter (d32 =6di3/6i2) was 1.8 mm. Majority of the gas volume is in bubbles smaller than 3 mm, but very large gas slugs (>10mm) were observed, indicating that volume BSDs are bimodal as was suggested by Khare et al. (1995). Small bubbles have a long residence times and they are most likely in equilibrium, so d32 was used in simulations.
0 2 4 6 8 10 0 0.25 G a s h o ld -u p [vo l-% ] 0.5 0.75 1 Gassing rate [vvm ] 0 2 4 6 8 10 0.0 1.0 2.0 3.0 Mixing intensity [W/kg] G a s h o ld -u p [vo l-% ]
Figure1a.) Gassing rate [vvm] vs. gas hold-up [vol-%], 390 rpm.b.) Mixing intensity [W/kg] vs. gas hold-up, 0.5 vvm xanthan, 0.7 vvm water. Water = [ ], 0.25 w-%
xanthan =[ ], 0.75 w-% xanthan = [ ]
3. CFD simulations and results
CFD simulations were made with CFX-5.7 for the laboratory vessels to verify turbulence and bubble drag models. Structured grids of a60000 elements were used. Multiple frames of reference (MFOR) was used to simulate the impeller motion. The simulations were Eulerian with a constant bubble size of 2 mm. The selection of the turbulence model was considered by simulating one-phase xanthan flow fields in laboratory stirred tanks. The standard k-epsilon model produced high dynamic and eddy viscosities thus stagnating the flow. The shear stress transport (SST) turbulence model (Menter, 1994) accounts for the convection of shear stress. SST appeared to generate better flow fields in one-phase simulations when compared to the visual observations of laboratory stirred vessels.
The modelling of bubble rise velocities was important, since they affect the gas hold-up and hence the mass transfer area between gas and liquid. To consider the ‘trail’ effect in the modelling of bubble rise velocities a correction was needed. Total shear experienced by a bubble, is assumed to be a sum of the shear caused by the liquid flow and the flow of neighbouring bubbles. The latter term on right hand side of expression (1) was derived on the basis of mean free path of bubble in the liquid. The correction predicts the larger rise velocities of bubbles with increasing local gas hold-up and includes a system dependent variableK.
¸¸ ¹ · ¨¨ © § (1/3) ) 3 / 1 ( 32 * * 1
D
D
J
J
K d Uslip liq , (1)whereD is gas hold-up, d32 bubble Sauter mean diameter,Uslip bubble slip velocity, J shear rate. The bubble drag model of Margaritis et al. (1999) for non-Newtonian fluids was used. In the 200 litre vessel the value of K was determined by matching the experimental and simulated gas hold-up. At 390 rpm, 0.5 vvm gas feed and 0.25 w-% xanthan measured gas hold-up was 5.4 %, whereas CFD simulation yielded 5.7
vol-% with K=15. The volume averaged bubble slip velocity was 0.135 m/s, which corresponds well with the measured rise velocities of bubble trails in stagnant liquids. Two simulation cases were made to investigate local conditions in a 70 m3 industrial fermenter agitated by two Rushton impellers. Vessel dimensions: height 6.5 m, diameter 3.8 m. Impellers are at 1.25 and 3.75 m and ring sparger at 1.0 m from the bottom. Impeller diameter is 1.25 m and the reactor is fully baffled. An 180o segment of the vessel was simulated at gassing rate of 0.33 m3/s (NTP) and at impeller speed of 100 rpm. The measured properties of 0.25 w-% xanthan solution were used for the liquid phase. The pressure was set at 1.65 atm at bottom of vessel, due hydrostatic pressure.
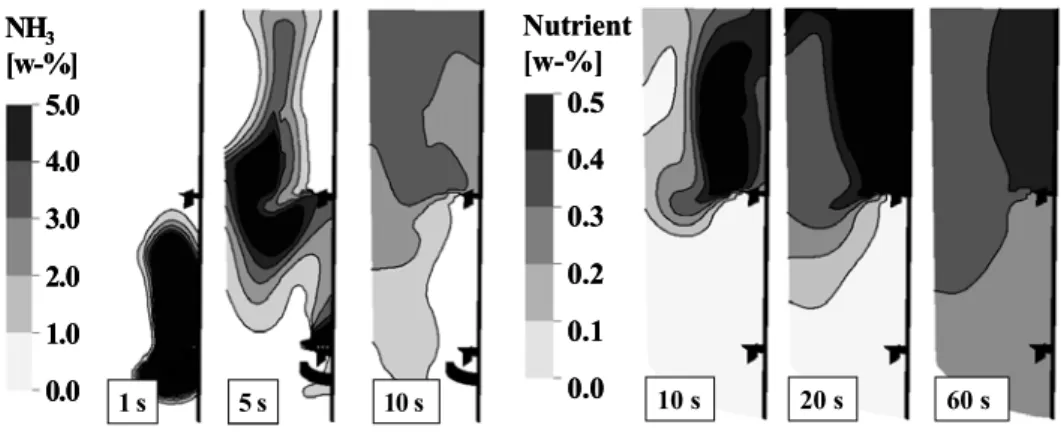
0.5 0.4 0.3 0.1 0.2 0.0 Nutrient [w-%] 10 s 20 s 60 s 0.5 0.4 0.3 0.1 0.2 0.0 Nutrient [w-%] 0.5 0.4 0.3 0.1 0.2 0.0 Nutrient [w-%] 10 s 20 s 60 s 5.0 4.0 3.0 1.0 2.0 0.0 NH3 [w-%] 1 s 5 s 10 s 5.0 4.0 3.0 1.0 2.0 0.0 NH3 [w-%] 5.0 4.0 3.0 1.0 2.0 0.0 NH3 [w-%] 1 s 5 s 10 s
Figure2 a.) The spread of gaseous ammonia,b.) The spread of aqueous nutrient Simulation 1: The mixing of sparger fed gaseous NH3 (pH control) and an aqueous nutrient solution at the surface was simulated (Figures 2a and 2b). In one second 0.4 kg of NH3 and 100 kg of nutrient was added to the fermenter. It can be seen that the lower impeller is flooded and the gas is dispersed at the second impeller, the re-circulation of gas to the lower part of the vessel is poor. The average residence time of the gas is between 5 and 10 seconds. Mixing the aqueous nutrient adequately takes more than 60 seconds. There exists liquid compartmentalisation above the upper impeller.
Simulation 2: Gas-liquid mass transfer was introduced with the xanthan reaction kinetics (Carcia-Ochoa et al., 2000). The kinetics includes a balance for biomass, carbon source, nutrient, xanthan, and dissolved oxygen in water. Generation of CO2 was assumed as 47 % of the consumed carbon source amount.
The calculation of gas-liquid mass transfer fluxes is based on the two-film Maxwell-Stefan diffusion with Toor-Stewart-Prober linearization of constant physical properties on diffusion path (see Taylor and Krishna, 1993). The simplifications presented by Alopaeus (2001) were considered to speed-up the iterative solution. The result of previous iteration of mass transfer fluxes was stored and used as an initial guess in the next iteration step to speed-up the convergence. Mass transfer calculations took 11% of the total CPU time. Local physical properties were calculated using component
databases of in-house code FLOWBAT and passed with the local component concentrations, mixing intensity, temperature and pressure provided by CFX-5.7 to the mass transfer model. The mass transfer fluxes were then returned to the component balances as source/sink terms. The liquid film mass transfer coefficients were calculated from the correlation of Kawase and Moo-Young and the gas film coefficients from the rational approximation for the diffusion in a bubble (Alopaeus, 2001). The gas-liquid equilibrium was calculated from Henry’s law with constants for water at 20 °C. The effect of impurities on the equilibrium was neglected.
[kg/(m3*s)]
3c
3.4 e-3 5.0 e-3 4.2 e-3 4.6 e-3 3.8 e-3 3.0 e-3 [kg/(m3*s)]3c
3.4 e-3 5.0 e-3 4.2 e-3 4.6 e-3 3.8 e-3 3.0 e-3 [kg/(m3*s)] 5.0e-4 3.75e-4 2.5e-4 1.25e-4 0.0e-43b
0.0e-4 [kg/(m3*s)] 5.0e-4 3.75e-4 2.5e-4 1.25e-4 0.0e-43b
0.0e-4[w-%]
22.0 21.0 20.0 19.03a
[w-%]
22.0 21.0 20.0 19.03a
Figure3 a.) Oxygen content [w-%] in the gas phase, b.) Oxygen transfer rate from gas to liquid [kg/(m3s)],c.) Xanthan production rate [kg /(m3s)]
Gas-liquid mass transfer was simulated 16 seconds using a time-step of 20 ms. Mass percentage of oxygen in the gas phase is shown in Figure 3a. At sparger the concentration of O2 is set at 22 w-%. As the O2 dissolves into the liquid it’s concentration decreases in the gas. At the bottom of the vessel there is very little gas and the oxygen is consumed by the bioreaction, so this location is likely to become a dead spot as time goes by. In figure 3b the mass transfer-rate from gas to liquid is shown. The mass transfer is largest in the regions where the concentration of oxygen, gas hold-up and intensity of turbulence are the largest. It can be seen that there is little mass transfer away from the gas feed and impeller zones as expected. The xanthan production rate in Figure 3c is dependent of the amount of dissolved oxygen, being largest near the sparger.
The simulations show that local conditions can be predicted in the fermenters by combining the CFD with bioreaction kinetics and fundamental gas-liquid mass transfer modelling. This is a great benefit because experimental investigation of local conditions in an industrial fermenter is difficult. A clear improvement would be to incorporate population balances (PB) for bubbles to the reactor model. The incorporation of PBs would also improve the prediction local gas holdups and gas-liquid mass transfer areas in the reactor.
4. Conclusions
In large agitated fermenters reaction and mass transfer conditions are far from homogeneous. Information on local reaction and mass transfer conditions is needed to identify possible problem areas and to improve the fermentor operation. The measurement of local conditions from industrial fermenters is difficult. An alternative is to verify phenomenological physical models against a simpler laboratory model system that imitates the physical properties of actual fermentation broth. After this, the verified fermenter model allows the investigation of local conditions in the fermenter. In the present work, xanthan solutions were used as a model system. Gas-liquid hydrodynamics of xanthan solution was investigated in laboratory stirred tanks. The experimental results were then used for the model verification and as source information for the simulation of an industrial fermenter.
The CFD simulations of a 70 m3 xanthan fermenter revealed a significant inhomogeneity of local reaction and mass transfer conditions. The simulation results show that the phenomenological modelling together with the experiments allows the investigation of local reaction and gas-liquid mass transfer conditions in agitated fermenters. The prediction of local conditions could further be improved by including population balances for bubbles.
Acknowledgement: Asta Nurmela, Elina Nauha and Altti Alastalo are acknowledged for the experimental measurements. Financial support from NeoBio research program coordinated by the National Technology Agency of Finland (TEKES) is acknowledged.
5. References
Alopaeus, V., (2001), “Calculation of Multicomponet Mass Transfer between Dispersed and Continuous Phases”, Acta Polytechnica Scandinavia, 283, 35 p.Galaction, A.I., Cascaval, D., Oniscu, C. and Turnea, M., (2004), “Prediction of oxygen mass transfer coefficients in stirred bioreactors for bacteria, yeasts and fungus broths”, Biochemical Engineering Journal, 20 (1). Carcia-Ochoa, F., Castro, E.C., and Santos, V.E., (2000), “Oxygen transfer and uptake rates
during Xanthan gum production”, Enzyme and Microbiological Technology, 27, 680-690. Chhabra, R.P., and Richardson, J.F., (1999), “Non-Newtonian Flow in the Process Industries,
Fundamentals and Engineering Applications”, Butterworth-Heinemann, Oxford, 436 p. Khare, A.S., and K. Niranjan, (1995), “Impeller-Agitated Aerobic Reactor: the Influence of Tiny
Bubbles on Gas Hold-up and Mass Transfer in Highly Viscous Liquids”, Chemical Engineering Research and Design, 67, 526-536.
Margaritis, A., te Bokkel, D.W. and Karamanev, D.G., (1999), “Bubble Rise Velocities and Drag Coefficients in Non-Newtonian Polysaccharide Solutions”, Biotechnology and Bioengineering, 64 (3), 257-263
Menter, F.R., (1994), “two equation eddy-viscosity models for engineering applications”, AIAA-journal 32 (8).
Moilanen, P., Laakkonen, M. and Aittamaa, J., (2003), ”CFD Modeling of Local Bubble Size Distributions in Agitated Gas-Liquid Vessels – Verification Against Experiments”, Escape 14 – Lisbon (Portugal).
Taylor, R., Krishna, R., (1993). “Multicomponent Mass Transfer”, Wiley, New York, 579 p. Venneker, B., (1999), “Turbulent Flow and Gas Dispersion in Stirred Vessels with Pseudoplastic
![Figure 1a.) Gassing rate [vvm] vs. gas hold-up [vol-%], 390 rpm. b.) Mixing intensity [W/kg] vs](https://thumb-us.123doks.com/thumbv2/123dok_us/9371667.2816096/3.892.194.714.211.375/figure-gassing-rate-vvm-gas-hold-mixing-intensity.webp)
![Figure 3 a.) Oxygen content [w-%] in the gas phase, b.) Oxygen transfer rate from gas to liquid [kg/(m 3 s)], c.) Xanthan production rate [kg /(m 3 s)]](https://thumb-us.123doks.com/thumbv2/123dok_us/9371667.2816096/5.892.188.715.362.604/figure-oxygen-content-oxygen-transfer-liquid-xanthan-production.webp)
